3128
Assessment of tumor subregion complexity using fractal analysis in breast cancer1Department of Radiology, Yueyang Hospital of Integrated Traditional Chinese and Western Medicine, Shanghai University of Traditional Chinese Medicine, Shanghai, China, 2Central Research Institute, United Imaging Healthcare, Shanghai, China
Synopsis
Keywords: Data Analysis, Cancer
This study aimed to develop multiparametric physiologic MRI-based spatial habitat analysis and to validate the association between the habitats and the molecular subtypes. The distinct tumor habitats were identified using multiple MRI-parameter maps, then applied to calculate the volume fraction and fractal dimension (FD) and to investigate their diagnosis value. The combination of FD and volume fraction improves the discriminatory ability for TNBC from non-TNBC with an AUC to 0.951 from 0.853.Introduction
Triple-negative breast cancer (TNBC) is an aggressive clinical subgroup of breast cancer that lacks hormone receptors expression and HER2 gene amplification[1, 2]. Profound intra-tumor spatial heterogeneity has been postulated as a hallmark of treatment response in breast cancer[3], especially the reason of dilution of treatment response in TNBC[2]. Besides the existence of tumors, it is essential to determine this heterogeneity for treatment decisions. Therefore, the non-invasive imaging analysis that could fully exploit the intratumor heterogeneity is appreciated in diagnosing[4]. The fractal dimension is a scale-invariant parameter to characterize complex and non-regular objects, expressing the morphological complexity and the inner self-similarity as measured on different scales. The fractal structures of MRI have been previously studied[5, 6], but for the entire lesion without internal structure considered. Herein, the intratumoral heterogeneity was assessed by calculating the fractal dimension of each habitat. This work aimed to investigate the tumor heterogeneity of invasive breast cancers using the habitats and fractal analysis for the discrimination of the TNBC from non-TNBC.Methods
This retrospective study included 142 biopsy- and surgery-proven breast cancer (56 ±27 years) with 148 lesions that underwent MRI examination on a 3-T scanner (uMR 780, United Imaging Healthcare, Shanghai, China) before biopsy, surgical, and treatment. The sequences included: a) pre-contrast and b) contrast-enhanced 3D T1 weighted imaging (TR/TE, 4.8/1.99 ms; slice thickness, 0.66mm; FA, 10°; matrix size, 504×504; FOV, 340×340mm), c) diffusion weighted imaging (DWI) acquired with single shot echo planar imaging (TR/TE, 3702/67 ms; slice thickness, 5mm; FA, 90°; matrix size, 96×192; FOV, 190×380mm; b values, 50, 600,1000 s/mm2).Contrast-enhancing mass was divided into three spatial habitats by K-means clustering of voxel-wise wash-in/wash-out patterns and ADC values. Fractal dimension (FD) of the tumor subregions was calculated by fractal analysis. The effective voxel size can be varied by grouping blocks of cells, where >Herein the FD was obtained as the slope of the regression line for the log-log plot of the scanning box size and the count from a box-counting scan. The FD for the edge of each habitat is regarded as an expression of their invasiveness.
Results
Three habitats were defined as hypervascular habitat (high wash-in and high wash-out), hypovascular cellular habitat (low ADC and low wash-in/wash-out), and nonviable habitat (high ADC and wash-in/wash-out). TNBC had a lower volume fraction and higher FD for hypervascular habitat (all p < 0.001) than non-TNBC (Figure 1). The multivariate analysis confirmed that hypervascular habitat (OR=0.88) and its FD (OR=1.35) were independently associated with TNBC (all p < 0.001). The diagnostic model using a combination of volume fraction and FD for hypervascular habitat yielded an excellent discriminatory ability for differentiating TNBC from non-TNBC, with an AUC of 0.951 and an accuracy of 91.9%, as shown in Figure 2.Discussion
This study investigated the feasibility of FD in habitat analysis. The voxel fraction and the FD were both efficient in the delineation of TNBC and non-TNBC. Beyond the volume fraction of each habitat, their spatial distribution shows a significant diagnosis power. The FD in this work provided the complexity of each habitat on the basis of heterogeneity, showing that the complexity of hypervascular habitat in TNBC was larger than in non-TNBC. Given the correlation between heterogeneity and invasiveness[7], this phenomenon corresponded to the TNBC being more invasive[2]. A combination of habitat volume fraction and FD showed significant improvement in the diagnosis performance. The AUC increased to 0.951 from 0.853. This result indicates that the heterogeneity is representative of tumor aggressive independently, which might be the explanation for the inconsistency of previous studies[8, 9] where only the volume fraction was compared.Conclusion
The predictive model in combination of tumor habitats MRI and fractal analysis demonstrated favorable performance in the differential diagnosis of TNBC and non-TNBC.Acknowledgements
No acknowledgement found.References
1. Meyer, H.J., A. Wienke, and A. Surov, Diffusion-Weighted Imaging of Different Breast Cancer Molecular Subtypes: A Systematic Review and Meta-Analysis. Breast Care (Basel), 2022. 17(1): p. 47-54.
2. Abramson, V.G., et al., Subtyping of triple-negative breast cancer: implications for therapy. Cancer, 2015. 121(1): p. 8-16.
3. Wu, J., et al., Intratumoral Spatial Heterogeneity at Perfusion MR Imaging Predicts Recurrence-free Survival in Locally Advanced Breast Cancer Treated with Neoadjuvant Chemotherapy. Radiology, 2018. 288(1): p. 26-35.
4. Davnall, F., et al., Assessment of tumor heterogeneity: an emerging imaging tool for clinical practice? Insights Imaging, 2012. 3(6): p. 573-89.
5. Ma, J., et al., Is fractal dimension a reliable imaging biomarker for the quantitative classification of an intervertebral disk? Eur Spine J, 2020. 29(5): p. 1175-1180.
6. Park, Y.W., et al., Magnetic resonance imaging-based 3-dimensional fractal dimension and lacunarity analyses may predict the meningioma grade. Eur Radiol, 2020. 30(8): p. 4615-4622.
7. O'Connor, J.P., et al., Imaging intratumor heterogeneity: role in therapy response, resistance, and clinical outcome. Clin Cancer Res, 2015. 21(2): p. 249-57.
8. Kim, J.J., et al., Computer-aided Diagnosis-generated Kinetic Features of Breast Cancer at Preoperative MR Imaging: Association with Disease-free Survival of Patients with Primary Operable Invasive Breast Cancer. Radiology, 2017. 284(1): p. 45-54.
9. Nam, S.Y., et al., Preoperative dynamic breast magnetic resonance imaging kinetic features using computer-aided diagnosis: Association with survival outcome and tumor aggressiveness in patients with invasive breast cancer. PLoS One, 2018. 13(4): p. e0195756.
Figures
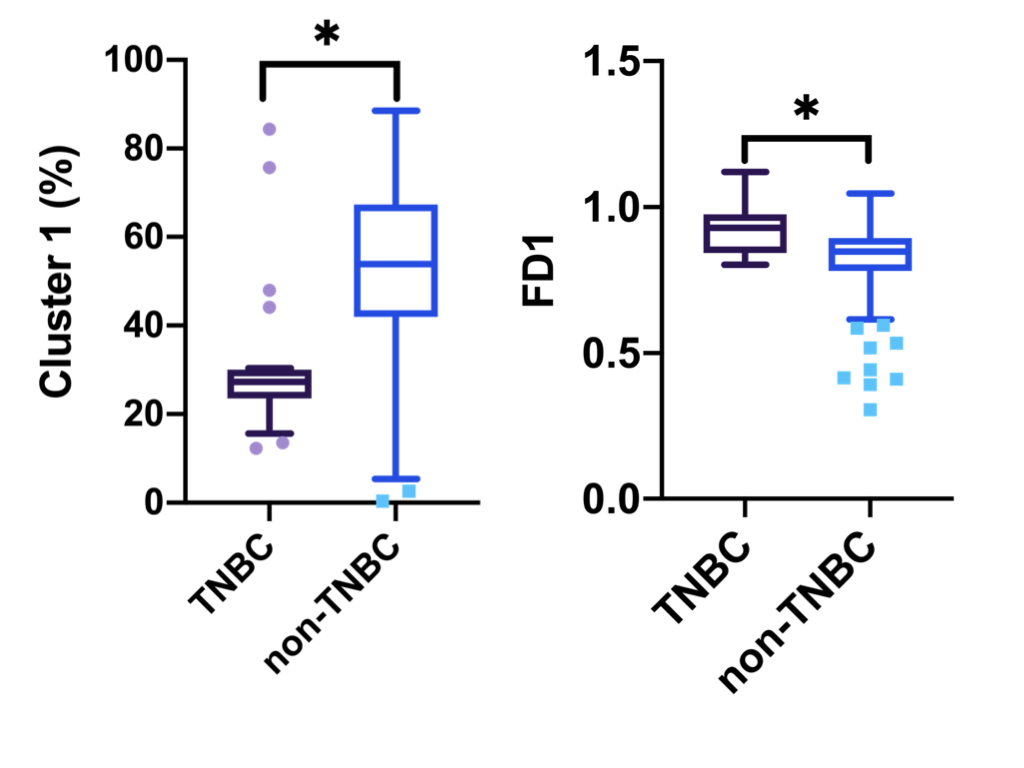
Figure 1. Box plots of volume fraction and fractal features in tumor subregions between the triple negative breast cancer (TNBC) and non-TNBC patients. Patients with TNBC showed a significantly higher FD 1 (a), and there were no significant differences in FD 2 (b) and FD 3 (c) between the two groups.
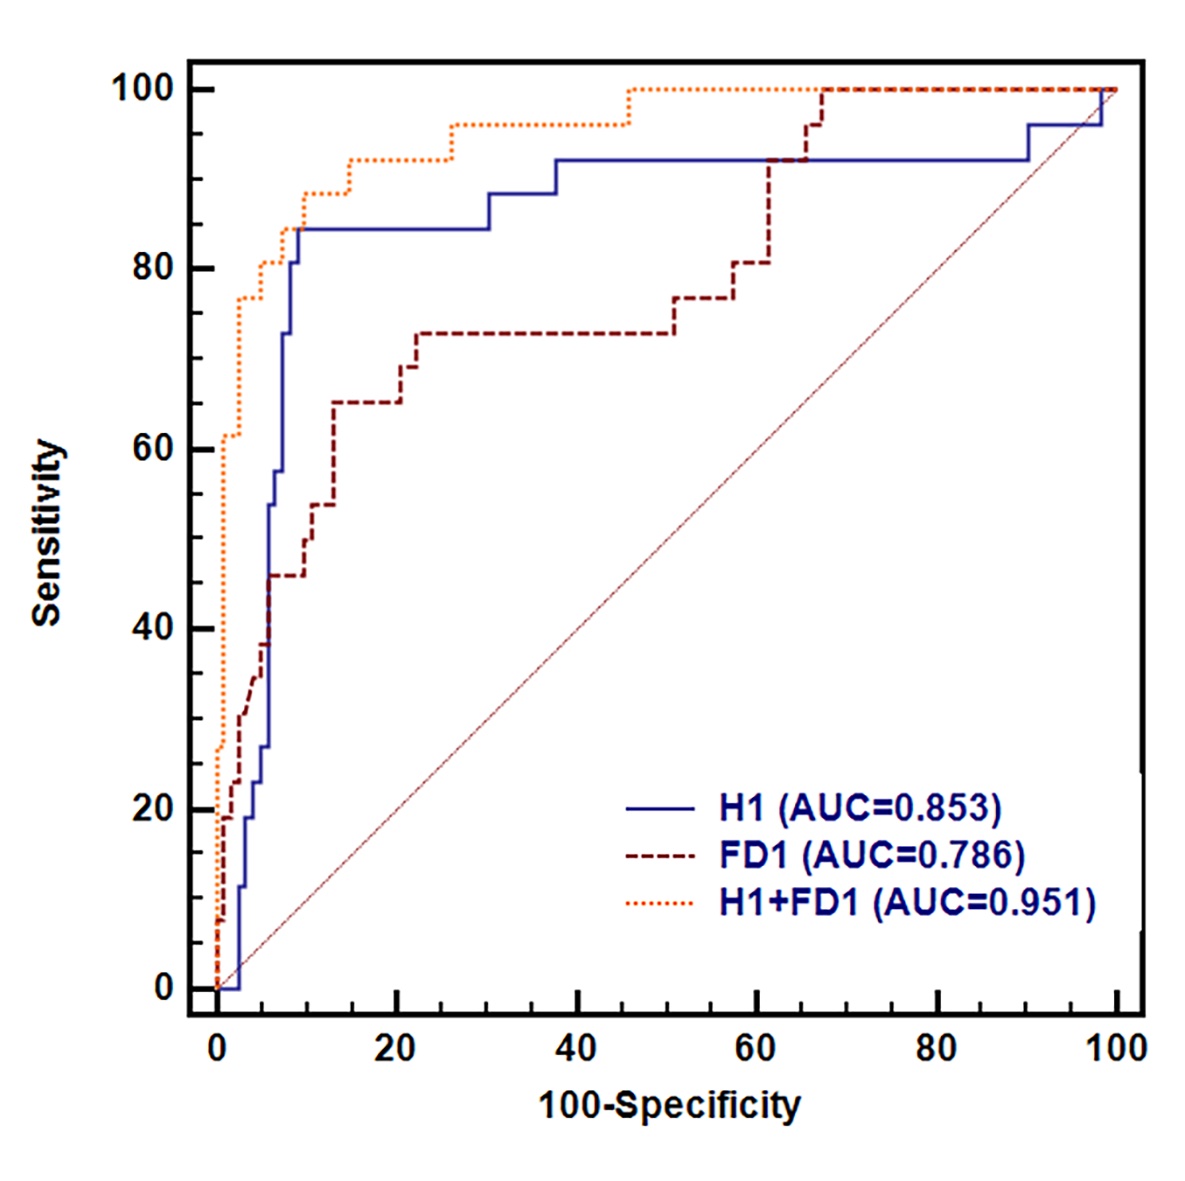
Figure 2. The comparisons of ROC curves of physiologic MRI habitat and fractal analysis for distinguishing TNBC from non-TNBC. ROC analysis revealed AUCs of 0.853 for Cluster 1 (95% CI, 0.786 to 0.906), 0. 786 for FD1 (95% CI, 0.711–0.849), and 0.951 Cluster 1 and FD1 (0.903 to 0.980) for differentiating between the TNBC and non-TNBC.