3123
Arterial phase detection when utilizing stack-of-stars dynamic Data Set with various pseudo contrast enhancement
Yutaka Hoshiyama1, Chunqi Wang2, Hong Yang2, Hideki Ota3,4, Atsuro Masuda4, Masahiro Kawabata4, Hideaki Kutsuna1, Kensuke Shinoda1, and Yoshimori Kassai1,3
1MRI Systems Division, Canon Medical Systems Corporation, Ohtawara, Japan, 2Research & Development Center, Canon Medical Systems (China) Co., Ltd, Beijing, China, 3Department of Advanced MRI Collaboration Research, Tohoku University Graduate School of Medicine, Sendai, Japan, 4Department of Diagnostic Radiology, Tohoku University Hospital, Sendai, Japan
1MRI Systems Division, Canon Medical Systems Corporation, Ohtawara, Japan, 2Research & Development Center, Canon Medical Systems (China) Co., Ltd, Beijing, China, 3Department of Advanced MRI Collaboration Research, Tohoku University Graduate School of Medicine, Sendai, Japan, 4Department of Diagnostic Radiology, Tohoku University Hospital, Sendai, Japan
Synopsis
Keywords: Data Analysis, Contrast Agent, Dynamic
We propose an automated method to present candidates of the arterial phase as the optimal time points from the liver contrast-enhanced MRI images based on the time intensity curve (TIC) analysis of the several ROIs. In clinical situation, there may be some differences of TIC due to a speed of uptake and washout and a quality of the image. In this study, the robustness of our proposed automated method was investigated by utilizing stack-of-stars dynamic images with various pseudo contrast enhancement effects. The results showed that our proposed automated method was applicable for such effects.Introduction
For the liver contrast-enhanced MRI under free breathing, a method for fast imaging and improving image quality has been proposed by combining the stack-of-stars acquisition and deep-learning(DL)-based reconstruction1. The stack-of-stars dynamic imaging is performed in a single continuous acquisition, providing all phases regardless of injection time.The imaging method allows to retrospectively reconstruct images with specifying the optimal time points and temporal resolution, however it increases the effort of the observers. To reduce such efforts, we propose an automated method to present candidates of the arterial phase as the optimal time points from the all phases based on the time intensity curve (TIC) analysis of the several ROIs2. In this study, the robustness of the detection method against the clinical possible different contrast enhancement effects was investigated.
Method
Figure 1 shows the outline of the detection method. The method consists of two parts, one is the detection part and the other is the TIC analysis part.In the detection part, a liver ROI and an aorta ROI are automatically detected, and the corresponding TICs are calculated. The liver ROI is detected from the first phase of the input images using U-Net3, which is one of the deep learning methods, and the aorta ROI is detected by difference between the first phase and the subsequent phase using combination of the multiple image processing such as binarization and morphology processing. Then, based on the detected ROIs, TICs are calculated. Furthermore, it also calculates the TIC of the whole image volume and the TIC of the coronal MIP (Co MIP) image without ROI detection.
In the TIC analysis part, the calculated 4 TICs are used in combination to determine the candidates of the arterial phase. Firstly, the range of the arterial phase is determined from the aorta ROI TIC (the start point of the arterial phase) and from the liver ROI TIC (the end point of the arterial phase), according to the definition that the arterial phase is after aorta enhanced and before portal/liver enhanced. Secondly, the default arterial phase is determined with the whole image volume TIC and the coronal MIP image TIC. Then, if the range of the arterial phase obtained by detected ROI TIC is not appropriate, the default start point or end point are adopted.
Finally, the average of the start point and the end point of the range of the arterial phase is rounded up, and the total of 3 phases (RoundUp(Mean(start, end))$$$\pm$$$1) are used as the arterial phase candidates. For the input images, the images were reconstructed with the time interval of 36 spokes corresponding to 8 seconds.
Evaluation
This study was approved by facility’s institutional review board and the informed consent was obtained from all subjects. For evaluation datasets, 18 Japanese clinical datasets were acquired on 3T MRI scanner (Canon Medical Systems Corporation), and 126 datasets that simulate the different contrast effects were generated from the 18 datasets. The pseudo data generation method is shown in Figure 2. We used the temporal resolution of 36 spokes per dynamic phase as original, 18 spokes as low SNR, and 108 spokes as high SNR.For the 18 datasets, visual scoring by checking DL images reconstructed with the temporal resolution of 36 spokes corresponding to 8 seconds per dynamic phase was performed by two radiologists. For each phase, the radiologists scored using a 4-point scale (4 points = Exactly it is arterial phase, 3 points = Can be regarded as an arterial phase, 2 points = Time points before and after the arterial phase, 1 point = Completely not the arterial phase). Then, the desired arterial phase for each radiologist as the ground truth was calculated by the average of the time points with the highest visual score. Finally, the detection success rate was calculated as the number of samples in which the ground truth was within the arterial phase candidates detected by our proposed automated method.
Results
Figure 3 shows the results for each dataset. The detection success rate was 97.2% for the 18 original datasets, and 97.6% for the overall 126 generated datasets.Conclusion
This study showed that our proposed automated method had robustness against the clinically-possible different contrast enhancement effects. It is expected that the workflow with our proposed automated method makes it easy to see images at the optimal time points.Acknowledgements
No acknowledgement found.References
1. H. Ota, H. Kutsuna, Y. Kassai, et al. “A Clinical Study of High Temporal-Resolution Stack-of-Stars Dynamic Liver MR Imaging Reconstructed with Temporal-Multiresolution Convolutional Neural Network.” Radiological Society of North America 2020.
2. H. Ota, et al. “Automated Hepatic Arterial-Phase Detection in High Temporal-Resolution Stack-of-Stars Dynamic Liver MR Imaging Reconstructed with Temporal-Multiresolution Convolutional Neural Network.” Radiological Society of North America 2022.
3. O. Ronneberger et al. U-Net: Convolutional Networks for Biomedical Image Segmentation. MICCAI 2015, pp.234-241, 2015.
Figures
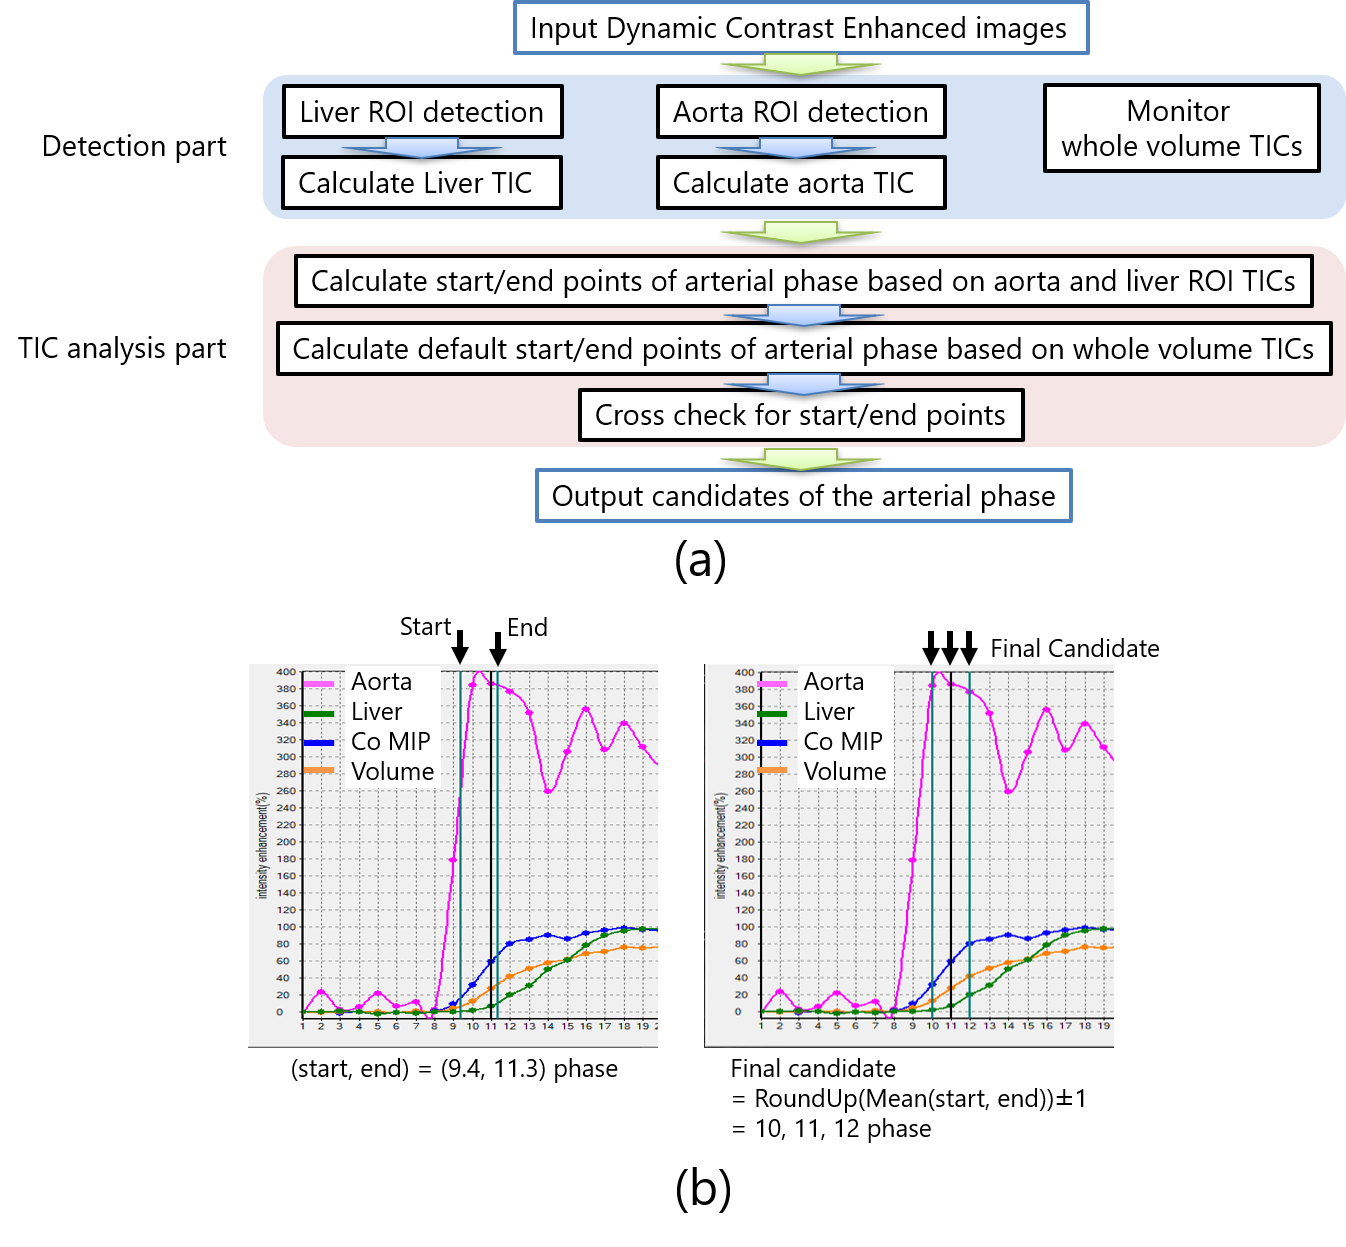
Figure 1: Outline of the proposed arterial phase detection method. (a) Illustration of the processing flow of the method. (b) Calculation method of the output arterial phase candidates.
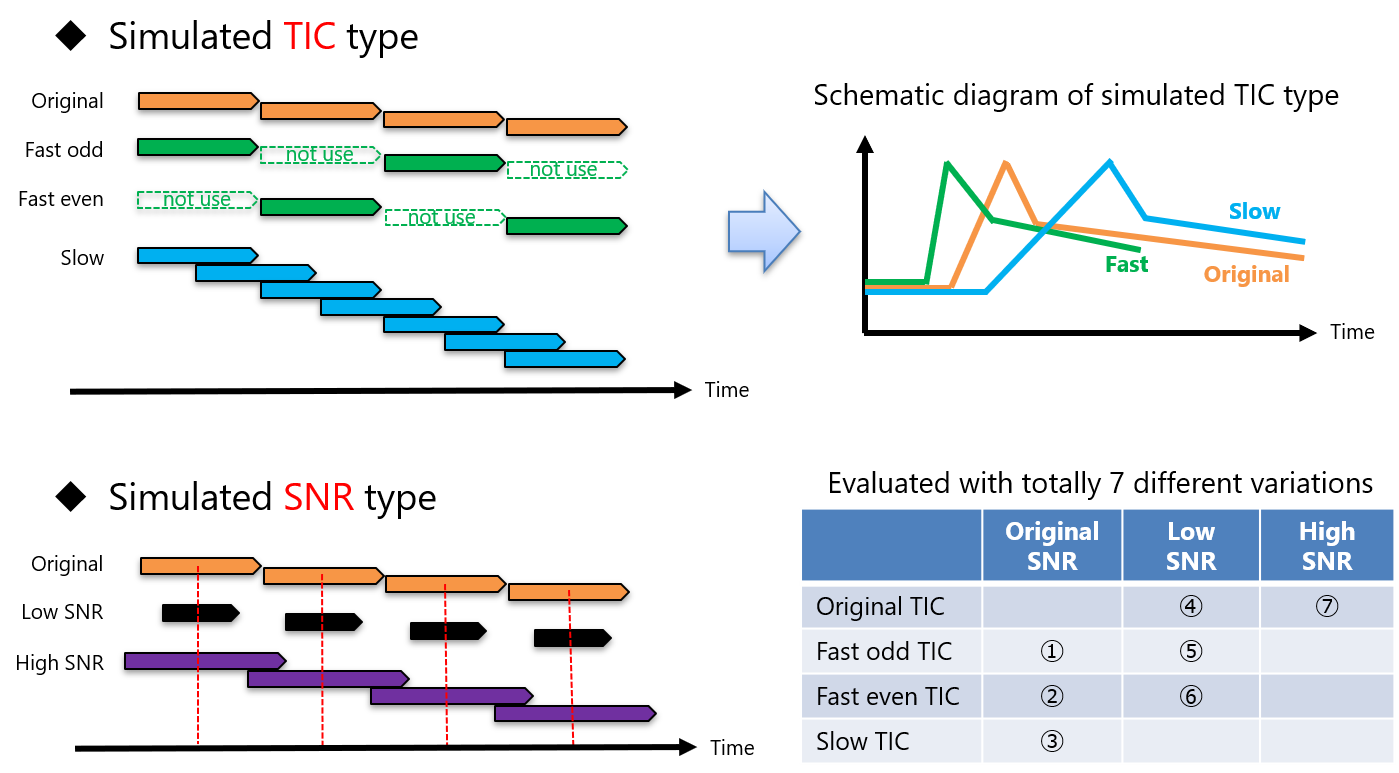
Figure 2: The pseudo data generation method to simulate the different contrast effects. We simulated clinically-possible differences, that is, uptake and washout speeds (TIC type), image quality (SNR type), and combinations of them. Totally, 7 different variations were generated. The data generation was performed by taking advantage of stack-of-stars feature of being able to reconstruct by changing the sampling width or density.
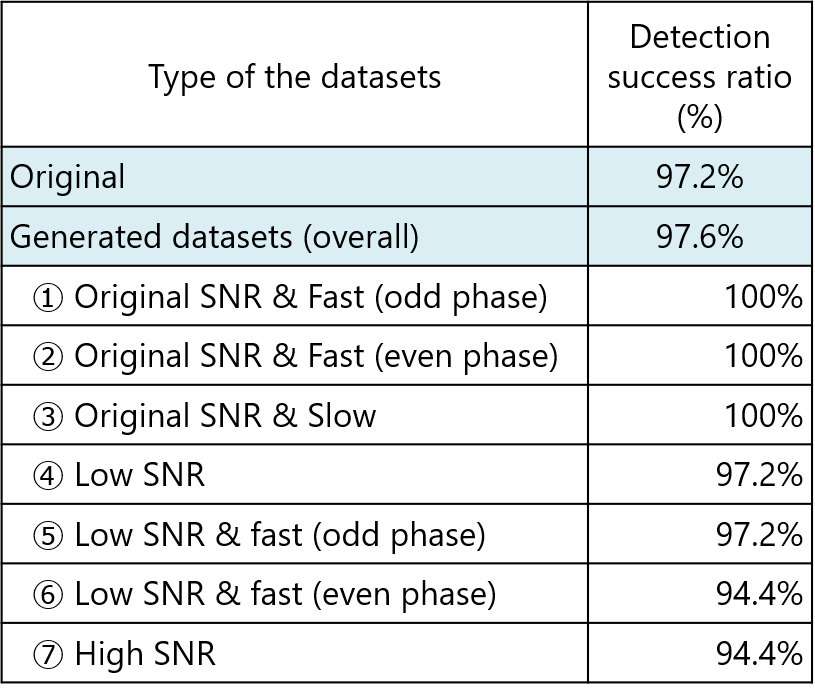
Figure 3: The results for each dataset.
The detection success rate was 97.2% for the 18 original datasets, and 97.6%
for the overall 126 generated datasets.
DOI: https://doi.org/10.58530/2023/3123