3119
Tract-specific myelin mapping using magnetization transfer-prepared diffusion imaging: comparison with conventional MTR tractometry1Department of Biological and Biomedical Engineering, McGill University, Montreal, QC, Canada, 2McConnell Brain Imaging Centre, Montreal Neurological Institute and Hospital, Montreal, QC, Canada, 3Department of Neurology and Neurosurgery, McGill University, Montreal, QC, Canada, 4Department of Computer Science, University of Verona, Verona, Italy, 5Department of Neuroscience, Rehabilitation, Ophthalmology, Genetics, Maternal and Child Health (DINOGMI), University of Genoa, Genova, Italy
Synopsis
Keywords: Data Analysis, Tractography & Fibre Modelling, Magnetization Transfer, Diffusion-Weighted Imaging, Tractometry
Tractometry is a technique used to investigate the microstructure variations along white matter tracts or to reconstruct microstructure-weighted connectivity matrices. However, partial volume effects from crossing fibers bias the individual fiber measurements and conceal subtle differences. Here, we compare MTR tractometry to a novel approach using dual-encoded MT-weighted DWI analyzed using COMMIT to disentangle the MTR signal of individual white matter fibers. The results show a broader distribution in edge MTR values for the dual-encoding approach in comparison to tractometry. Both techniques show similar spatial MTR patterns, however the dual-encoded MT-weighted DWI approach shows a higher pattern of inter-individual variability.Introduction
MRI contrasts can offer complementary information about the brain’s macro- and micro-structure. For instance, diffusion-weighted imaging (DWI) is sensitive to the orientation of white matter fiber bundles, and magnetization transfer (MT) is used as an index of the myelin content of brain tissue. By combining these different modalities, the myelination of white matter tracts can be estimated using an analysis pipeline known as tractometry 1, where quantitative MR maps are projected onto reconstructed streamlines to investigate microstructure properties along a tract or between tracts. Tractometry is widely used 2,3, yet there are significant limitations associated with this technique. 60-90% of image voxels in the white matter contain multi-fiber configurations 4, leading to partial volume effects that bias the measurements of each fiber and conceal subtle fiber differences. Here, we compare MTR tractometry to a novel approach that uses a dual-encoded MT-weighted DWI dataset 5 in combination with whole brain convex optimization modeling for microstructure informed tractography (COMMIT) 6 to disentangle the MTR signal of the individual white matter fiber bundles, effectively obtaining tract-specific MTR values.Methods
10 healthy subjects (6 males and 4 females, 29.2± 6.29 years old) were scanned and rescanned (< 3 weeks inter-scan interval) on a 3 Tesla Siemens PrismaFit scanner. Each session included: 1 mm T1-weighted MPRAGE image, 2.6 mm DWI for a total of 108 directions at b=0,300,1000,2000 s/mm2, and 2.6 mm MT-weighted DWI with 30 directions at b=0,1500 s/mm2, once without and once with an MT preparation (offset frequency=3 kHz; dual irradiation; TRMT=90 ms; number of pulses=7; pulse duration=1 ms) 5. The T1-weighted images and the DWI were preprocessed using micapipe 7. Two MTR maps were calculated from the MT-off and MT-on diffusion-weighted images for b=0 and b=1500 s/mm2, respectively.MTR tractometry was computed using the streamlines reconstructed from the multi-shell DWI data and filtered by "standard" COMMIT 8. Tractometry connectivity matrices (CM) were computed using the Schaefer-400 parcellation 9. The median MTR value was computed along each streamline and the mean across streamlines that connected two nodes in the network. Tract-specific MTR CMs were computed as in Bontempi et al. 6 using COMMIT with the unfiltered streamlines and the novel dual-encoded MT-weighted DWI as inputs. The MT-on and MT-off CMs were filtered using COMMIT weights 6 before calculating the tract-specific MTR CM. A 50% consensus filter was applied to create group average CMs to minimized false positives.
Results and Discussion
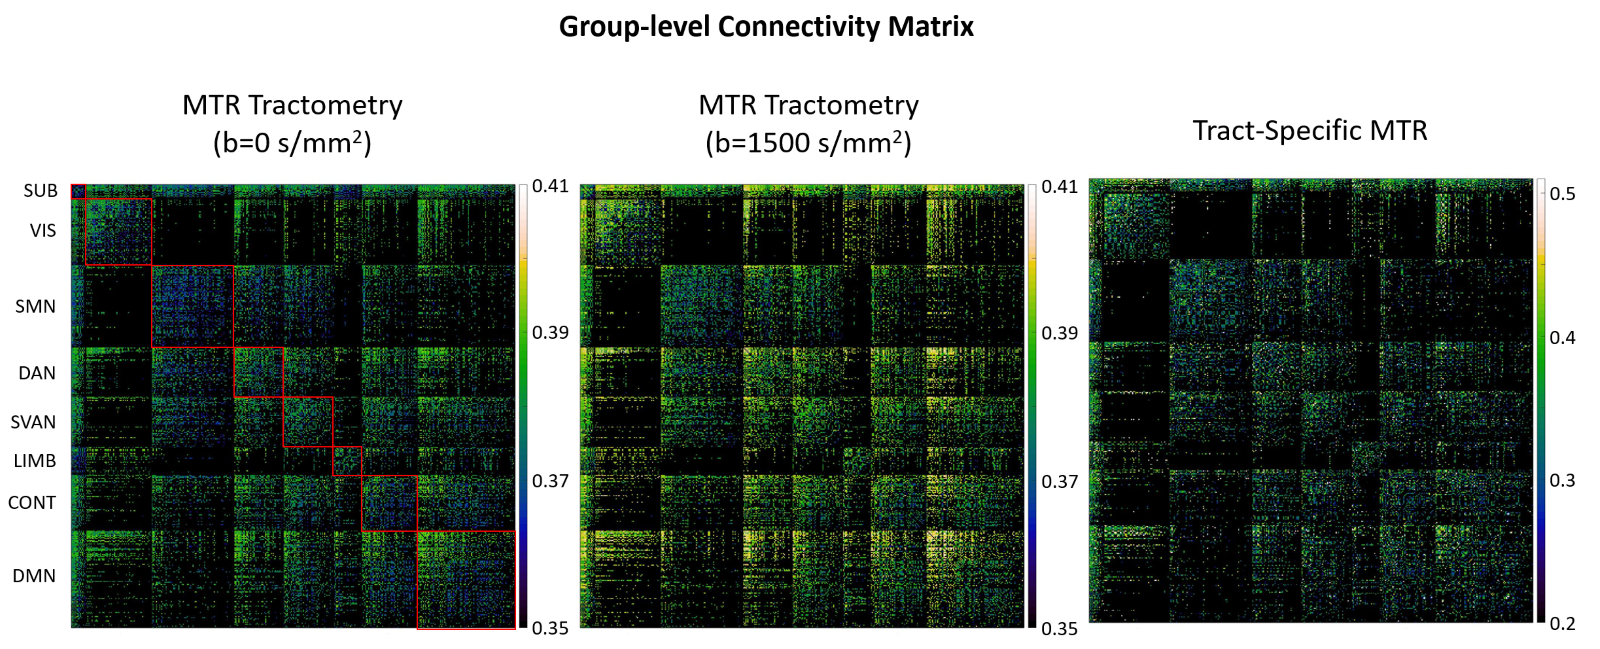
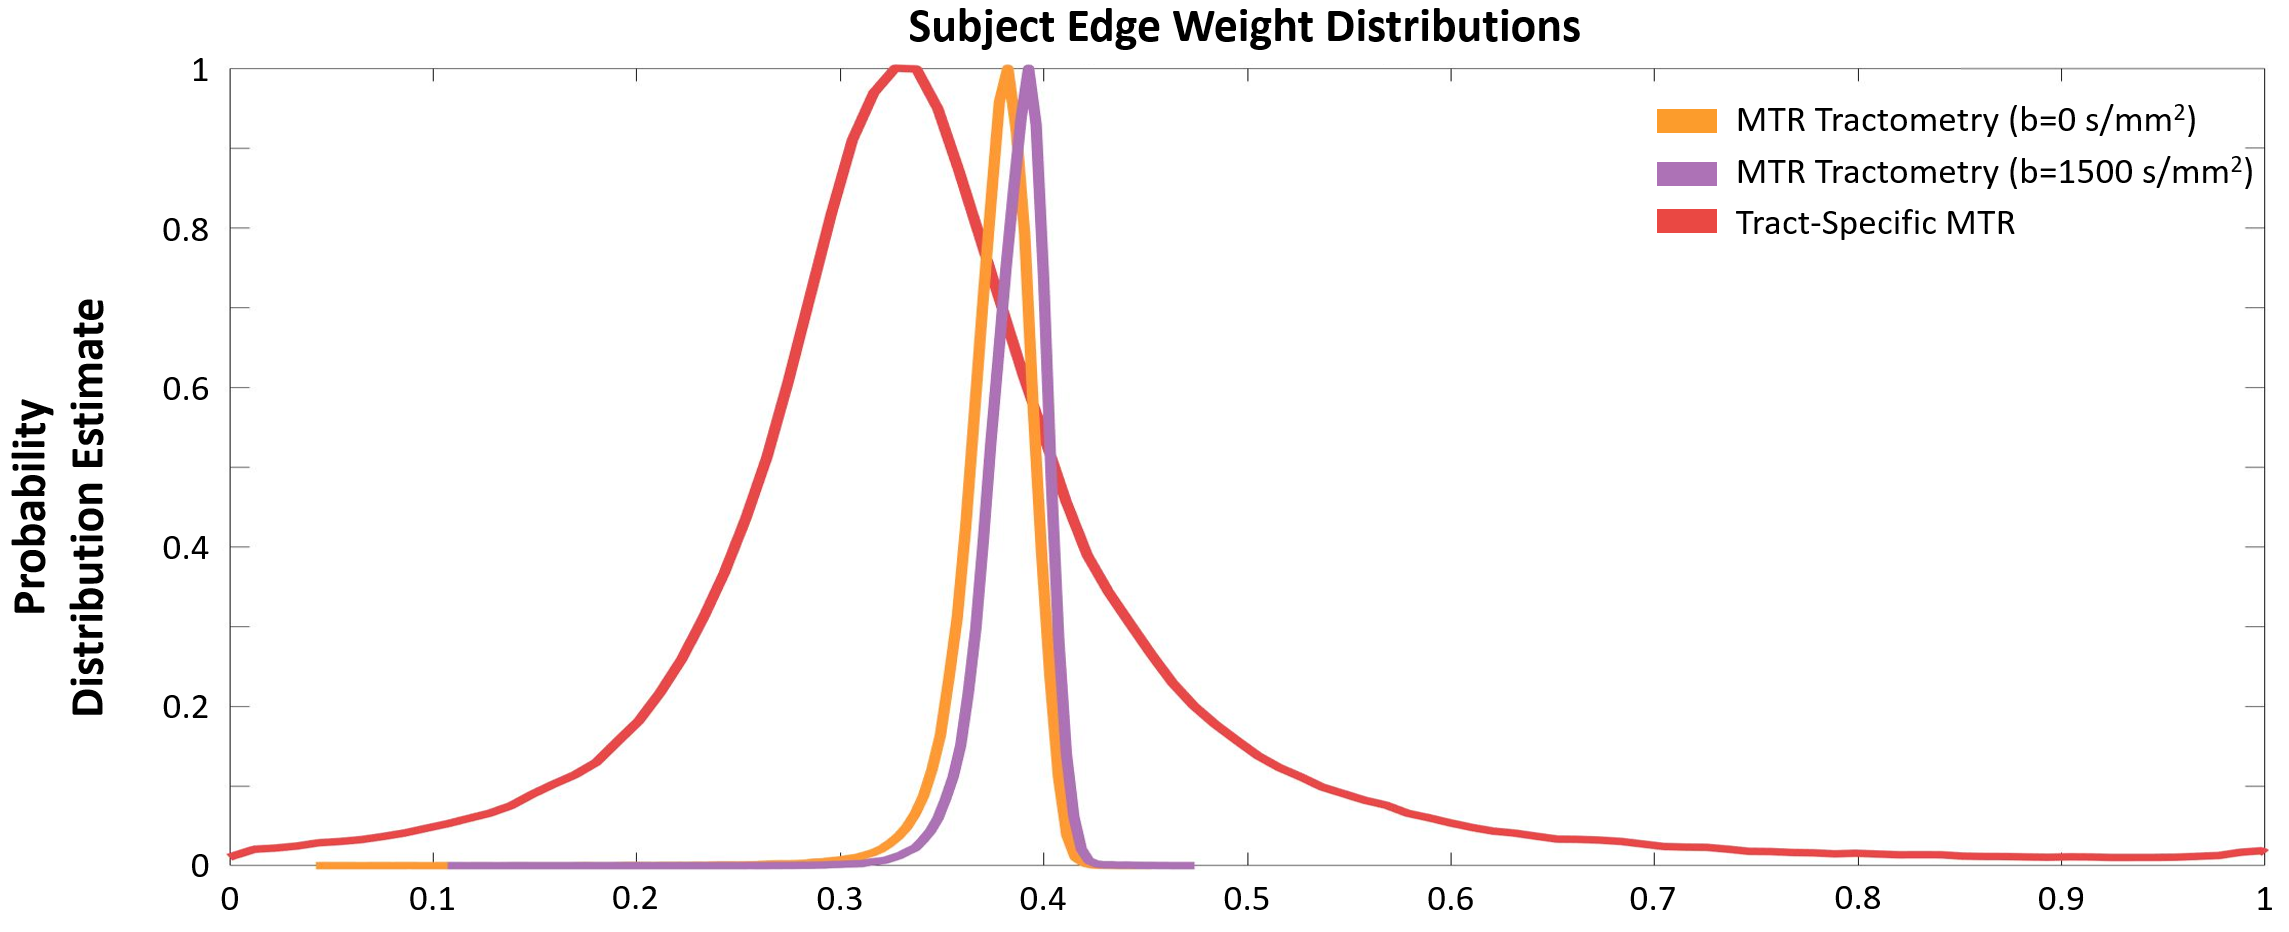
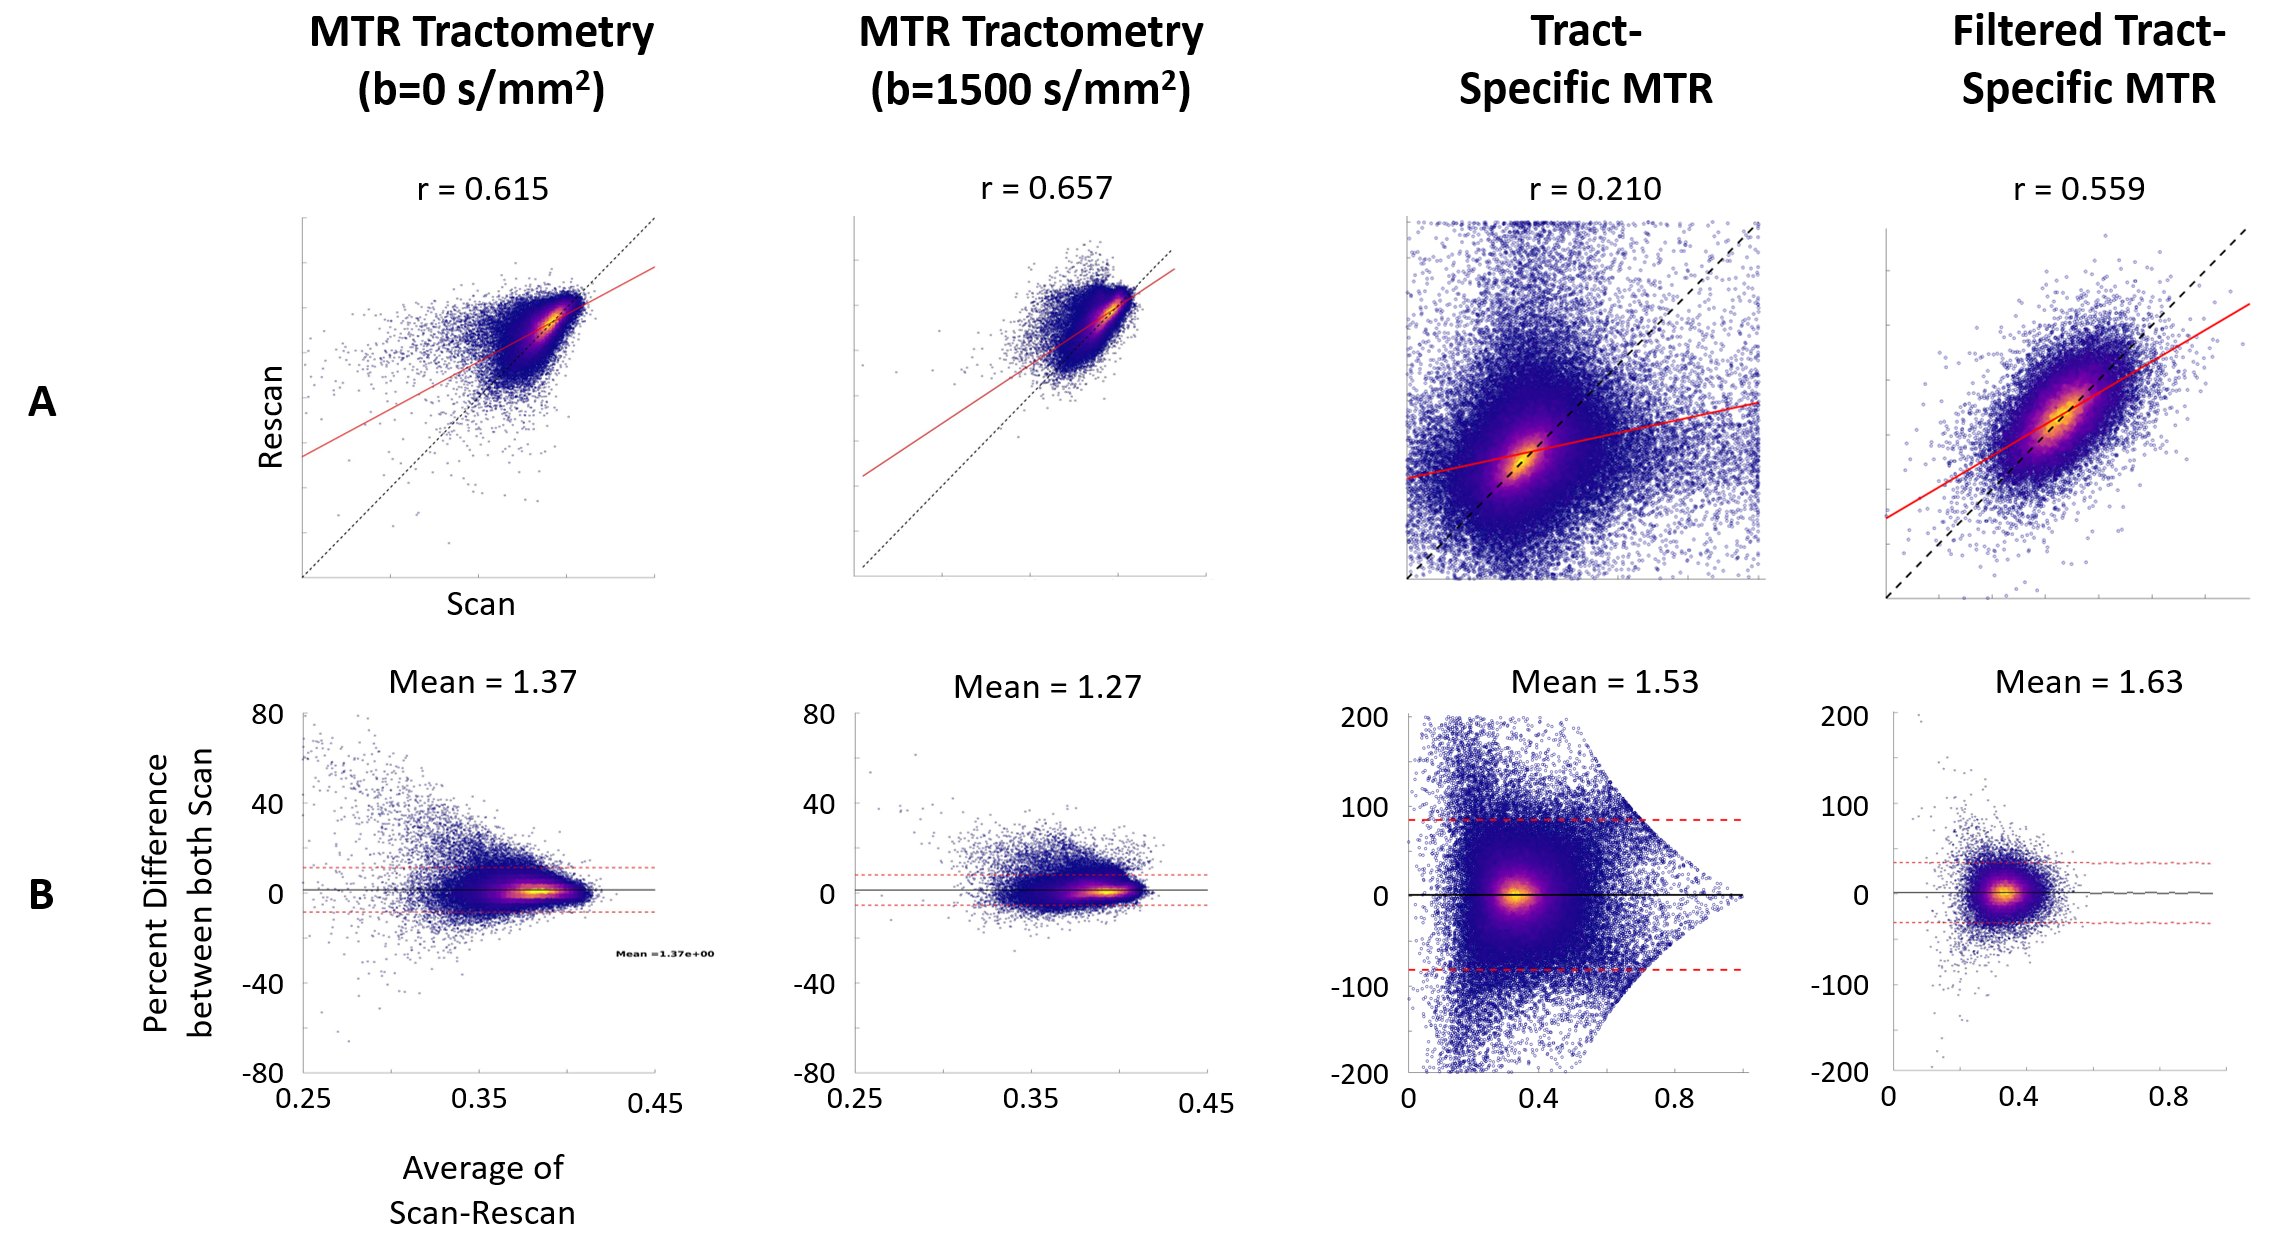
The three group-level CMs created using b=0 s/mm2 MTR tractometry, b=1500 s/mm2 MTR tractometry, and tract-specific MTR are shown in Figure 1. The probability distribution of the edge weights is plotted in Figure 2. MTR tractometry show higher values at b=1500 s/mm2 than at b=0 s/mm2 due to the removal of the free water signal. Additionally, both tractometry CMs are characterized by a lower edge weight dynamic range when compared to the dual-encoded MT-weighted DWI dataset due to the partial volume effects creating a smoothing effect.Subject-level scan-rescan repeatability of network edge values was quantified using a correlation plot and a Bland-Altman plot (Figure 3). In the case of tractometry, the coefficients of correlation are 0.615 (b=0 s/mm2) and 0.657 (b=1500 s/mm2) and the Bland-Altman plot shows good agreements between scan-rescan (low mean and 95% limits of agreements). For the dual-encoding sequence, the repeatability between scan-rescan is lower in both the correlation plot and Bland-Altman plot. This issue was improved by filtering out edges that had less than 10 streamlines: the coefficient of correlation increased from 0.210 to 0.559, and the 95% limits of agreements became narrower. The filtered results demonstrate good repeatability between scan-rescan, indicating that edges containing a low number of streamlines are potentially responsible for noise or false positives in the CM, making it crucial to them filter out.
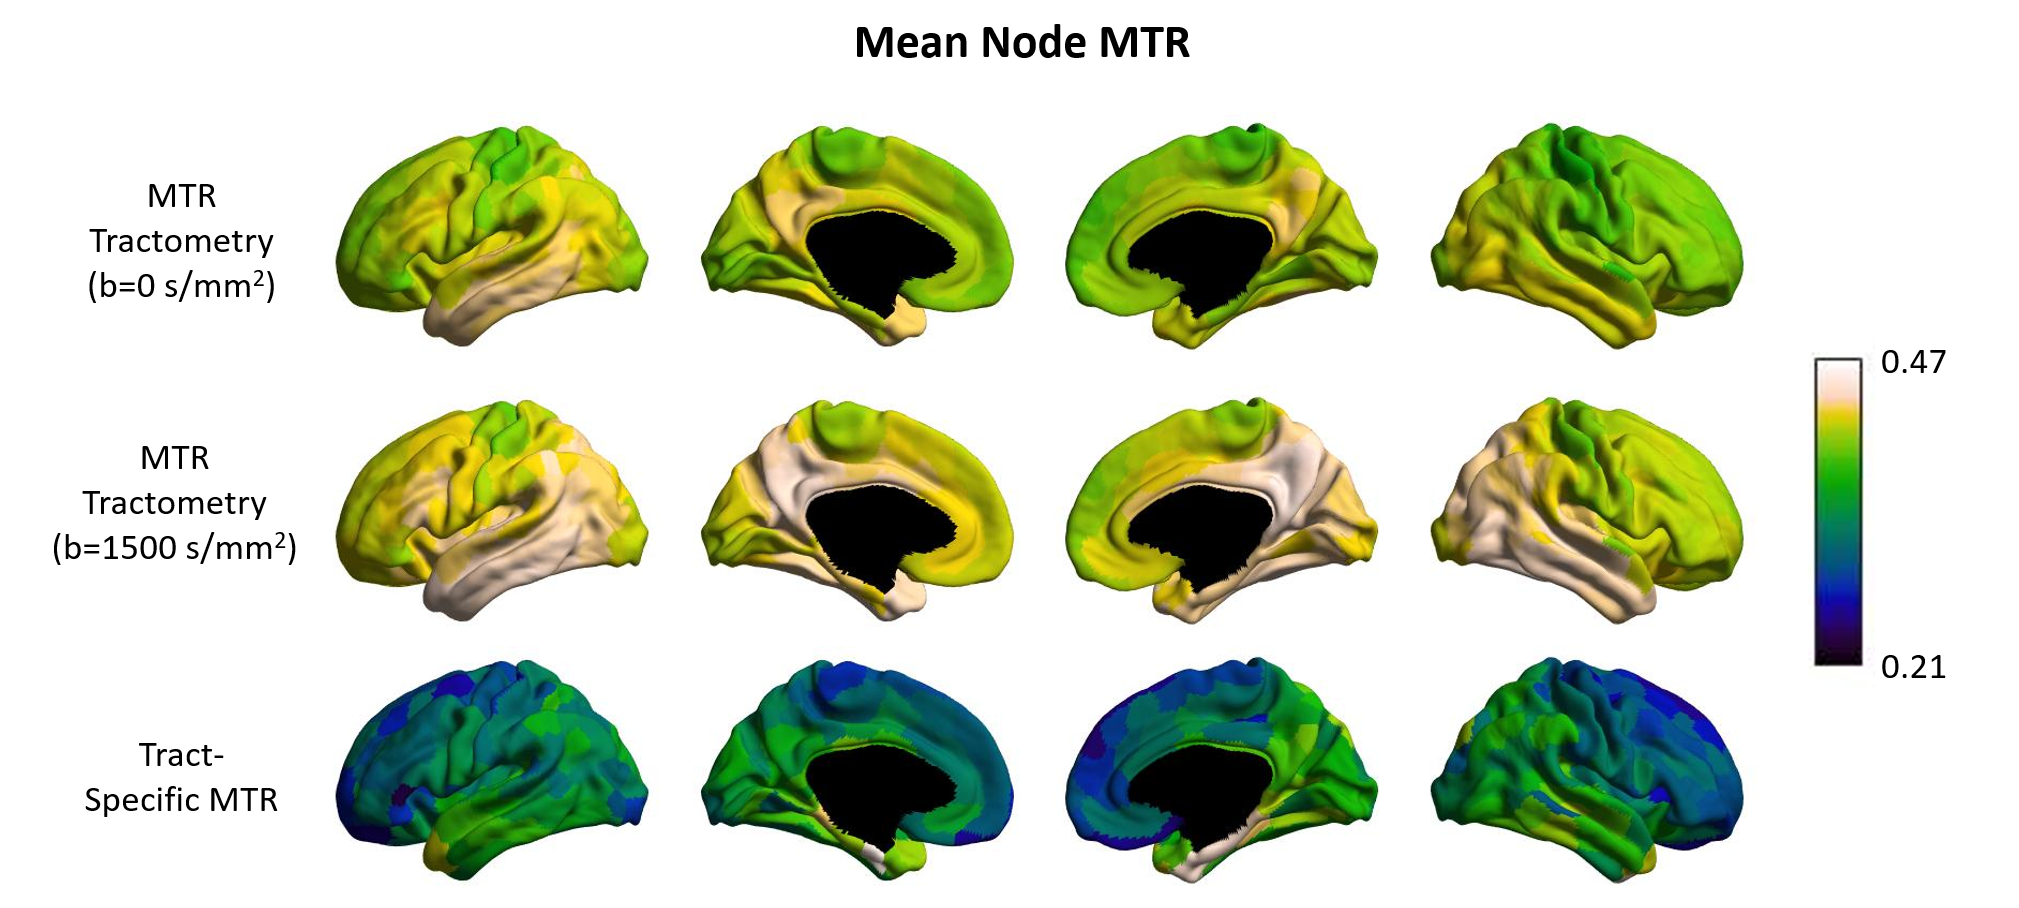
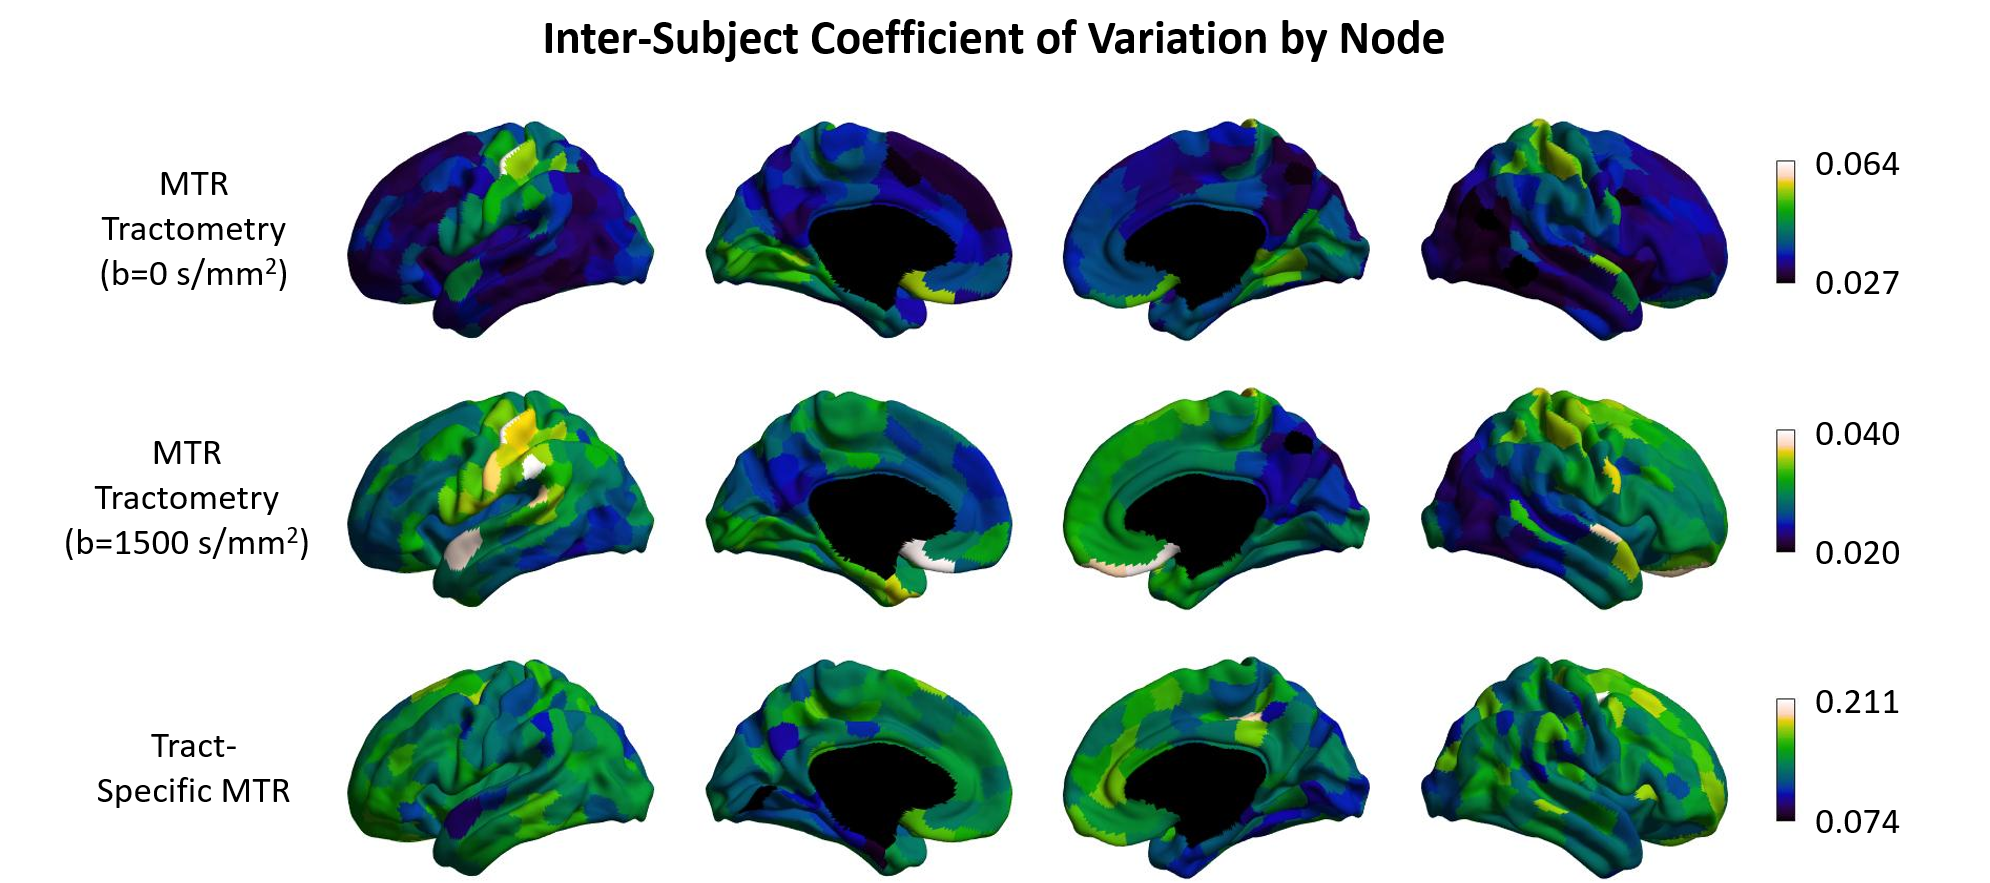
The mean MTR of non-zero edges was calculated for each node and is displayed on the cortical surface in Figure 4, representing the average myelin density of tracts connecting to each node. The cortical surface maps show similar trends in tractometry and tract-specific MTR. However, the tractometry cortical surface is more uniform due to partial volume effects when compared to the dual-encoding sequence cortical surface. Lastly, the edge coefficient of variation across subjects is plotted onto the cortical surfaces in Figure 5. MTR tractometry indicates a slightly higher variance in the pre-central and post-central gyri and lower variance in the regions of the default mode network. In contrast, the dual-encoding sequence presents higher and more uniform inter-subject variability across the whole brain, with higher values in the frontal lobe.
Conclusion
We used a dual-encoding MT-weighted DWI dataset to extract tract-specific MTR measures and create an MTR connectome. The results show a broader distribution in edge weights when compared to conventional MTR tractometry, however the repeatability of the tract-specific MTR connectome was lower across the brain. The general trends between the MTR tractometry and the tract-specific MTR are similar, but the latter is more specific at the node level. Finally, the dual-encoded MT-weighted DWI data shows higher inter-subject variability when compared to tractometry data.Acknowledgements
This work was supported by: the Quebec Bio-Imaging Network, the Transforming Autism Care Consortium, the Brain Canada Foundation, Healthy Brains for Healthy Lives, and Fonds de Recherche du Québec - Santé.
The authors would like to thank Dr. Jennifer S.W. Campbell for helpful discussions about the project.
References
1. Bells S, Cercignani M, Deoni S, Assaf Y, Pasternak O, Evans C, et al., editors. Tractometry–comprehensive multi-modal quantitative assessment of white matter along specific tracts. Proc ISMRM; 2011.
2. Messaritaki E, Foley S, Schiavi S, Magazzini L, Routley B, Jones DK, et al. Predicting MEG resting-state functional connectivity from microstructural information. Network Neuroscience. 2021;5(2):477-504.
3. Boshkovski T, Kocarev L, Cohen-Adad J, Mišić B, Lehéricy S, Stikov N, et al. The R1-weighted connectome: complementing brain networks with a myelin-sensitive measure. Network Neuroscience. 2021;5(2):358-72.
4. Jeurissen B, Leemans A, Tournier JD, Jones DK, Sijbers J. Investigating the prevalence of complex fiber configurations in white matter tissue with diffusion magnetic resonance imaging. Hum Brain Mapp. 2013;34(11):2747-66.
5. Leppert IR, Rowley CD, Campbell JS, Nelson M, Pike BG, Tardif CL, editors. Dual-encoding of magnetization transfer and diffusion for the characterization of tract-specific myelination. International Society for Magnetic Resonance in Medicine; 2022; London, England.
6. Bontempi P, Leppert IR, Schiavi S, Campbell JSW, Nelson M, Pike BG, et al., editors. Feasibility of magnetization transfer measurement in distinct white matter connections. International Society for Magnetic Resonance in Medicine; 2022; London, England.
7. Cruces RR, Royer J, Herholz P, Larivière S, de Wael RV, Paquola C, et al. Micapipe: A pipeline for multimodal neuroimaging and connectome analysis. NeuroImage. 2022:119612.
8. Daducci A, Dal Palù A, Lemkaddem A, Thiran JP. COMMIT: Convex optimization modeling for microstructure informed tractography. IEEE Trans Med Imaging. 2015;34(1):246-57.
9. Schaefer A, Kong R, Gordon EM, Laumann TO, Zuo X-N, Holmes AJ, et al. Local-global parcellation of the human cerebral cortex from intrinsic functional connectivity MRI. Cerebral cortex. 2018;28(9):3095-114.
Figures