3116
Improving the accuracy of Multipool-Lorentzian fitting in CEST MRI by use of a Pseudo-Voigt lineshape for direct water saturation
Markus Huemer1, Clemens Stilianu1, and Rudolf Stollberger1,2
1Institute of Biomedical Imaging, Graz University of Technology, Graz, Austria, 2BioTechMed Graz, Graz, Austria
1Institute of Biomedical Imaging, Graz University of Technology, Graz, Austria, 2BioTechMed Graz, Graz, Austria
Synopsis
Keywords: Data Analysis, CEST & MT
In Chemical Exchange Saturation Transfer (CEST) MRI one common analysis technique is Multipool-Lorentzian fitting of the resulting Z-Spectrum. Multiple Lorentzian lineshapes are fitted to the measured data. The lineshape of the direct water saturation (DS) can deviate substantially from a Lorentzian depending on the saturation scheme and $$$B_1^+$$$. To prevent a cross-influence of the DS on the CEST and increase the fit accuracy we propose the use of a Pseudo-Voigt lineshape for the water line.Introduction
For many spectroscopic investigations, the Lorentz curve is the underlying natural line shape; however, measurement influences lead to deviations from this theoretical model1,2,3, requiring corrections with a (pseudo) Voigt lineshape for real data analysis1. This adaption was introduced for CEST spectra in the context of a Lorentzian Difference analysis4,5.In this study, the improvement of multi-pool fitting by modeling the water line with a Pseudo-Voigt lineshape is investigated. We show that this considerably reduces the influence of varying $$$B_1^+$$$ amplitudes and direct water saturation (DS) on the fitted pools.
Theory
In conventional Multipool-Lorentzian fitting each pool is described as the lineshape$$L_i(\omega) = a_i \frac{{(\Gamma_i/2)}^2}{{(\Gamma_i/2)}^2 + (\omega - \omega_{0i})}$$where $$$\omega$$$ describes its offset frequency, $$$a_i$$$ its amplitude, $$$\Gamma_i$$$ its width and $$$\omega_{0i}$$$ its shift. The sum of all pools is subtracted from the equilibrium magnetization$$S_{\textrm{fit-L}}(\omega) = M_0 - \sum_{i=0}^N L_i(\omega) $$for fitting of the Z-spectrum6.In the proposed method the DS is described by a Pseudo-Voigt lineshape $$$V_0$$$, which can be expressed as the linear combination of a Gaussian $$$G_0$$$ and a Lorentzian $$$L_0$$$.$$V_0(\omega) = \alpha_0 L_0(\omega) + (1-\alpha_0)G_0(\omega)$$$$G_i(\omega) = \frac{1}{\sqrt{2\pi}\sigma_i}e^{\frac{-{(\omega-\omega_{0i})}^2}{2\sigma_i^2}}$$Here, $$$\alpha$$$ is the proportionality constant between the Lorentzian and the Gaussian lineshapes and $$$\sigma_0$$$ describes the width of $$$G_0$$$. The remaining pools are described by Lorentzians, which results in the following equation for the estimated spectrum $$$S_{\textrm{fit-PV}}$$$ $$S_{\textrm{fit-PV}}(\omega) = M_0 - V_0(\omega) -\sum_{i=1}^N L_i(\omega)$$
Methods
Z-Spectra were simulated for a three pool model with two CEST pools ($$$T_{1w}=0.8s$$$, $$$T_{2w}=0.11s$$$, $$$f_{s_1}=2.5\cdot10^{-3}$$$, $$$T_{1s_1}=1s$$$, $$$T_{2s_1}=0.16s$$$, $$$k_{s_1}=200 Hz$$$, $$$dw_{s_1}=2ppm$$$, $$$f_{s_2}=1.25\cdot10^{-3}$$$, $$$T_{1s_2}=1s$$$, $$$T_{2s_2}=0.16s$$$, $$$k_{s_2}=200 Hz$$$, $$$dw_{s_2}=3.5ppm$$$). The influence of the CEST pools on the spectra was calculated by simulating with and without the CEST pools enabled and subtracting the results. In total six saturation schemes were compared: A continuous wave saturation pulse with a pulse length of 1s and $$$B_{1rms}^+ = 0.5\mu T, 1 \mu T, 2\mu T$$$ and a pulse-train compromised of 9 Gaussian pulses with length $$$T_p = 100$$$ms, $$$12.5$$$ms pause between pulses with the same $$$B_{1rms}^+$$$ values.The simulations were performed using pulseq-cest in MATLAB (2021a, MathWorks, Natick, MA)7.
A three pool phantom containing water, Creatine (100mM), Nicotinamid (100mM) and $$$Mn_2Cl$$$, to shorten the relaxation times ($$$T_1=1000ms$$$ and $$$T_2 = 110ms$$$) was constructed. Six measurements of the phantom were performed on a MAGNETON Vida 3T scanner (Siemens Healthcare GmbH, Erlangen, Germany) using an in-house sequence build using pulseq-cest7.The above-mentioned Gaussian-pulse-train and a block-pulse-train with the same time parameters and $$$B_{1rms}^+$$$ levels were used for pre-saturation. The readout was performed using a centric 2D-GRE with parameters: base resolution = $$$64\times64$$$, FOV = $$$160\times160$$$ $$$mm^2$$$, slice thickness 5$$$mm$$$, $$$\alpha=10^{\circ}$$$, $$$T_R=12ms$$$ and $$$T_E=4ms$$$.
Parameter fitting was performed for the equations $$$S_{\textrm{fit-L}}$$$ and $$$S_{\textrm{fit-PV}}$$$ for simulated and measured data using the MATLAB function lsqcurvefit.
Results and Discussion
Figure 1 shows the influence the different saturations schemes have over the DS line shape. Especially for higher $$$B_1^+$$$ levels the saturation scheme influences the shape of the DS.In Figure 2 the resulting fits for the reference Lorentzian-model and the PV-model are compared on simulated spectra. The proposed PV model shows improved GOF for all saturation schemes. Especially for the narrower DS lineshape of the Gaussian saturation the proposed PV fit leads to an increase in GOF.Figure 3 compares the influence of the CEST pools on the Z-spectrum with the fit results for the CEST lineshapes for reference and PV model. The latter shows more accurate modeling of the resulting lineshape. Especially for higher $$$B_1^+$$$ levels, the reference model can not accurately describe the DS and CEST lineshapes independently. This leads to the disagreement between the calculated influence and the prediction by the model. The Pseudo-Voigt approach does not show the same problems. To quantify the ability of the model to correctly fit the CEST effect, the relative difference in amplitude at 1.9ppm and 3.5ppm for the CEST lineshapes to the simulated influence is denoted in the legend. This is also shown more detailed in Figure 4. For the reference fit the mean relative deviation of the amplitudes is $$$17.2\%$$$ (min/max $$$2.0 \%$$$/$$$66.3\%$$$). For the proposed PV fit the value drops to $$$5.8\%$$$ (min/max $$$0.4\%$$$/$$$15.8\%$$$), which equates to a threefold decrease in mean relative error and a four times lower maximum relative error for the tested scenarios. Furthermore, the Mean-Squared-Error (MSE) between the fitted CEST lineshapes and the simulated influence of the CEST pools in the range of 1.5ppm to 4ppm is added Figure 4 for the PV method and the reference fit. The PV method shows lower deviations for all six curves.
Figure 5 compares the model on measured data and the results are in good agreement with the simulated Z-Spectra. The PV-model again results in higher GOF for all tested cases.
Conclusion
We showed that the proposed Pseudo-Voigt model outperforms the state-of-the-art Multipool-Lorentzian model in simulated and measured data. The Pseudo-Voigt model significantly decreases the influence of the direct water saturation on the fitted CEST lineshapes.Acknowledgements
This research was funded in whole, or in part, by the Austrian Science Fund FWF-I4870.References
1 I. Marshall et al., “Use of voigt lineshape for quantification of in vivo 1H spectra”, Magn. Reson. Med., vol. 37, no. 5, pp. 651–657, May 1997, doi: 10.1002/MRM.1910370504.2 B. Schmitt et al., “Optimization of pulse train presaturation for CEST imaging in clinical scanners”, Magn. Reson. Med., vol. 65, no. 6, pp. 1620–1629, 2011, doi: 10.1002/MRM.22750.
3 E. S. Yoshimaru et al., “Design and optimization of pulsed Chemical Exchange Saturation Transfer MRI using a multiobjective genetic algorithm”, J. Magn. Reson., vol. 263, pp. 184–192, Feb. 2016, doi: 10.1016/J.JMR.2015.11.006.
4 L. Zhang et al., “Voxel-wise optimization of pseudo voigt profile (VOPVP) for Z-spectra fitting in chemical exchange saturation transfer (CEST) MRI”, Quant. Imaging Med. Surg., vol. 9, no. 10, pp. 1714–1730, 2019, doi: 10.21037/qims.2019.10.01.
5 L. Zhang et al., “Enhanced CEST MRI Using the Residual of Inversed Z-Spectra for Ischemia Detection”, IEEE Access, vol. 8, pp. 147323–147336, 2020, doi: 10.1109/ACCESS.2020.3014339.
6 M. Zaiß et al., “Quantitative separation of CEST effect from magnetization transfer and spillover effects by Lorentzian-line-fit analysis of z-spectra", J. Magn. Reson., vol. 211, no. 2, pp. 149–155, Aug. 2011, doi: 10.1016/j.jmr.2011.05.001.
7 K. Herz et al., “Pulseq‐CEST: Towards multi‐site multi‐vendor compatibility and reproducibility of CEST experiments using an open‐source sequence standard”, Magn. Reson. Med., vol. 86, no. 4, pp. 1845–1858, Oct. 2021, doi: 10.1002/mrm.28825.
Figures
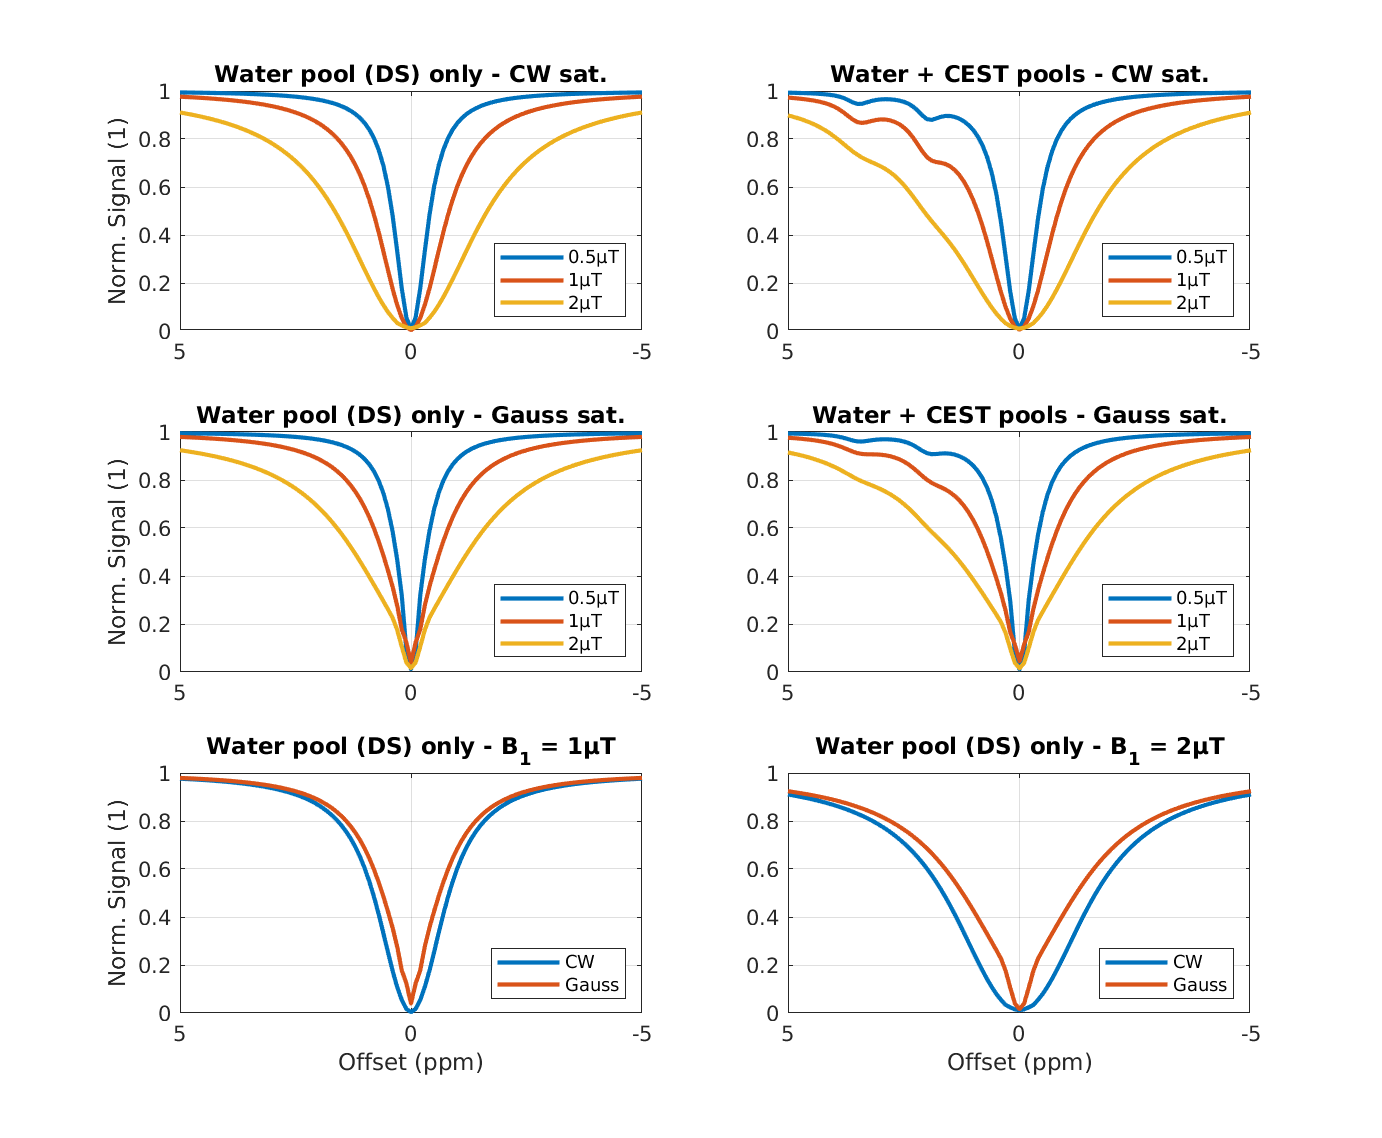
Comparison of the resulting Z-Spectra for different saturation pulses and different $$$B_1^+$$$ levels. The last rows highlights the differences in the DS lineshape for different saturation pulses.

Fit results for CW and Gaussian pulses over $B_1^+$ levels for simulated Z-spectra. The GOF is given for all spectra and the Pseudo-Voigt fit shows higher agreement in all cases.

Simulated influence of the CEST pools compared to the fit result for the CEST lineshapes of the reference and PV models. The legend shows the difference in amplitudes for both CEST lineshapes against the simulated ground truth. The Mean Squared Error (MSE) between the ground truth and the fitted lineshapes between 1.5ppm and 4ppm is noted in the title for Ref/PV. The proposed PV-model shows closer agreement for all tested cases.

Overview of the predicted CEST lineshapes amplitudes and locations by the reference model and the PV model. The amplitudes are compared to the simulated influence and the relative error is given. The PV model leads to lower error on average and lower worst case behavior.

Fit results for BPT and Gaussian pulses over $B_1^+$ levels for measured Z-Spectra. The GOF is given for all spectra and the Pseudo-Voigt fit shows higher agreement in all cases.
DOI: https://doi.org/10.58530/2023/3116