3107
Does CS-SENSE acceleration influence the performance of an AI based synthetic CT algorithm? A volunteer study in the lumbar spine.
Yulia Shcherbakova1, Tijl A van der Velden1,2, and Peter R Seevinck1,2
1Imaging Division, UMC Utrecht, Utrecht, Netherlands, 2MRIguidance B.V., Utrecht, Netherlands
1Imaging Division, UMC Utrecht, Utrecht, Netherlands, 2MRIguidance B.V., Utrecht, Netherlands
Synopsis
Keywords: Image Reconstruction, Skeletal, AI, acceleration, CS-SENSE, spine, sCT, bone
In this work, we investigated the performance of an AI based algorithm - synthetic CT generation - when subjected to compressed sensing-sensitivity encoding (CS-SENSE) accelerated gradient echo images. We performed MR experiments in five volunteers, using different CS-SENSE acceleration factors for the MR acquisitions. Our results showed that using CS-SENSE factors of 1.45 and 2 increased noise in the MR source images but did not compromise the sCT reconstruction on visual inspection, which was confirmed by quantitative metrics. However, CS-SENSE with a factor of 3 caused artifacts in the sCT images which may affect the safety and diagnostic performance of the product.Introduction
In recent years, an increasing number of Artificial Intelligence (AI) based image analysis algorithms for MR have been developed and clinically introduced. In parallel, novel methods for accelerated image acquisition are becoming clinically accepted, including compressed sensing. For the eye, images using different acceleration techniques may look similar, however, the choice of acceleration method can result in differences on a detailed level. It is unclear if these virtually insignificant differences in the MR images influence the performance of AI based algorithms.One such acceleration technique is the compressed sensing-sensitivity encoding (CS-SENSE) method (1), which employs both coil sensitivities and sparsity for image acceleration. Since becoming commercially available in 2018, it becomes more and more used in daily clinical practice.
In this work, we investigate to what extent a recently CE certified and FDA cleared sCT method is affected when subjected to MR images accelerated with the CS-SENSE method. The sCT algorithm has not been trained with CS-SENSE accelerated data.
We explore the influence of a varying acceleration factor on the source images and on the sCT reconstructed images both qualitatively and quantitatively.
Methods
Five healthy volunteers were scanned using a clinical 1.5T MR scanner (Philips Healthcare, Best, NL, software release 5.7) using the built-in posterior coil. The study was approved by the local IRB. RF-spoiled multi‐echo-gradient‐echo MRI images of the lumbar spine were acquired sagittally with the following parameter settings: FOV (AP,FH,RL) 220x278x100 mm3, acquisition voxel size 1x1x2 mm3, reconstruction voxel size 0.7x0.7x1 mm3, FA 10˚, TR/TE1/TE2 = 7ms/2.1 ms/4.2 ms, phase encode direction in feet-head with oversampling in both F and H directions 90 mm, NSA 2. TE1 and TE2 were chosen almost out-of-phase (OP) and in-phase (IP) for water-fat.Four acquisitions were performed with different acceleration settings: baseline scan with SENSE 1.2 (which is the sCT product setting), and accelerated scans with CS-SENSE 1.45, CS-SENSE 2, and CS-SENSE 3. All accelerated MR data were reconstructed with different denoising level, which is a manual choice of the CS-SENSE product: No, Weak, Medium, Strong.
Synthetic CTs were generated using the CE certified product BoneMRI V1.5 (MRIguidance BV, Utrecht, The Netherlands). Prior to comparison of images, registration (3) was performed for all reconstructed sCT images to the sCT reconstructed from the baseline acquisition.
First, a visual inspection of the image quality of both the source MRI images and the sCT reconstructions was performed. Secondly, the performance of the sCT reconstruction algorithm was quantitatively evaluated using two metrics:
- Structural similarity index for measuring image quality (SSIM);
- Peak signal-to-noise ratio in dB (PSNR).
Both metrics were calculated for the entire sCT imaging volume, after applying a body mask, with the baseline scan as a reference.
Results
Figure 1 shows the comparison of the source OP and IP MR images and corresponding generated sCT images between the baseline scan and accelerated with CS-SENSE 3 scans with different denoising levels: no, weak, medium, and strong. Overall, more artifacts and noise can be observed in the CS-SENSE accelerated source MR images, as well as artifacts in the generated sCT images, especially at the level of L4-5 vertebrae where SNR was already lower. The quality of the sCT generation improves with the use of a stronger denoising level. Therefore for further analysis CS-SENSE reconstruction with Strong denoising was used.Baseline and accelerated source OP and IP MR images and sCT images with different CS-SENSE factors and with Strong denoising are shown in Figure 2. Increasing the acceleration factor clearly introduces noise in the source images, which is less pronounced in the sCT reconstructions. At CS-SENSE factors of 1.45 and 2 the quality of the sCT reconstructions seems to be minimally affected with virtually no loss of detail. CS-SENSE factor of 3 introduces more artifacts and noise in the source MR images and loss of small details in the sCT reconstructions: the vertebral edges are less sharp and less continuous compared to the baseline images, as pinpointed by the red arrows.
Figure 3 shows an overview of the generated sCT images for the five volunteers for different acceleration factors. The overall quality of the sCT reconstructions for CS-SENSE 1.45 and 2 is virtually indistinguishable from the baseline scan, however with more artifacts for CS-SENSE 3.
The scan times of all performed MRI acquisitions are shown in Table 1.
Figure 4 shows the quantitative results for the SSIM and the SNR calculated over five volunteers. PSNR values are reduced for all CS-SENSE factors with a similar amount, showing stable PSNR values for all acceleration factors, whereas the SSIM decreases with increasing CS-SENSE factor. This reflects the qualitative findings.
Discussion and Conclusions
In this study, we have demonstrated that using CS-SENSE up to an acceleration factor of 2 did not seem to compromise the performance of a deep learning based sCT algorithm, based on qualitative and quantitative assessment. At these acceleration levels, increased noise in source MR images did not translate to noise in the sCT reconstructions. Note, however, that a specific clinical question at hand will determine to what extent the acquisition can be accelerated without degrading diagnostic performance.Acknowledgements
This research was financially supported by the European Research Council (Grant no: 101020004).References
1. D. Liang et.al. Accelerating SENSE Using Compressed Sensing. MRM 62 (2009)
2. M.C. Florkow et.al. Deep learning–based MR‐to‐CT synthesis: The influence of varying gradient echo–based MR images as input channels. MRM 83 (2020)
3. R.J.A. Kuiper et.al. CT to MR registration of complex deformations in the knee joint through dual quaternion interpolation of rigid transforms. Phys Med Biol. 66 (2021)
Figures
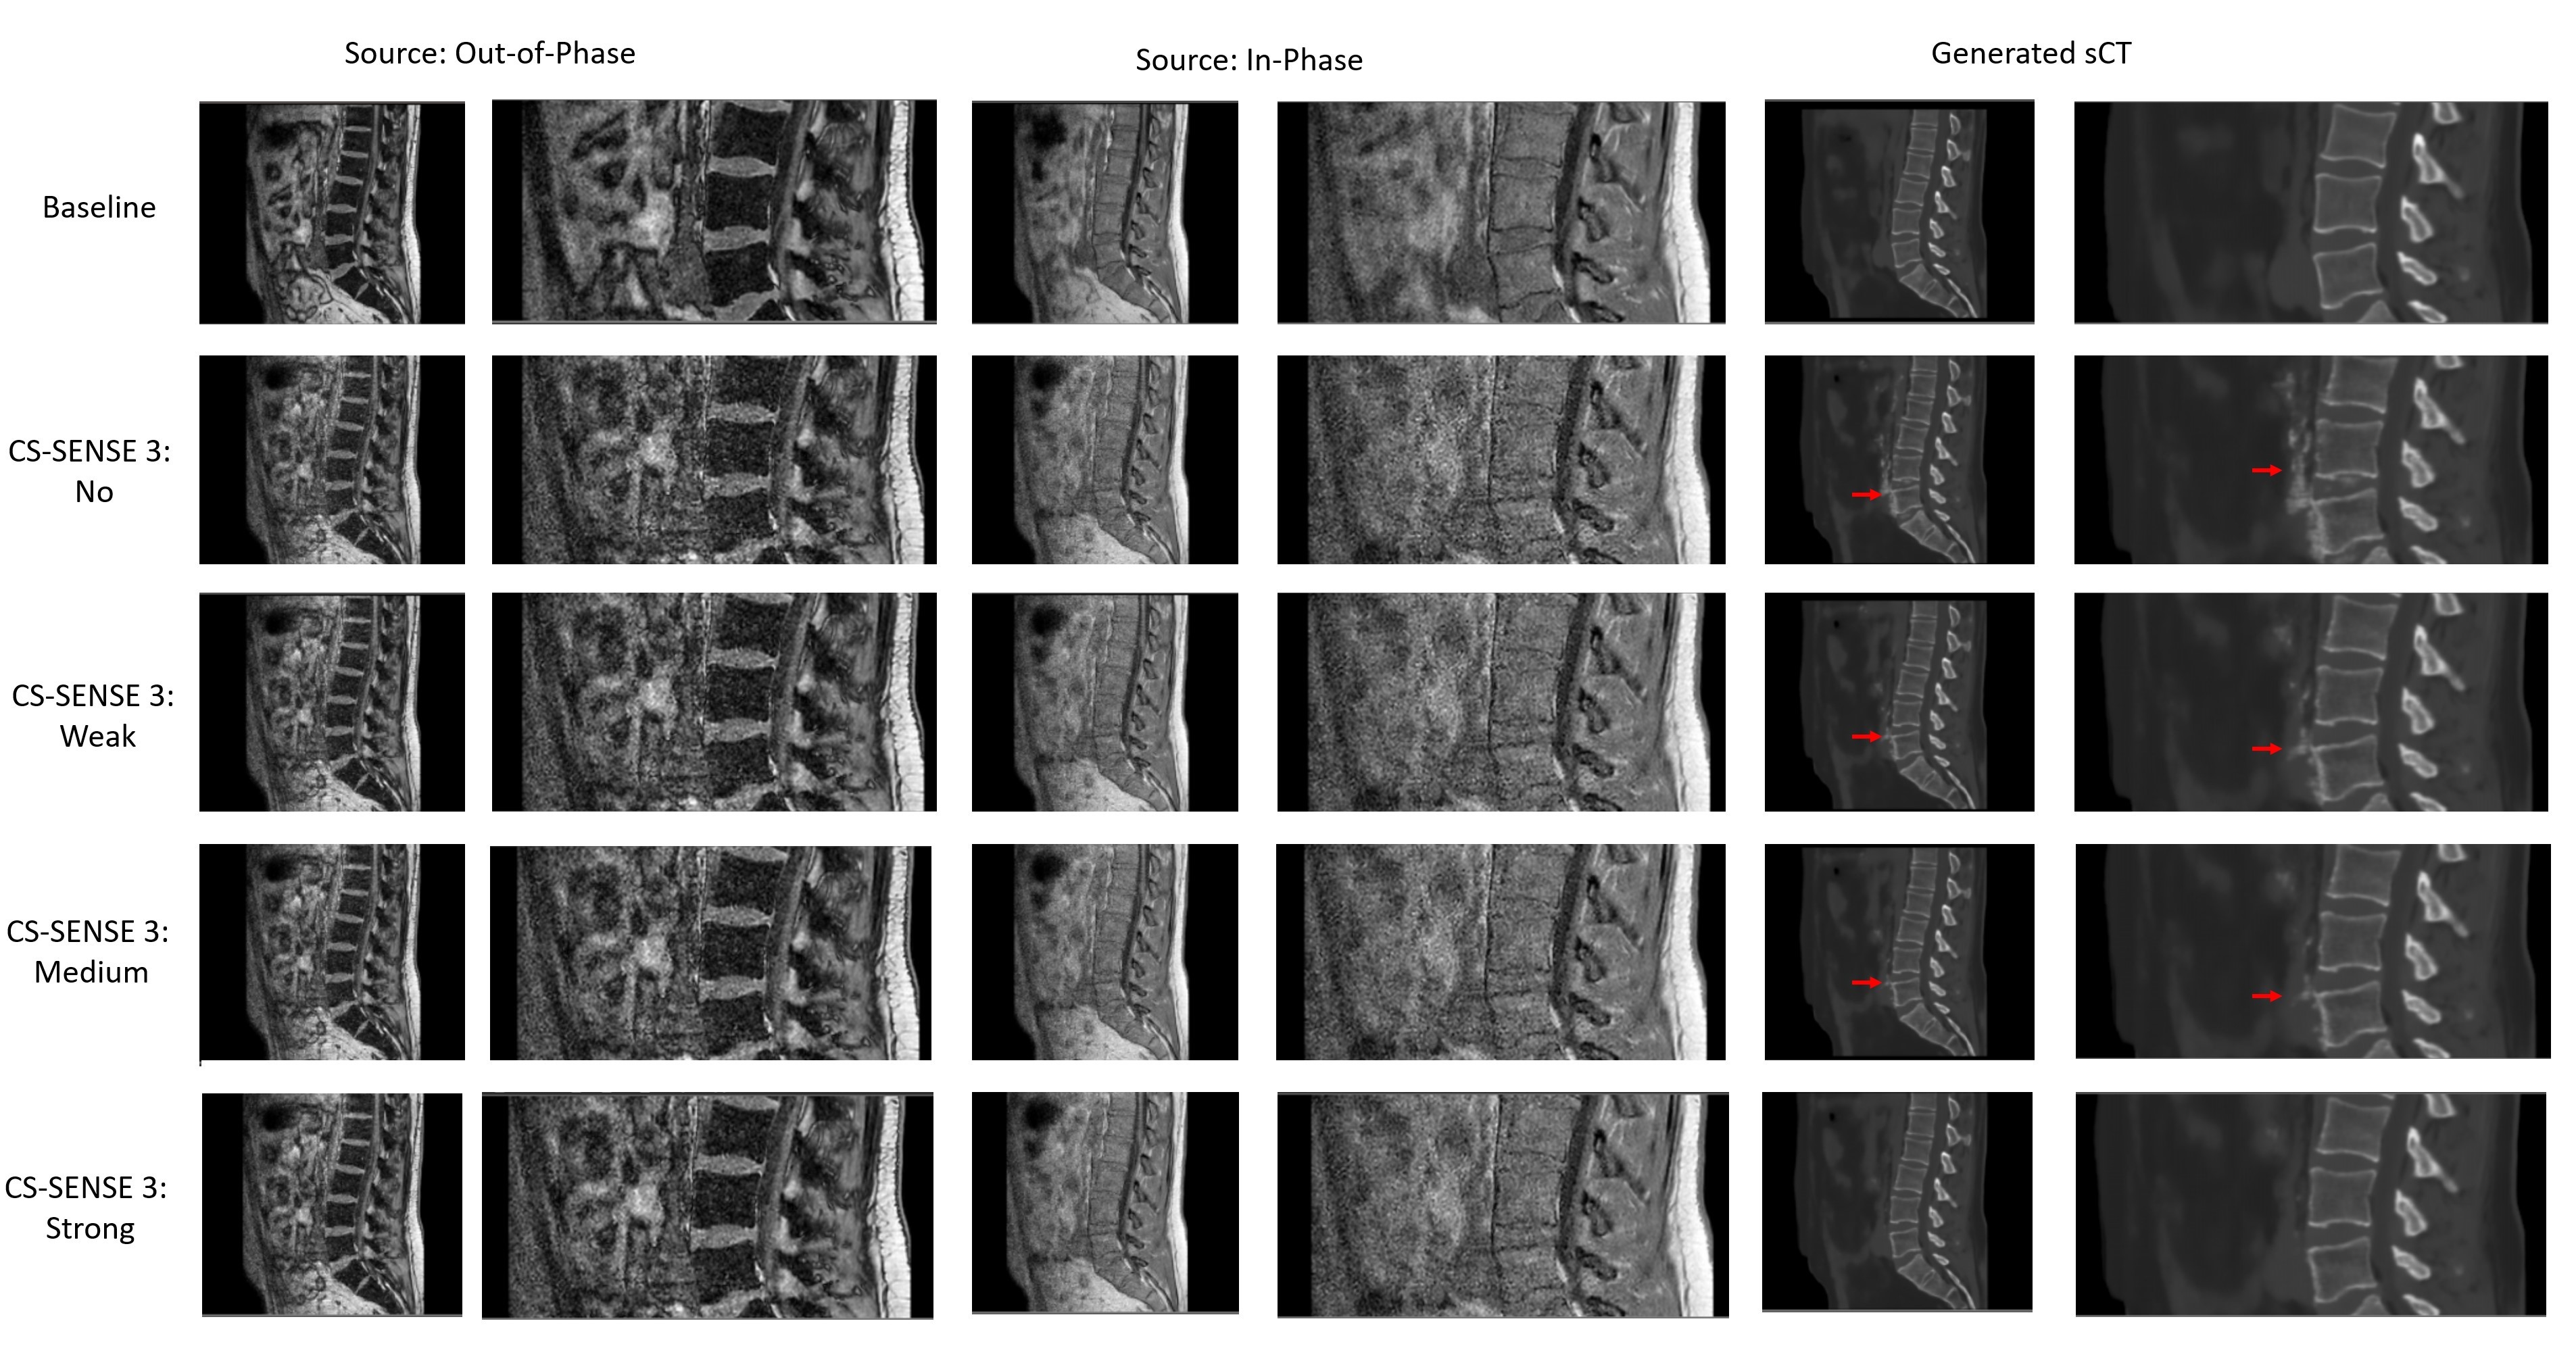
FIGURE 1. Experimental
results from the volunteer study: source OP and IP MR images with corresponding
generated sCT images (entire FOV and zoomed-in) for the baseline scan and
accelerated with CS-SENSE 3 scans with different denoising levels: no, weak,
medium, and strong. The artifacts at the level of L4-5 vertebrae are marked with
red arrows.
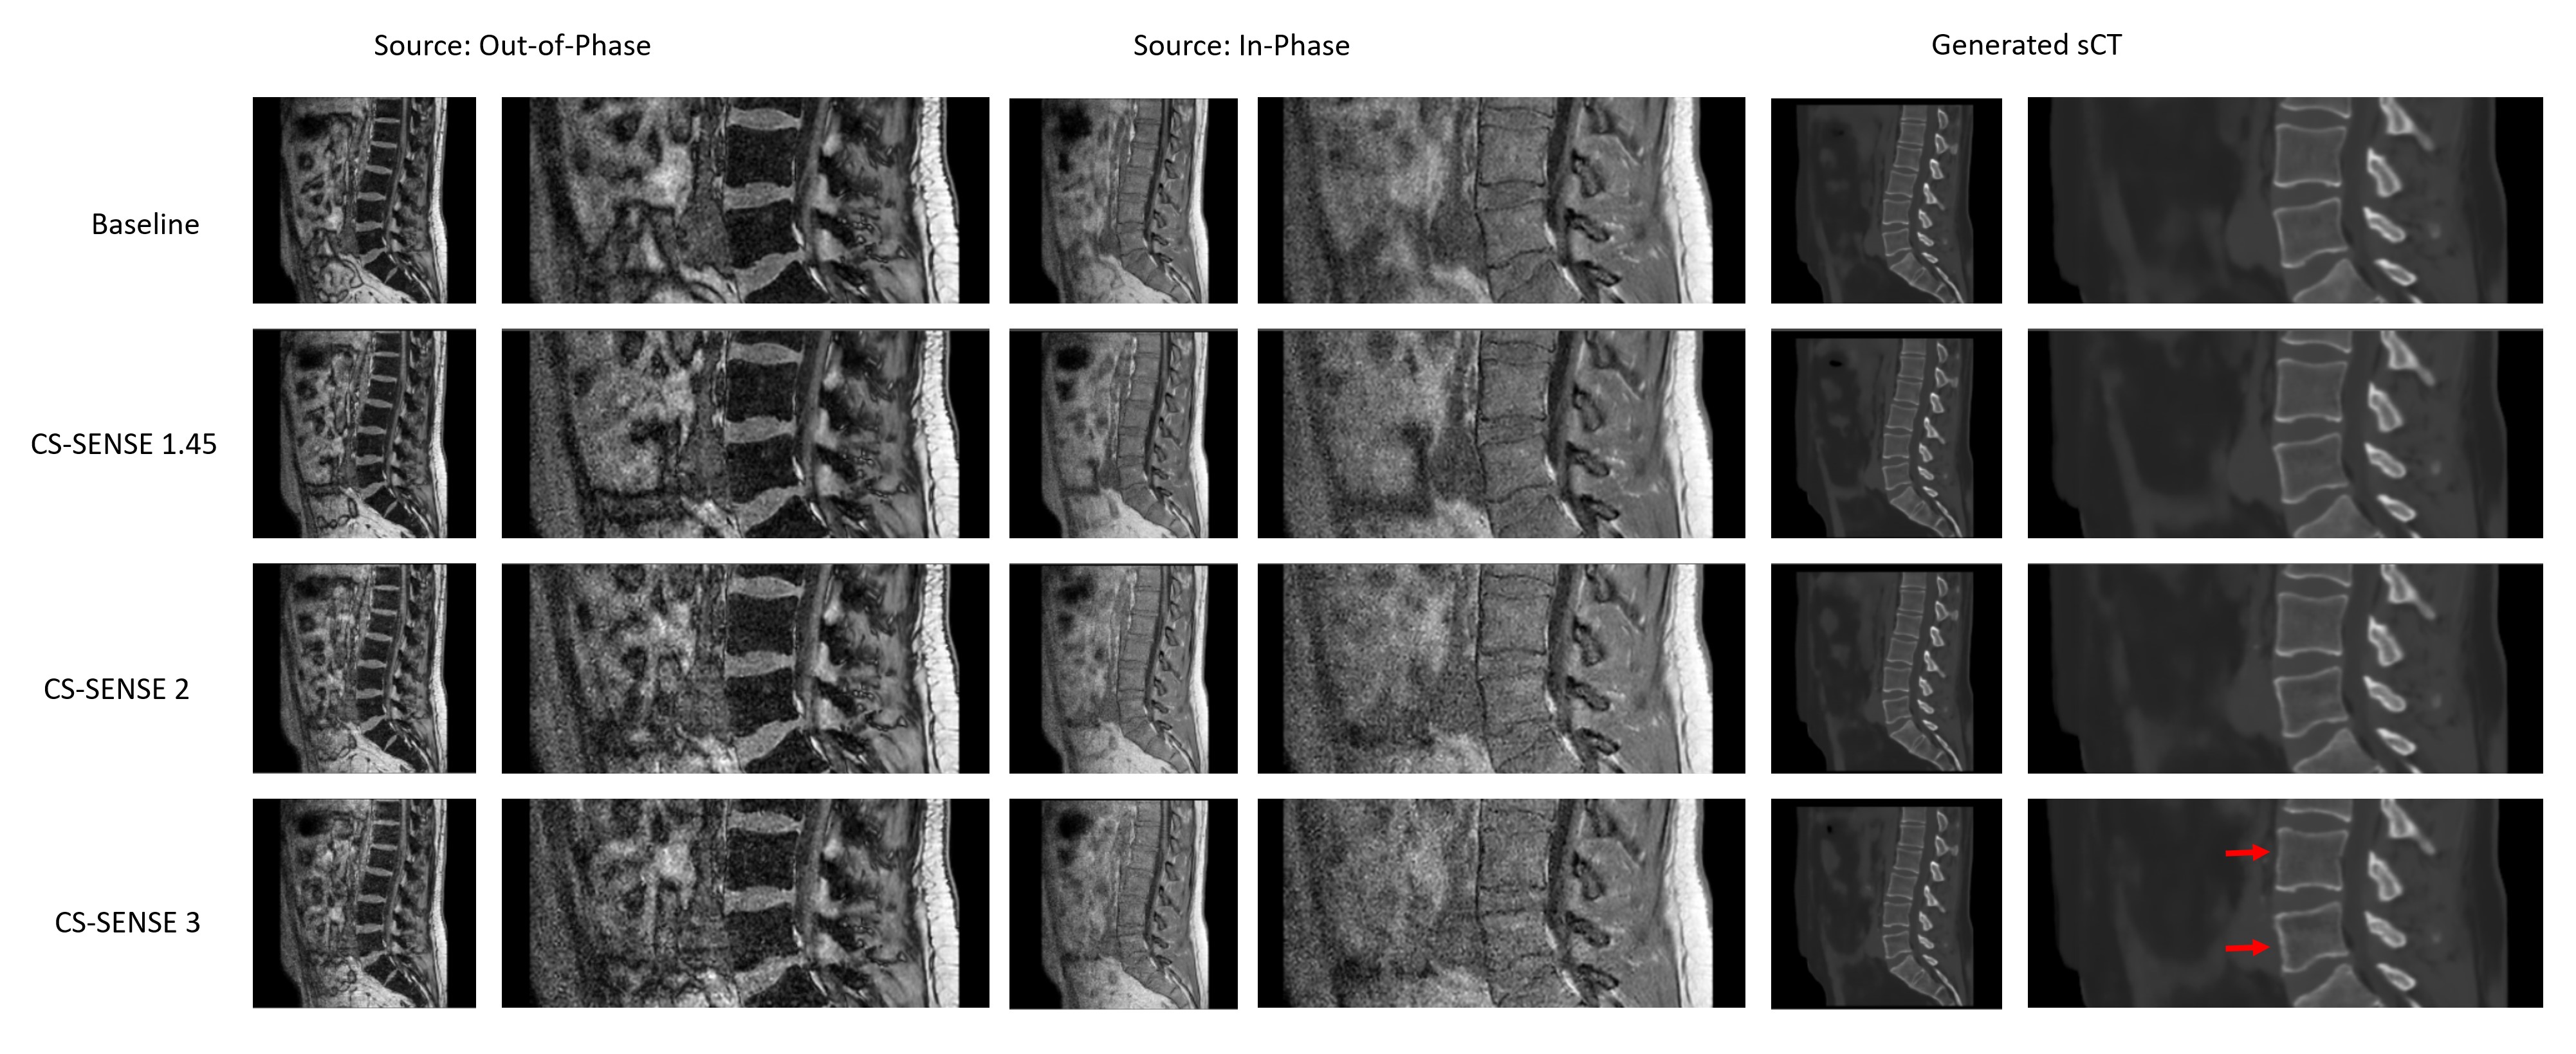
FIGURE 2. Experimental
results from the volunteer study: source OP and IP MR images with corresponding
generated sCT images (entire FOV and zoomed-in: baseline scan and accelerated
with CS-SENSE factors of 1.45, 2, and 3 scans. Red arrows point at the
vertebrae with less sharp edges. Note, the denoising level Strong was used for
the reconstruction of the CS-SENSE accelerated MR acquisition.
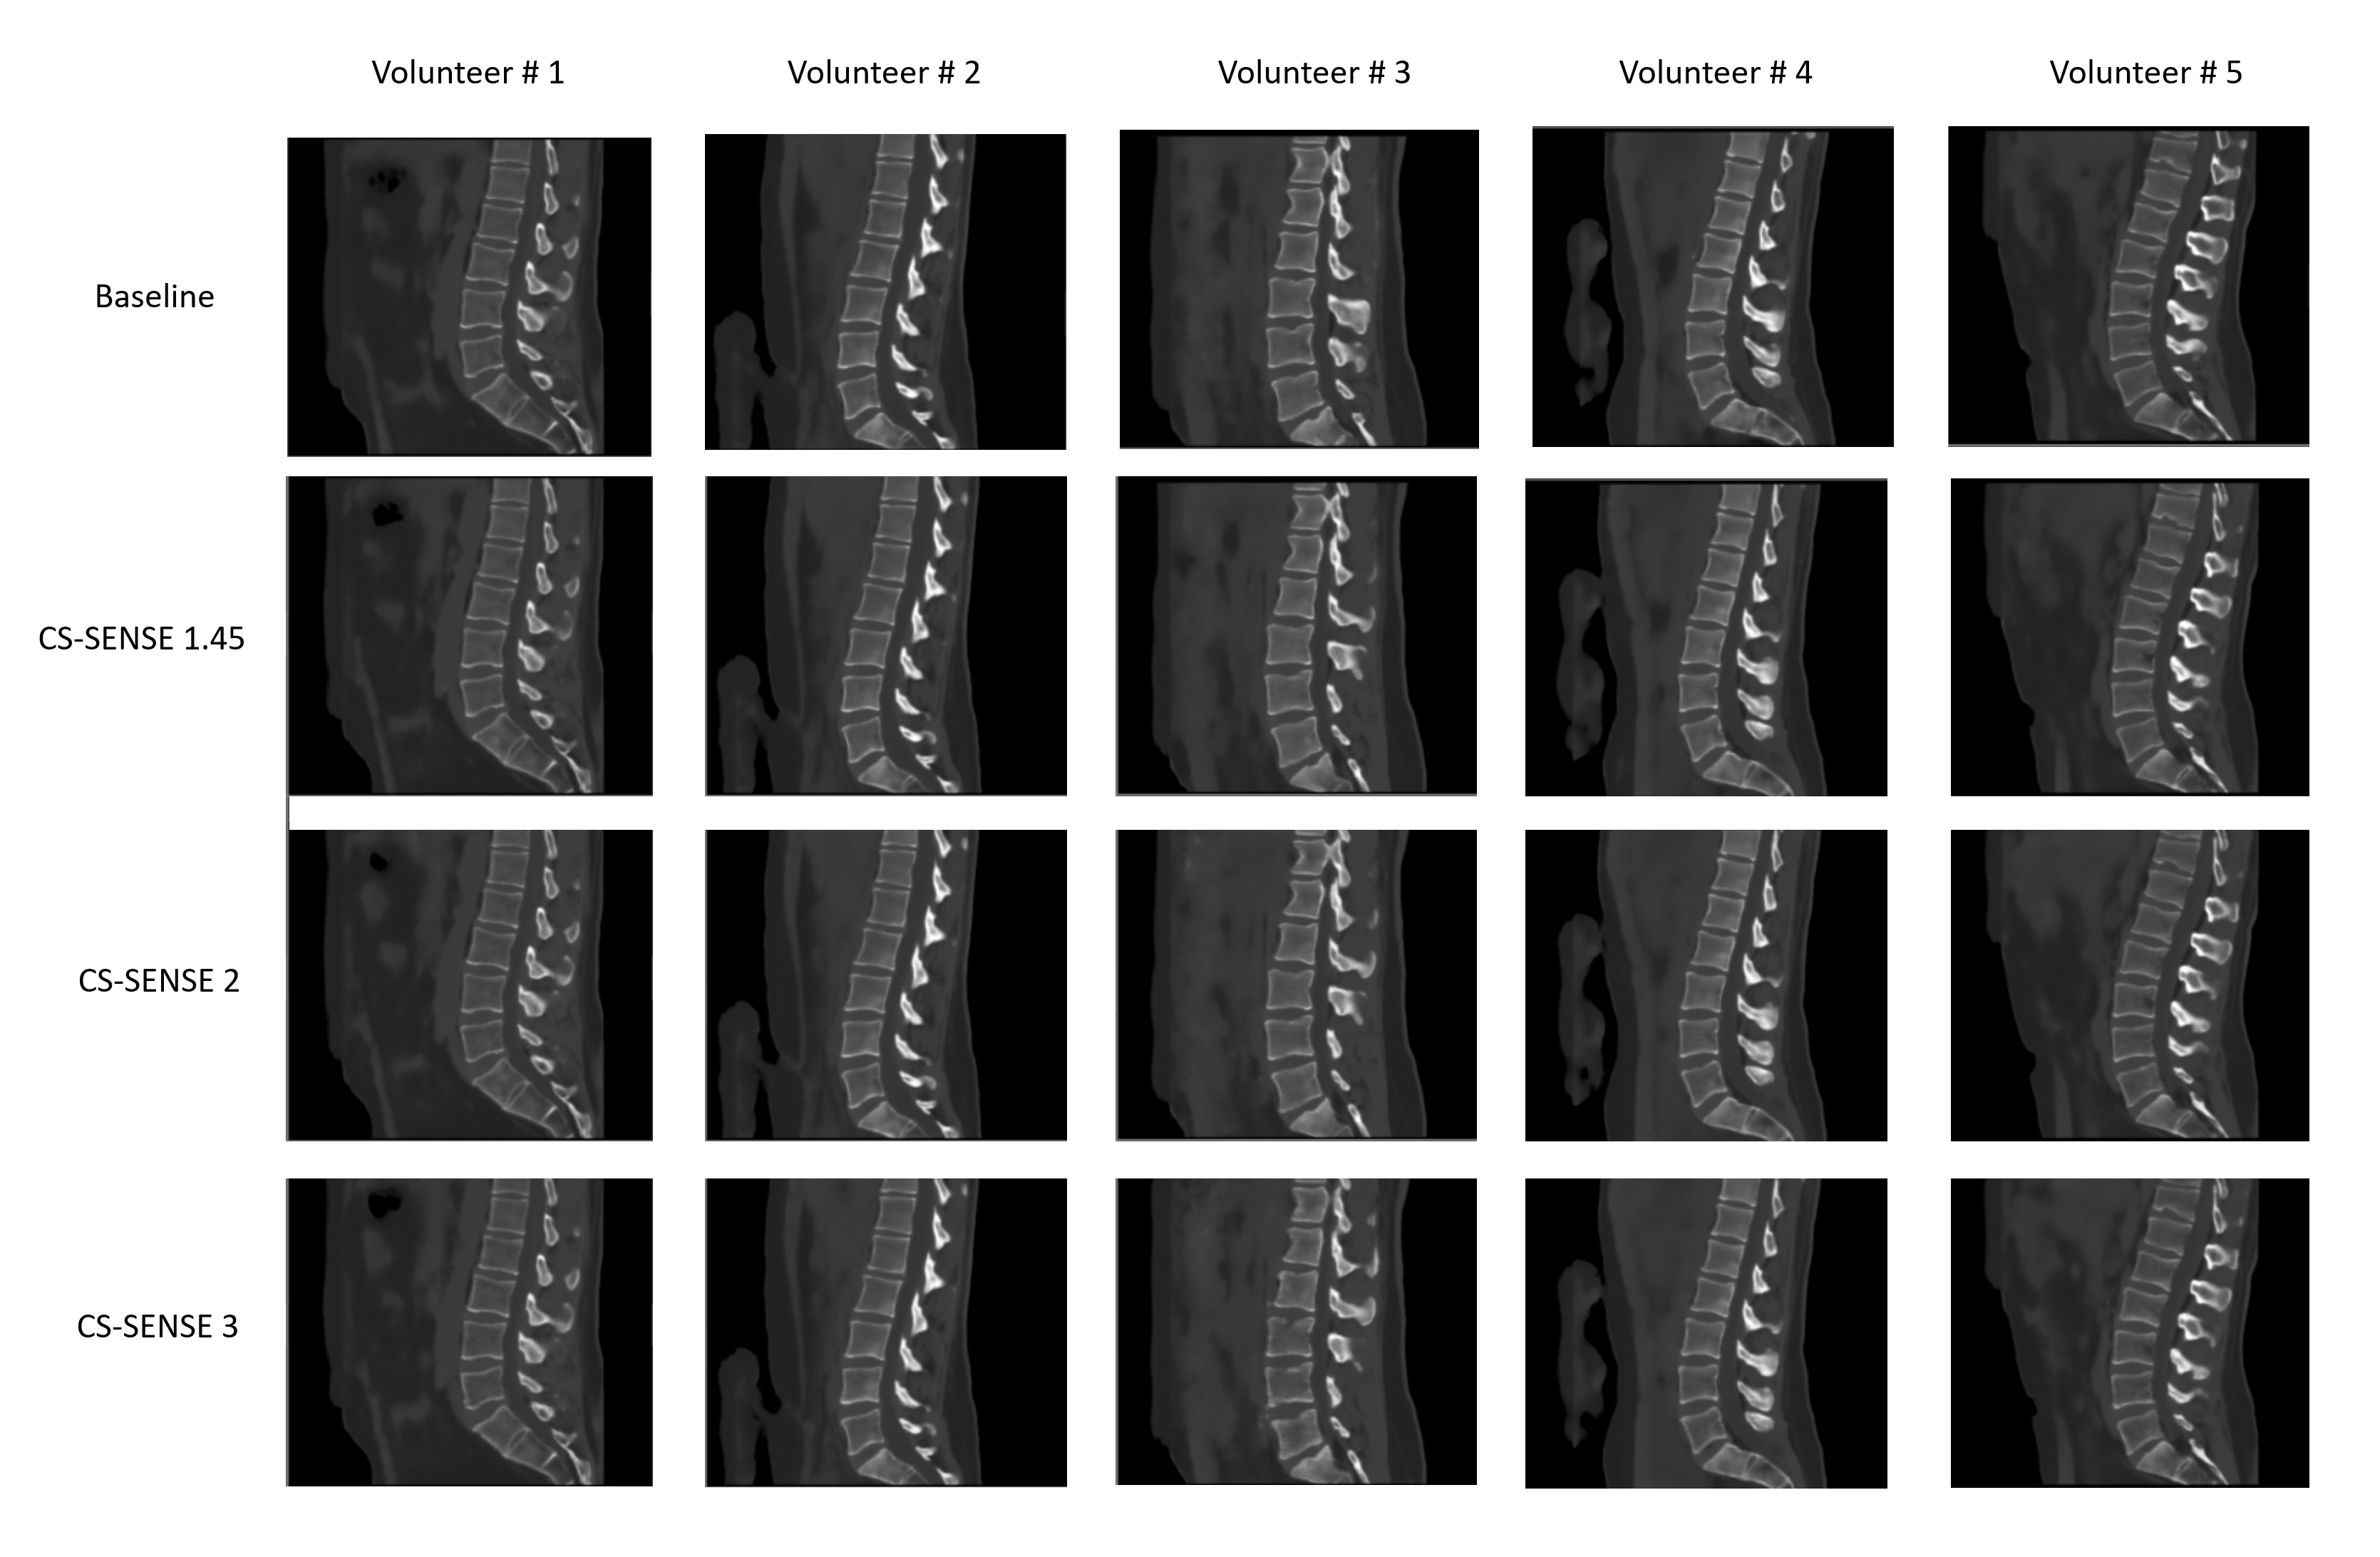
FIGURE 3. Experimental
results from the volunteer study: generated sCT images for the baseline scan
and accelerated with different CS-SENSE factor scans for all five volunteers. Note,
the denoising level Strong was used for the reconstruction of the CS-SENSE
accelerated MR acquisition.
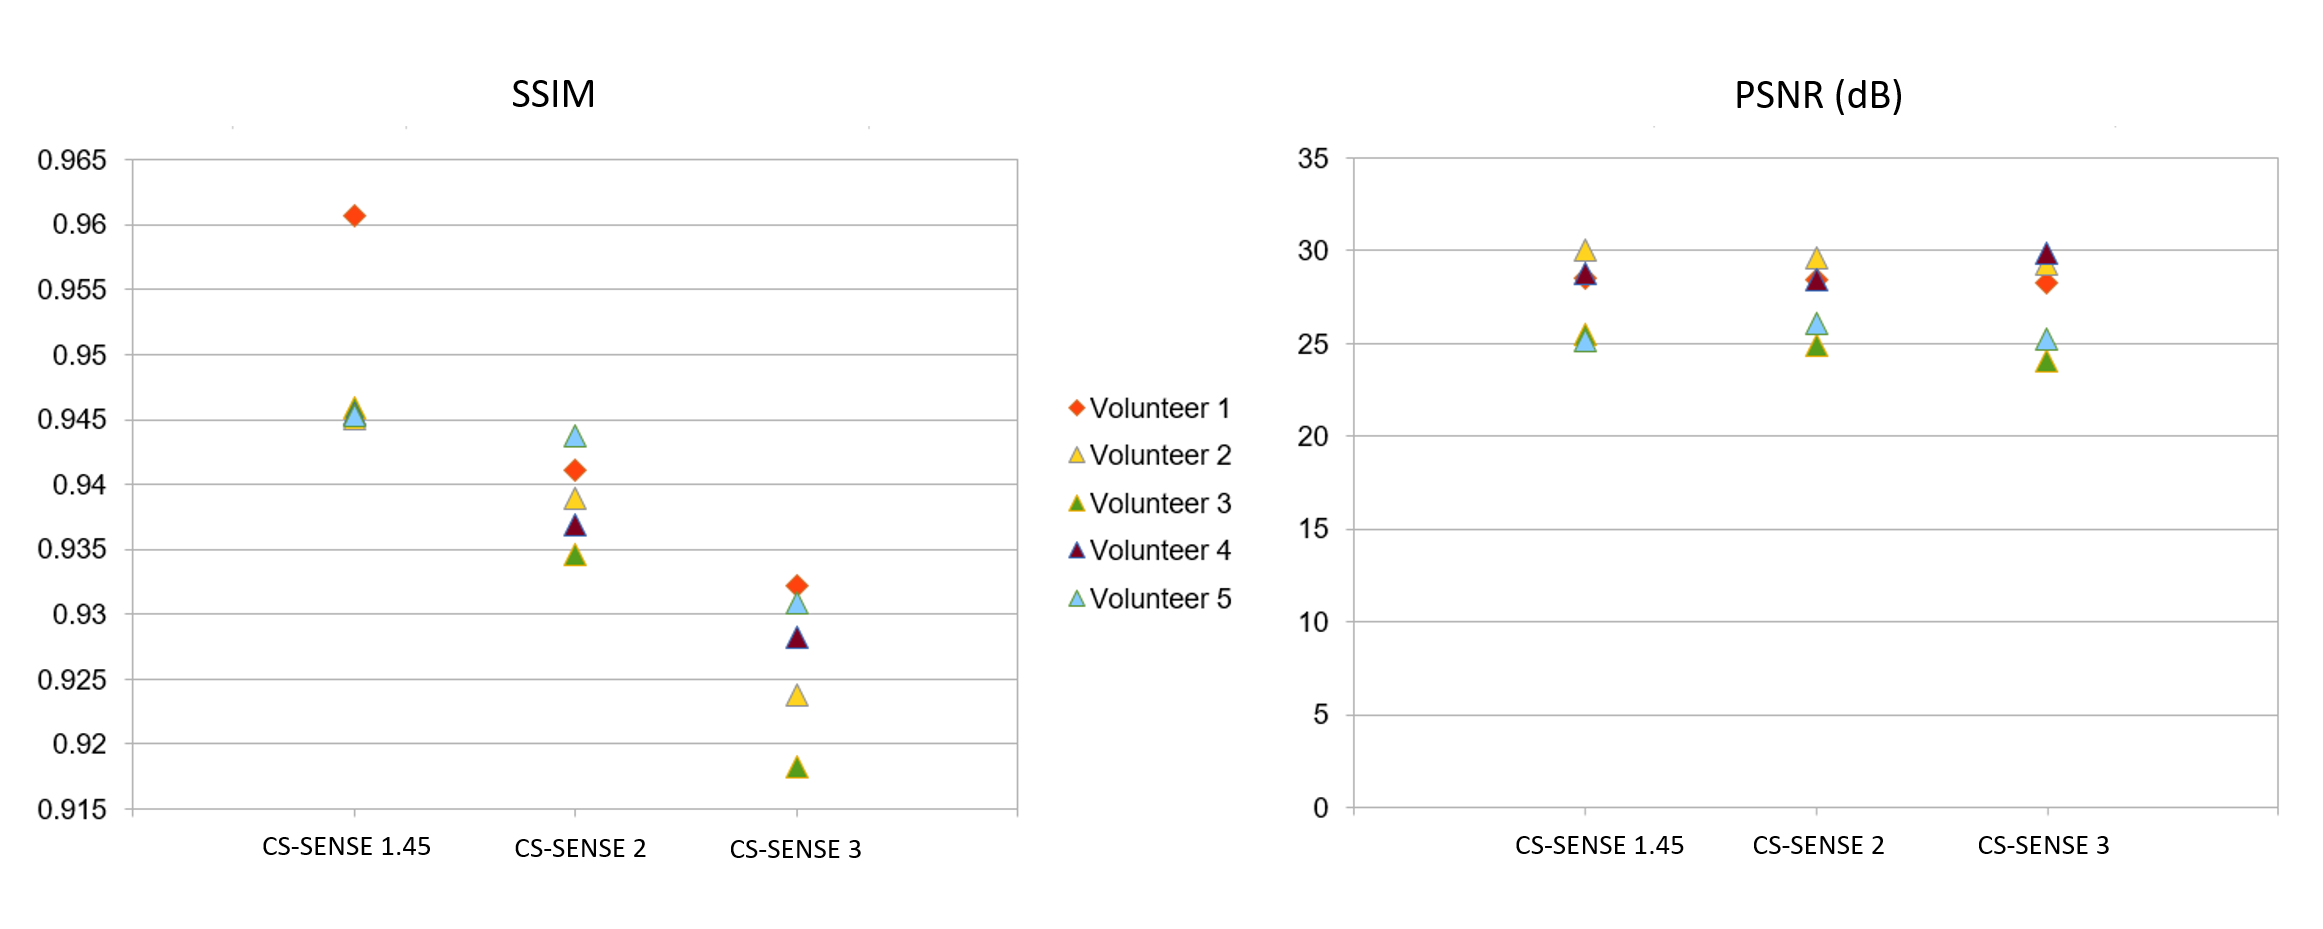
FIGURE 4. Experimental
results from the volunteer study: scatterplots of the SSIM and PSNR over 5
volunteers calculated on generated sCT images for different CS-SENSE
acceleration factors.
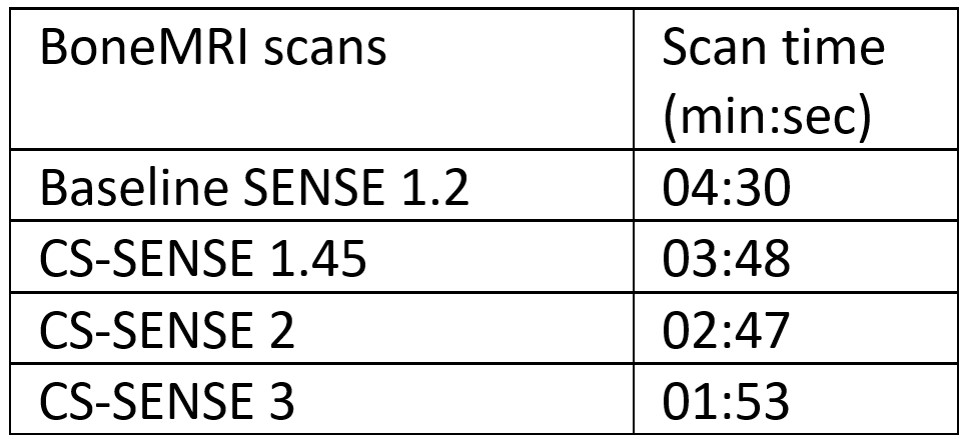
Table 1. Scan times for the
baseline and CS-SENSE accelerated MR acquisitions
DOI: https://doi.org/10.58530/2023/3107