3099
SSMo-QSM: A self-supervised learning method for model-based quantitative susceptibility mapping reconstruction1School of Biomedical Engineering, Shanghai Jiao Tong University, Shanghai, China
Synopsis
Keywords: Image Reconstruction, Quantitative Susceptibility mapping
This study, SSMo-QSM, introduced a self-supervised strategy to achieve a model-based deep learning QSM reconstruction for dealing with the imperfect ground truth in supervised learning methods. In SSMo-QSM, the direct frequency domain division results between phase and dipole kernel at untruncated areas of TKD are randomly separated into two subsets. One is used as the data consistency of the unrolled network and the other is used to define the loss function for training, respectively. The preliminary results of synthetic data suggested that SSMo-QSM performed comparably against supervised methods on accurate susceptibility mapping with suppressed streaking artifact.
Introduction
Quantitative Susceptibility Mapping (QSM) quantifies the magnetic susceptibility distribution from the measured MRI phase information, but the ill-posed inversion process from phase to susceptibility limited its application. Recently, a few deep learning (DL) methods have been adopted for this problem with great performance, including end-to-end strategy1, 2 and model-based strategy3, 4. However, current implementations of them are all based on a supervised learning scheme and the lack of the perfect golden standard for single-orientation in-vivo QSM hampers the tissue quantification accuracy.In this work, we proposed a method, Self-Supervised Model-based QSM (SSMo-QSM), by combining the self-supervised strategy with model-based DL QSM reconstruction to reconstruct QSM by using the data itself without external data or multi-orientation data. By randomly separating data of the well-defined region in the frequency domain into data consistency part and loss part respectively, SSMo-QSM showed comparative performance and better generalization against supervised methods in synthetic datasets.
Methods
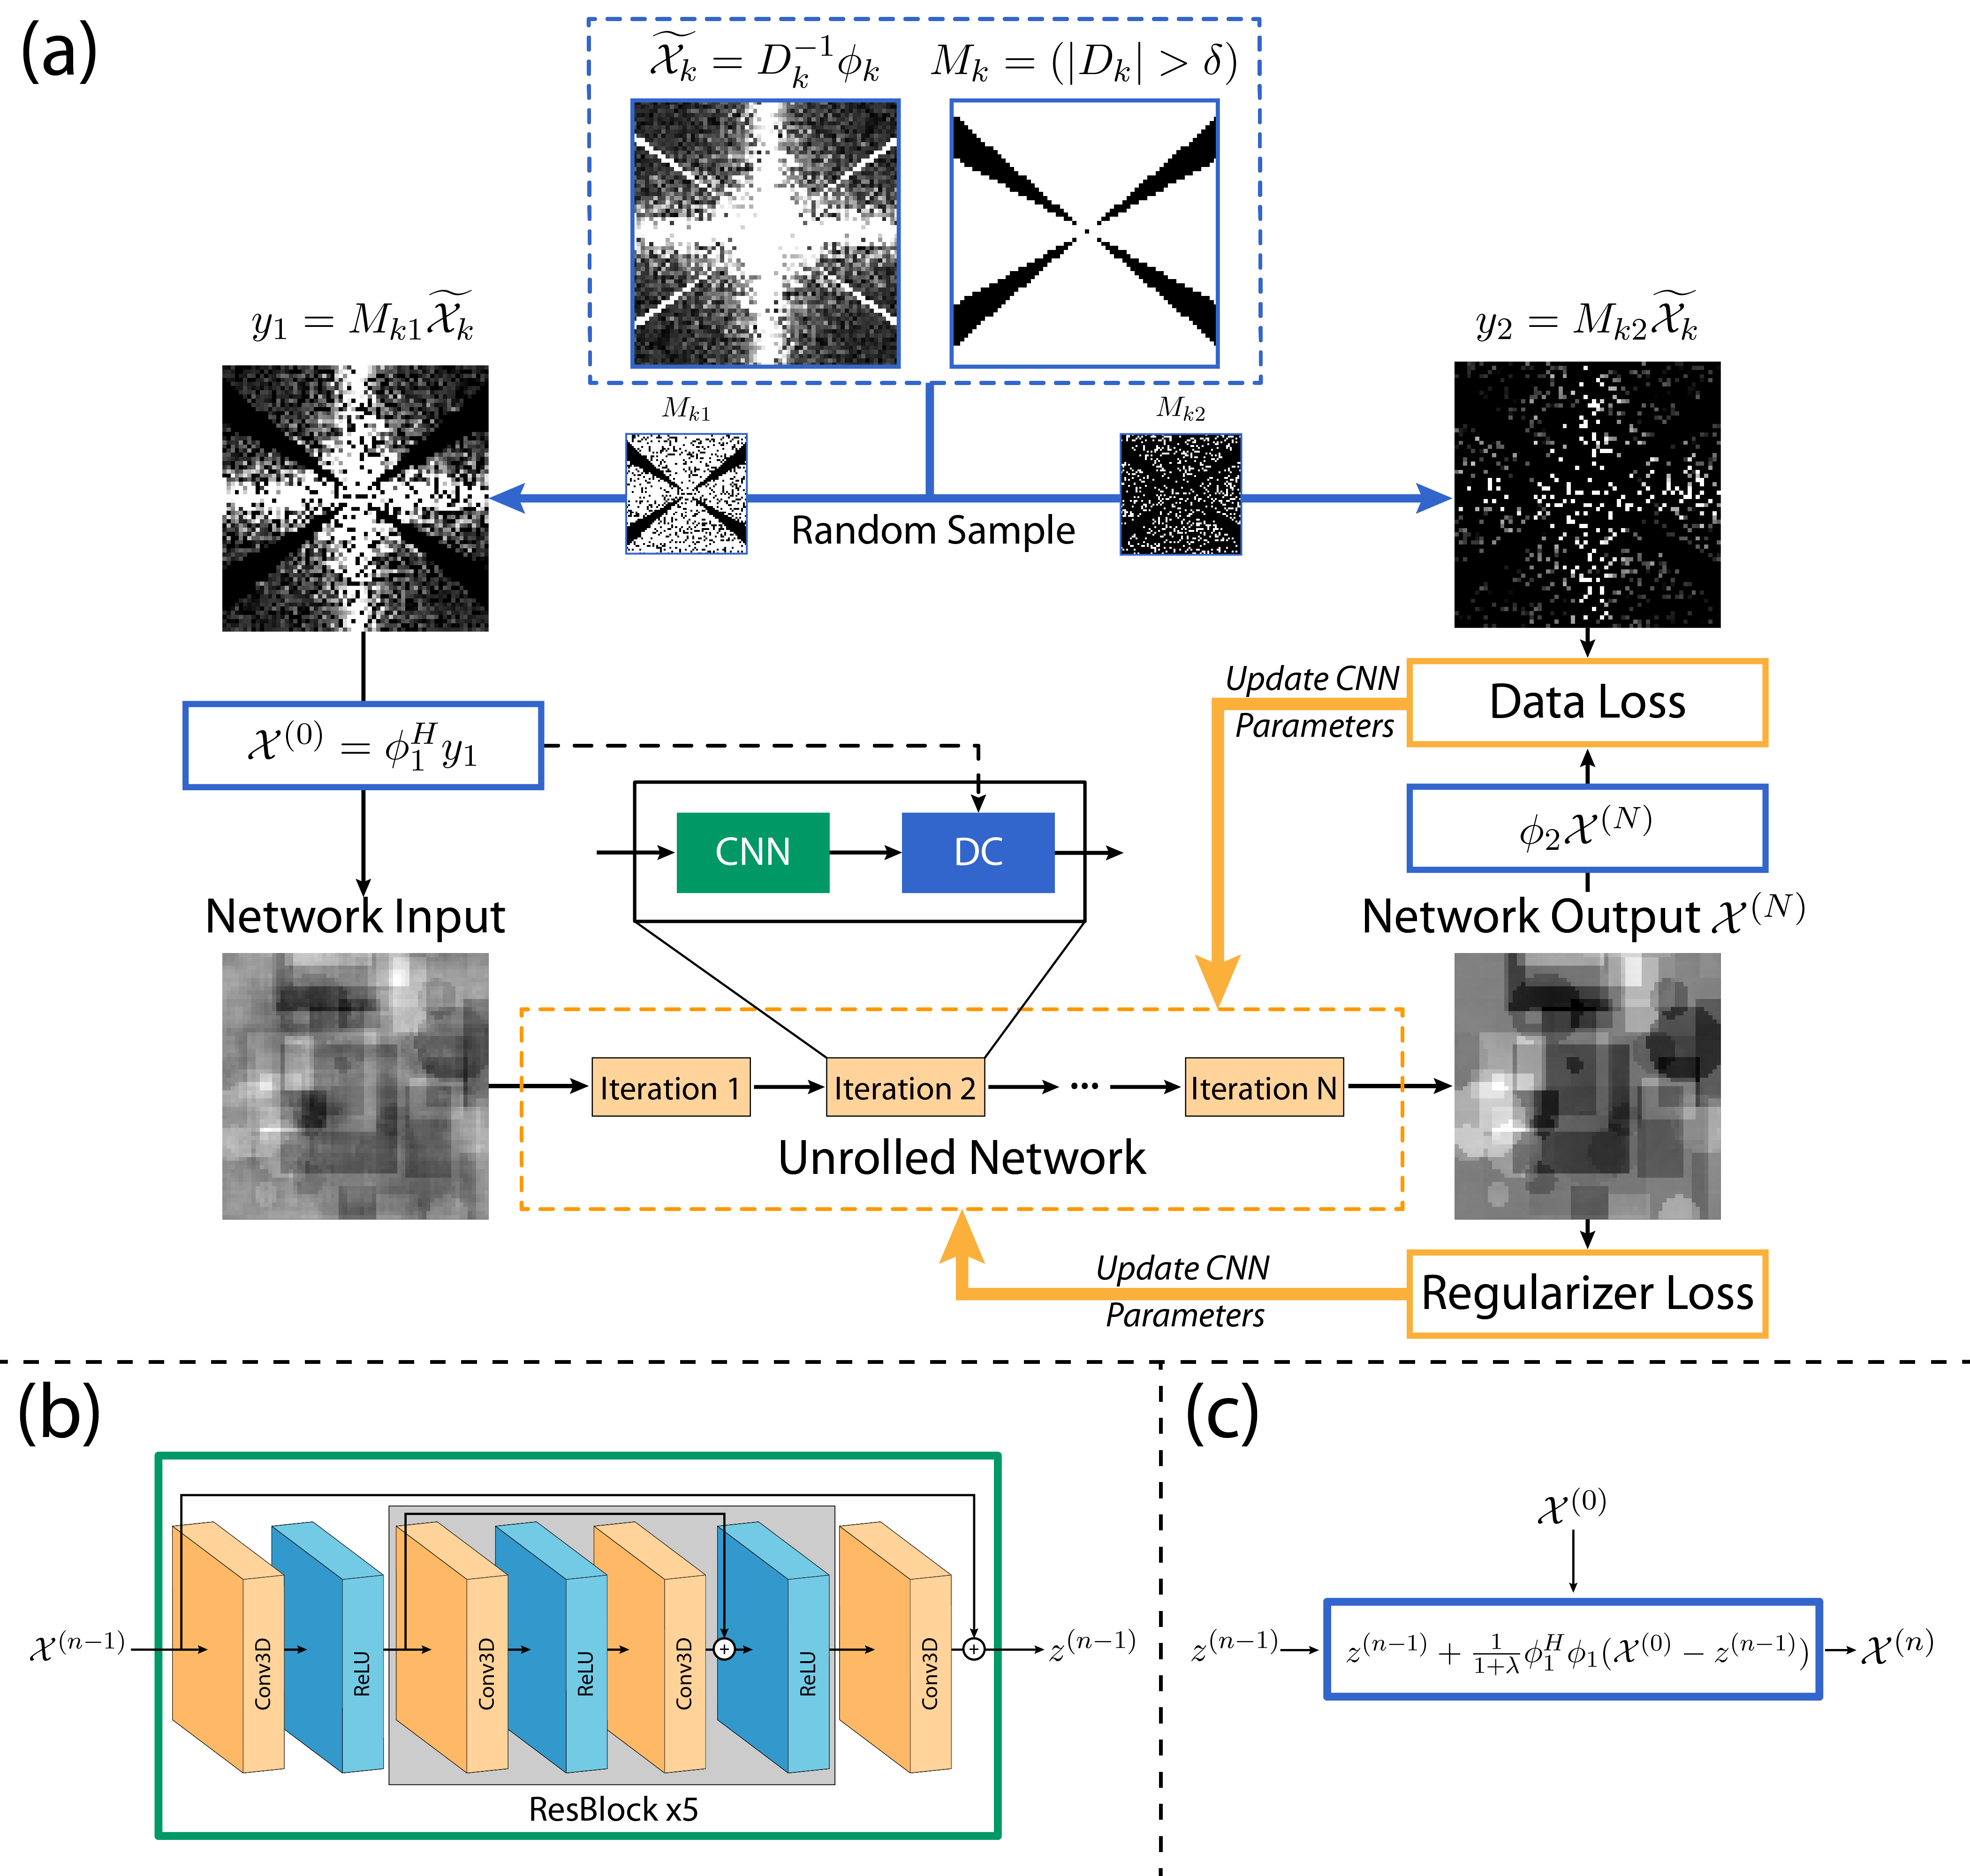
PipelineThe linear field-to-susceptibility relationship in k-space can be formulated as:
$$\phi_k=D_k\mathcal{X}_k,\tag{1}$$ where $$$D_k$$$, $$$\phi_k$$$ and $$$\mathcal{X}_k$$$ represent the dipole kernel, normalized phase and susceptibility in k-space respectively.
In truncated k-space division (TKD)5, the dipole kernel is truncated by a threshold $$$\delta$$$ to prevent large incorrect values in direct division result $$$\widetilde{\mathcal{X}_k}=D_k^{-1}\phi_k$$$ and the remaining data at untruncated areas $$$M_k=(\left\lvert D_k\right\rvert>\delta)$$$ are kept as well-posed measured data $$$y=M_k\widetilde{\mathcal{X}_k}$$$. Thus, the ill-posed reconstruction problem can be transferred into an optimization problem with Fourier undersampling $$$\phi=M_k\mathcal{F}$$$:
$$\mathop{\arg\min}\limits_{\mathcal{X}}{\Vert\phi \mathcal{X}-y\Vert_2^2+\mathcal{R}(\mathcal{X})},\tag{2}$$ where $$$\mathcal{R}(\mathcal{X})$$$ represents the regularizer on susceptibility $$$\mathcal{X}$$$.
One solution of Eq. 2 is to alternate the optimization of $$$\mathcal{X}$$$ and the auxiliary variable $$$z$$$ iteratively, which is usually substituted by an unrolled network containing fixed numbers of CNN (Eq. 3) and DC (Eq. 4) blocks6:
$$z^{(n-1)}=f_{CNN}(\mathcal{X}^{(n-1)}),\tag{3}$$ $$\mathcal{X}^{(n)}=z^{(n-1)}+\frac{1}{1+\lambda}\phi^H\phi(\mathcal{X}^{(0)}-z^{(n-1)}).\tag{4}$$
For the supervised situation, a data loss function of MSE is calculated between network output $$$\mathcal{X}^{(N)}$$$ and the ground truth in k-space. The regularizer losses are also adopted for faster convergence, including a TV loss and a background loss based on the image domain background mask $$$m$$$. The total loss is written as:
$$L=\Vert\mathcal{F}\mathcal{X}^{(N)}-\mathcal{F}\mathcal{X}_{ref}\Vert_2^2+\mu_1TV(\mathcal{X}^{(N)})+\mu_2\Vert m\mathcal{X}^{(N)}\Vert_1\tag{5}$$ for CNN weights update.
Based on the pipeline mentioned above, SSMo-QSM is illustrated in Figure 1 with two randomly separated data sets without overlap with each other6. The set located by $$$M_{k1}$$$ is used for network input initiation and data consistency:
$$ \mathcal{X}^{(n)} = z^{(n-1)} + \frac{1}{1+\lambda} \phi_1^H \phi_1 (\mathcal{X}^{(0)} - z^{(n-1)}), \tag{6} $$ while the set located by $$$M_{k2}$$$ is used for loss calculation:
$$ L = \Vert \phi_2 \mathcal{X}^{(N)} - y_2 \Vert_2^2 + \mu_1 TV(\mathcal{X}^{(N)}) + \mu_2 \Vert m \mathcal{X}^{(N)} \Vert_1. \tag{7} $$
Implementation
The mask $$$M_{k1}$$$ used in the proposed self-supervised method is generated with uniform random selection within the 3d frequency domain, and $$$M_{k2} = M_{k} - M_{k1}$$$. The threshold $$$\delta$$$ for $$$M_k$$$ is 0.1, and the ratio of mask size $$$sum(M_{k1})/sum(M_{k})$$$ is set to 0.8.
The CNN adopted in the proposed pipeline is based on a ResNet-like structure, including 12 3D convolution layers with a kernel size of 3 and 32 channels. The iteration number N is 3.
Results
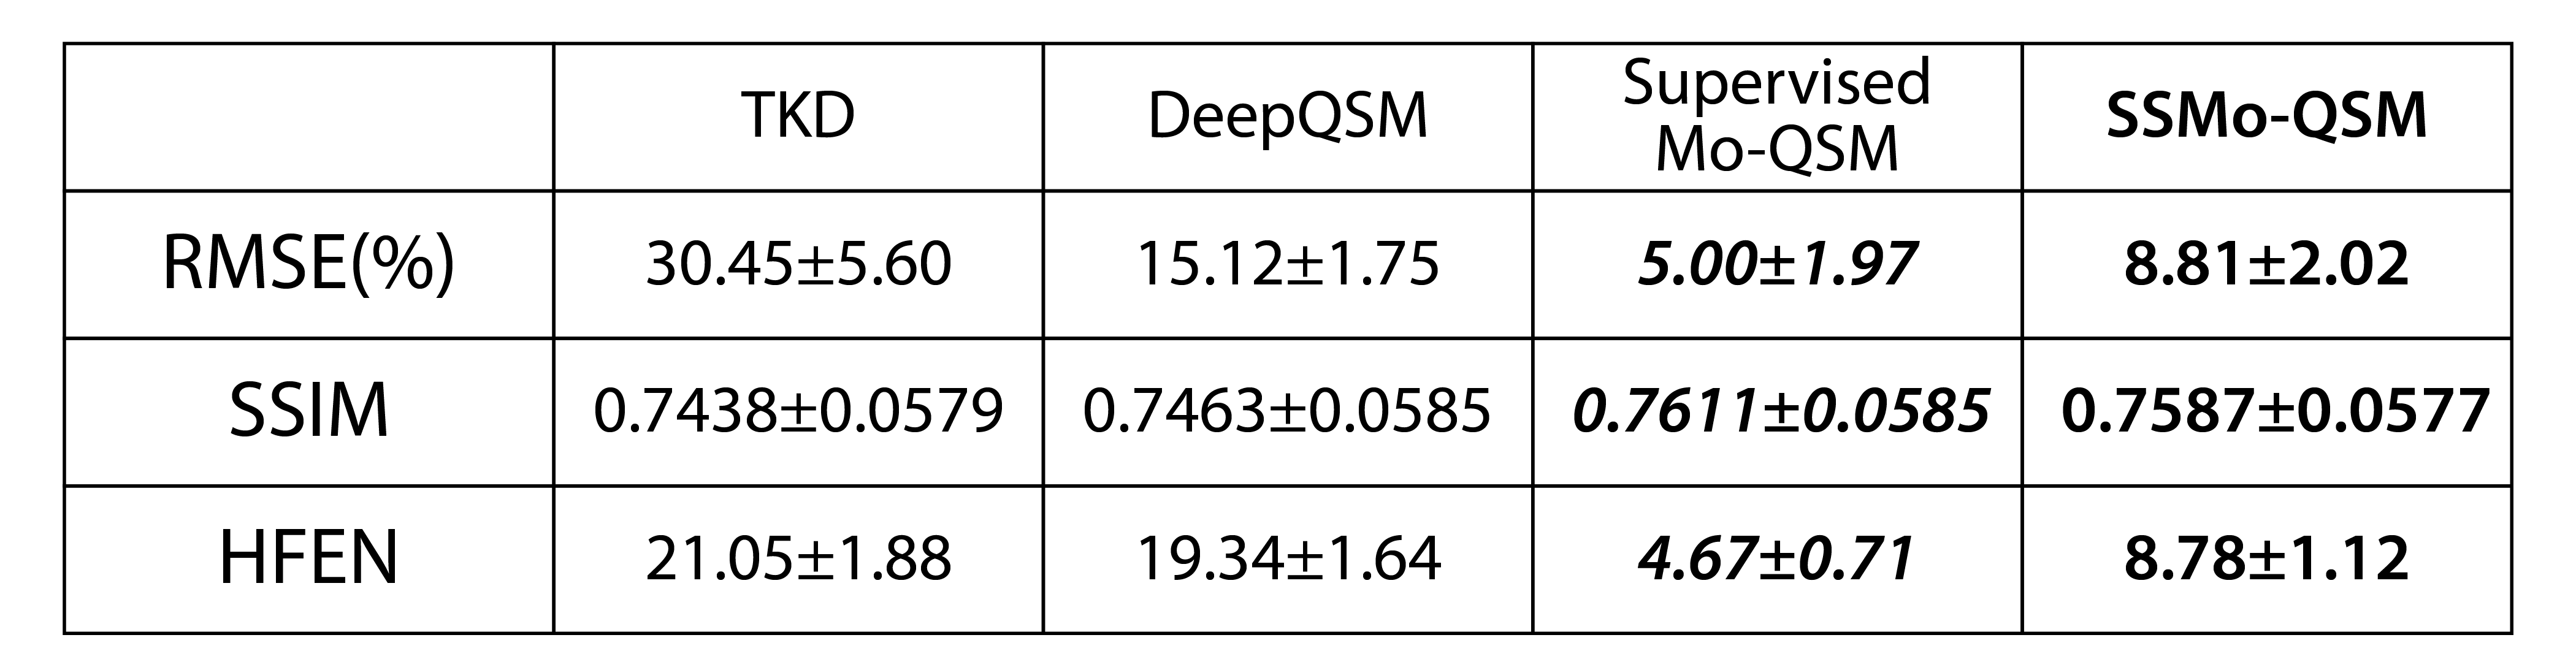
10000 64*64*64 3D synthetic susceptibility patches were simulated with randomly added cubes and spheres. The corresponding phase patches were generated according to Eq. 1 and the detailed configuration followed the description in DeepQSM2. 9500 patches are used for training and the rest 500 patches are used for testing.The proposed SSMo-QSM is compared with TKD and DeepQSM. To better analyze the influence of the self-supervised strategy, the supervised pipeline (captioned as Supervised Mo-QSM) described in Methods part is also compared.
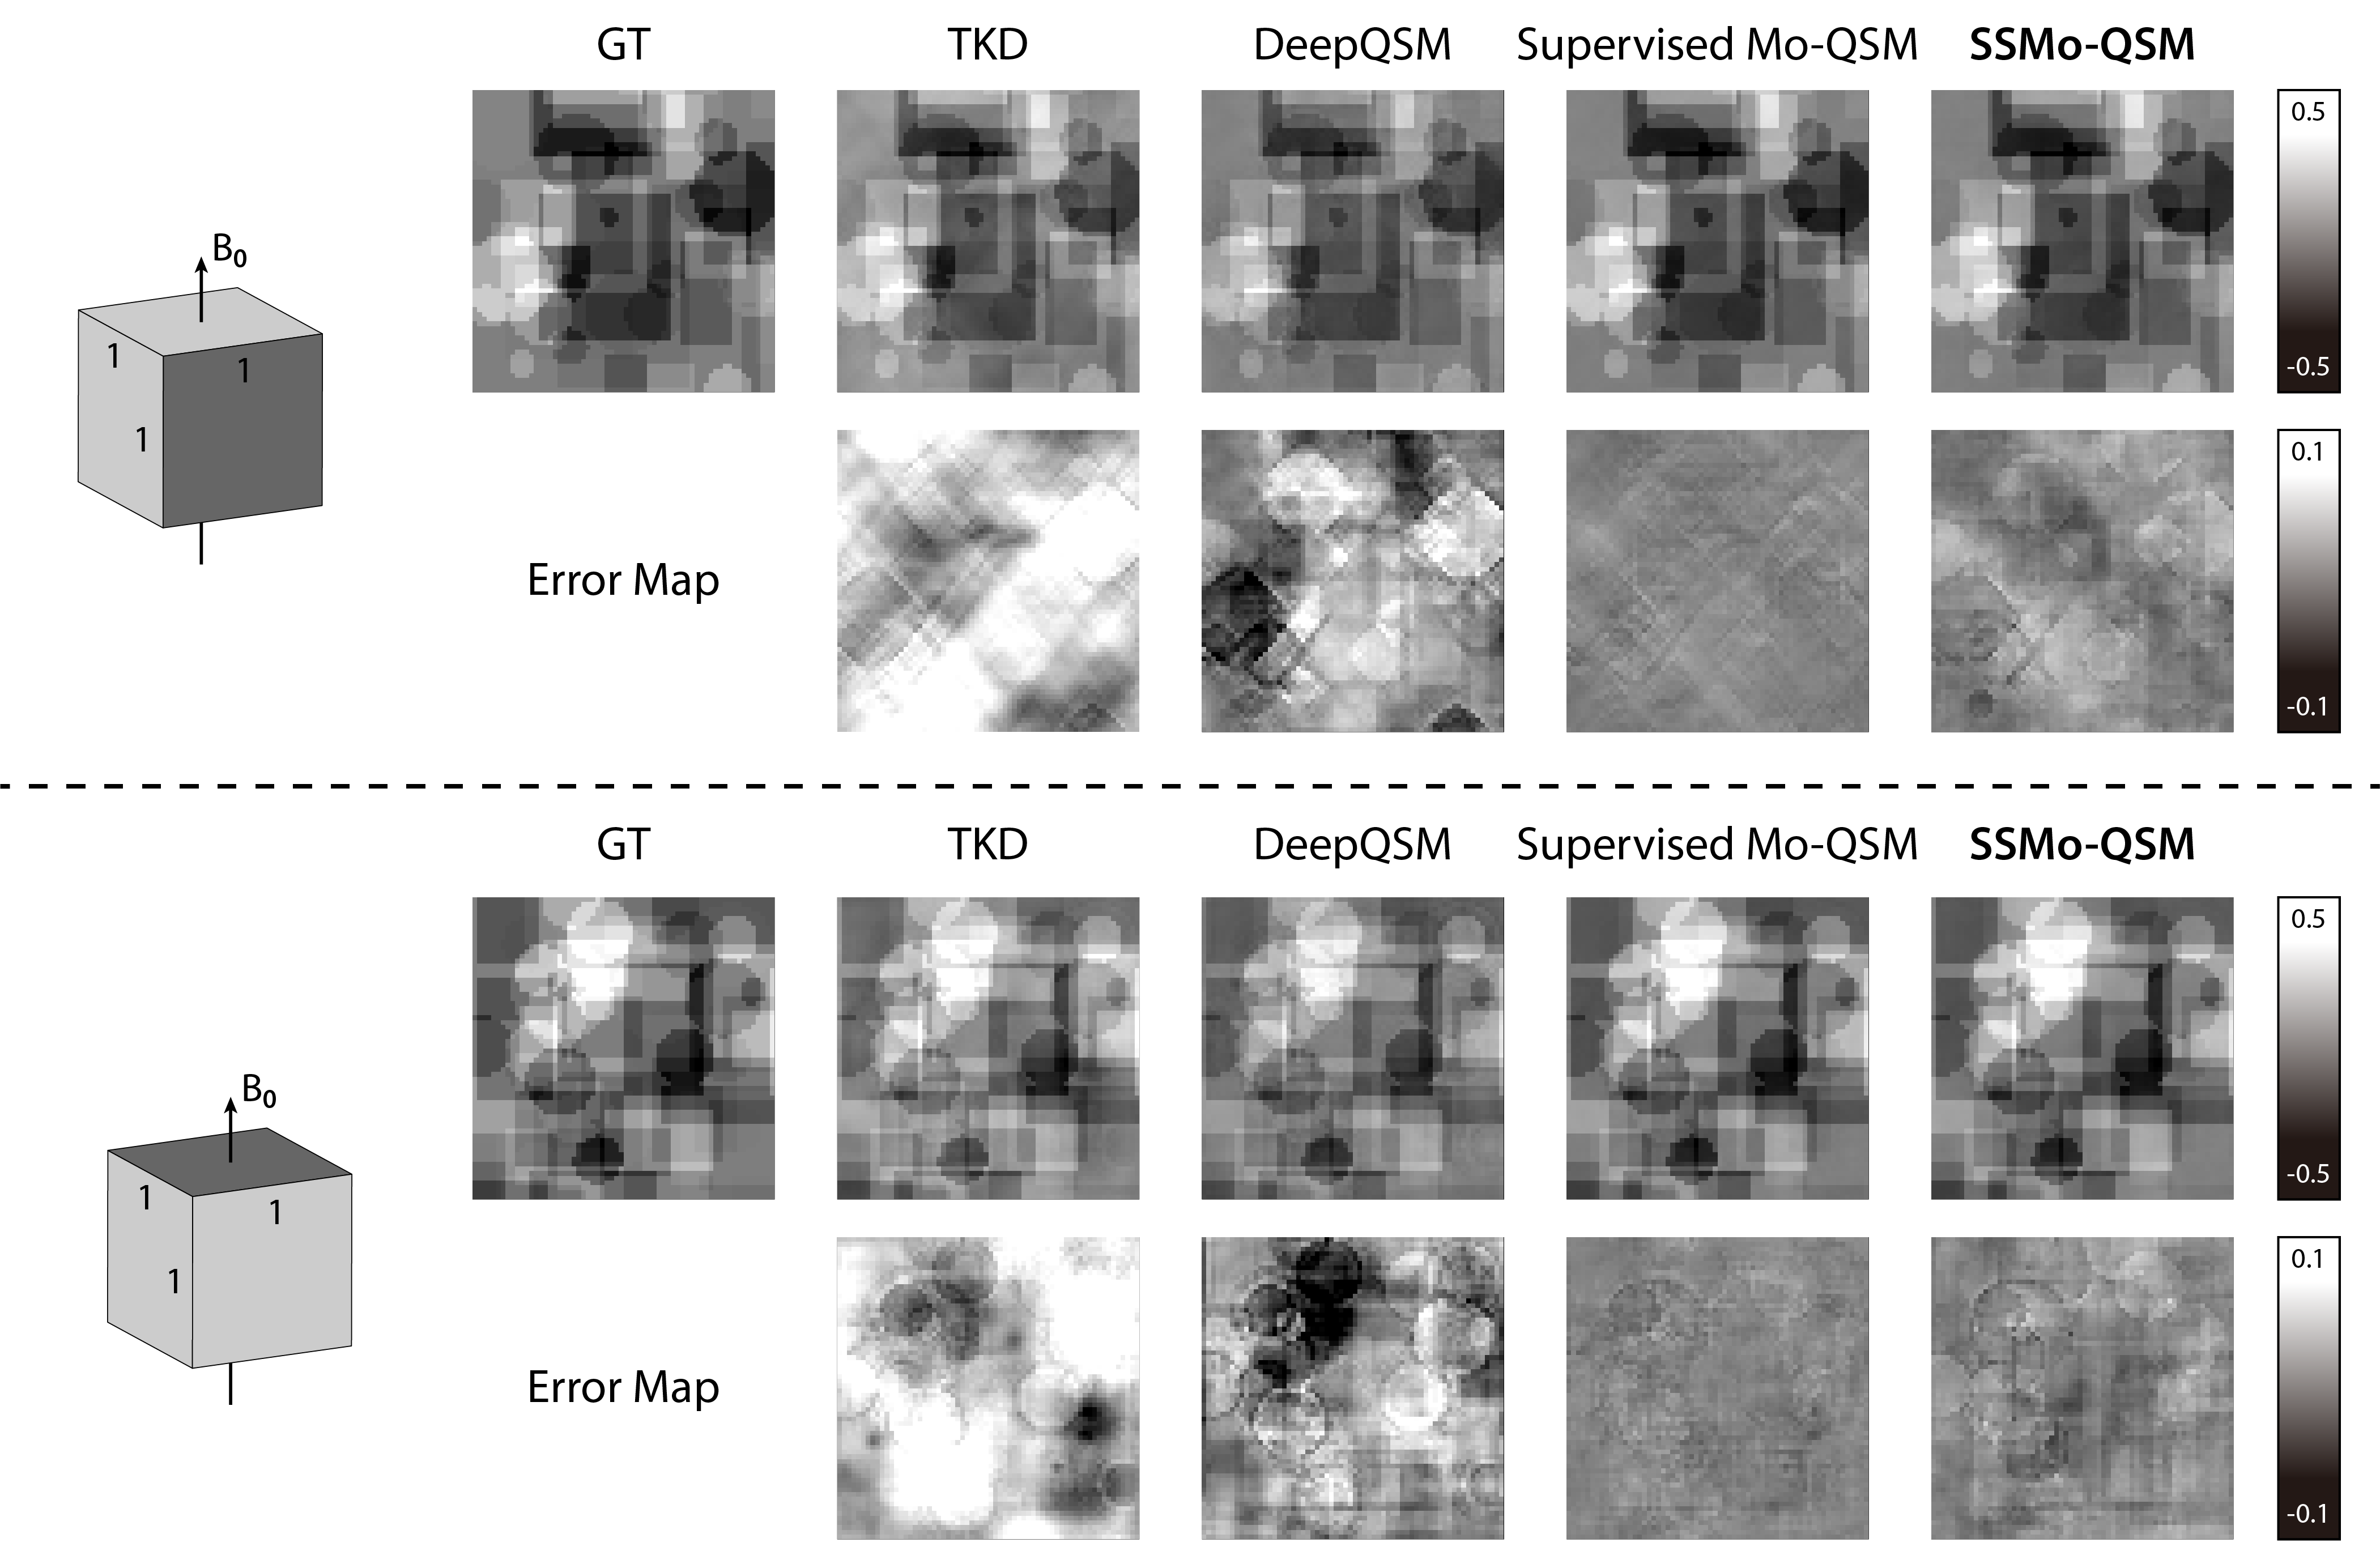
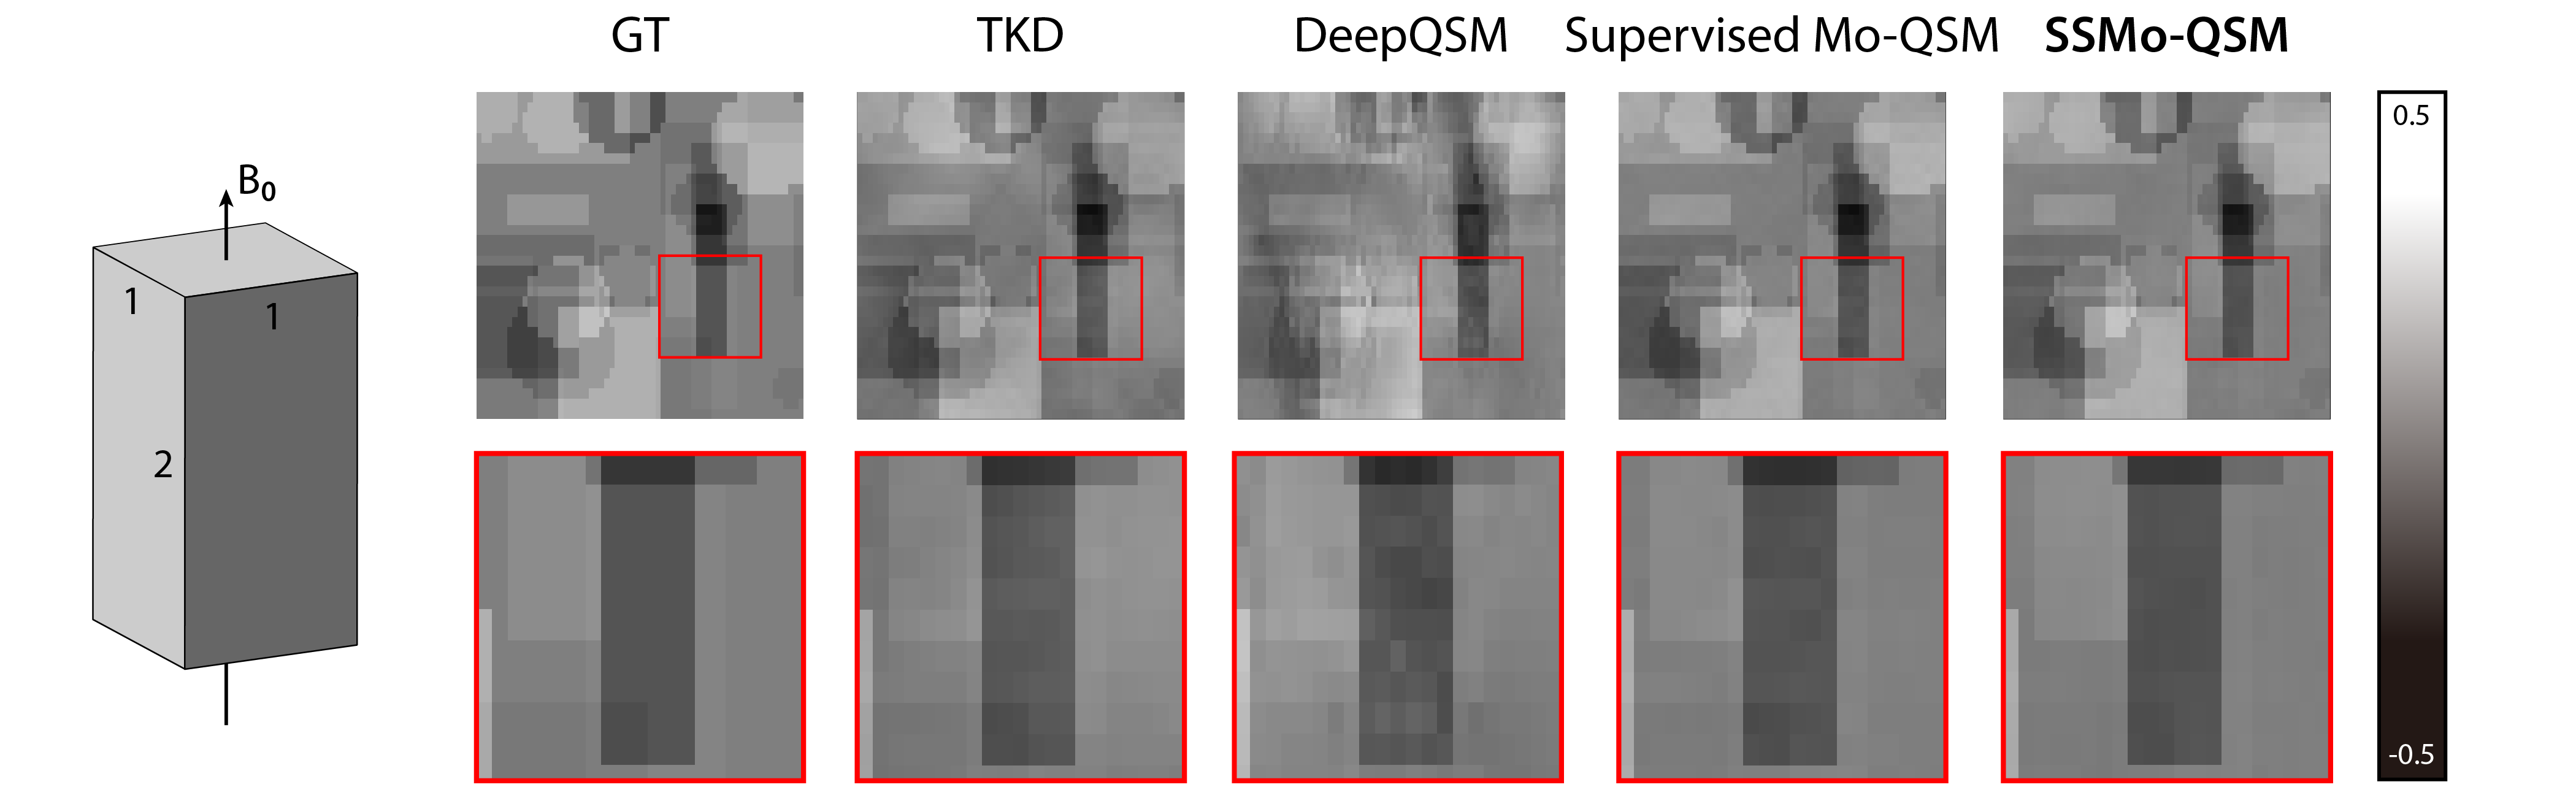
Figure 2 shows one example of the predicted susceptibility map with different reconstruction methods in the plane parallel to $$$B_0$$$ and perpendicular to $$$B_0$$$. Figure 3 shows the quantitative performance metrics compared between different reconstruction methods. The results suggested that the Supervised Mo-QSM shows the best reconstruction performance on susceptibility mapping and artifact reduction, while SSMo-QSM exhibits comparable performance to the supervised Mo-QSM. In comparison, DeepQSM suffered severe susceptibility underestimation and TKD results are polluted by background bias and streaking artifacts.
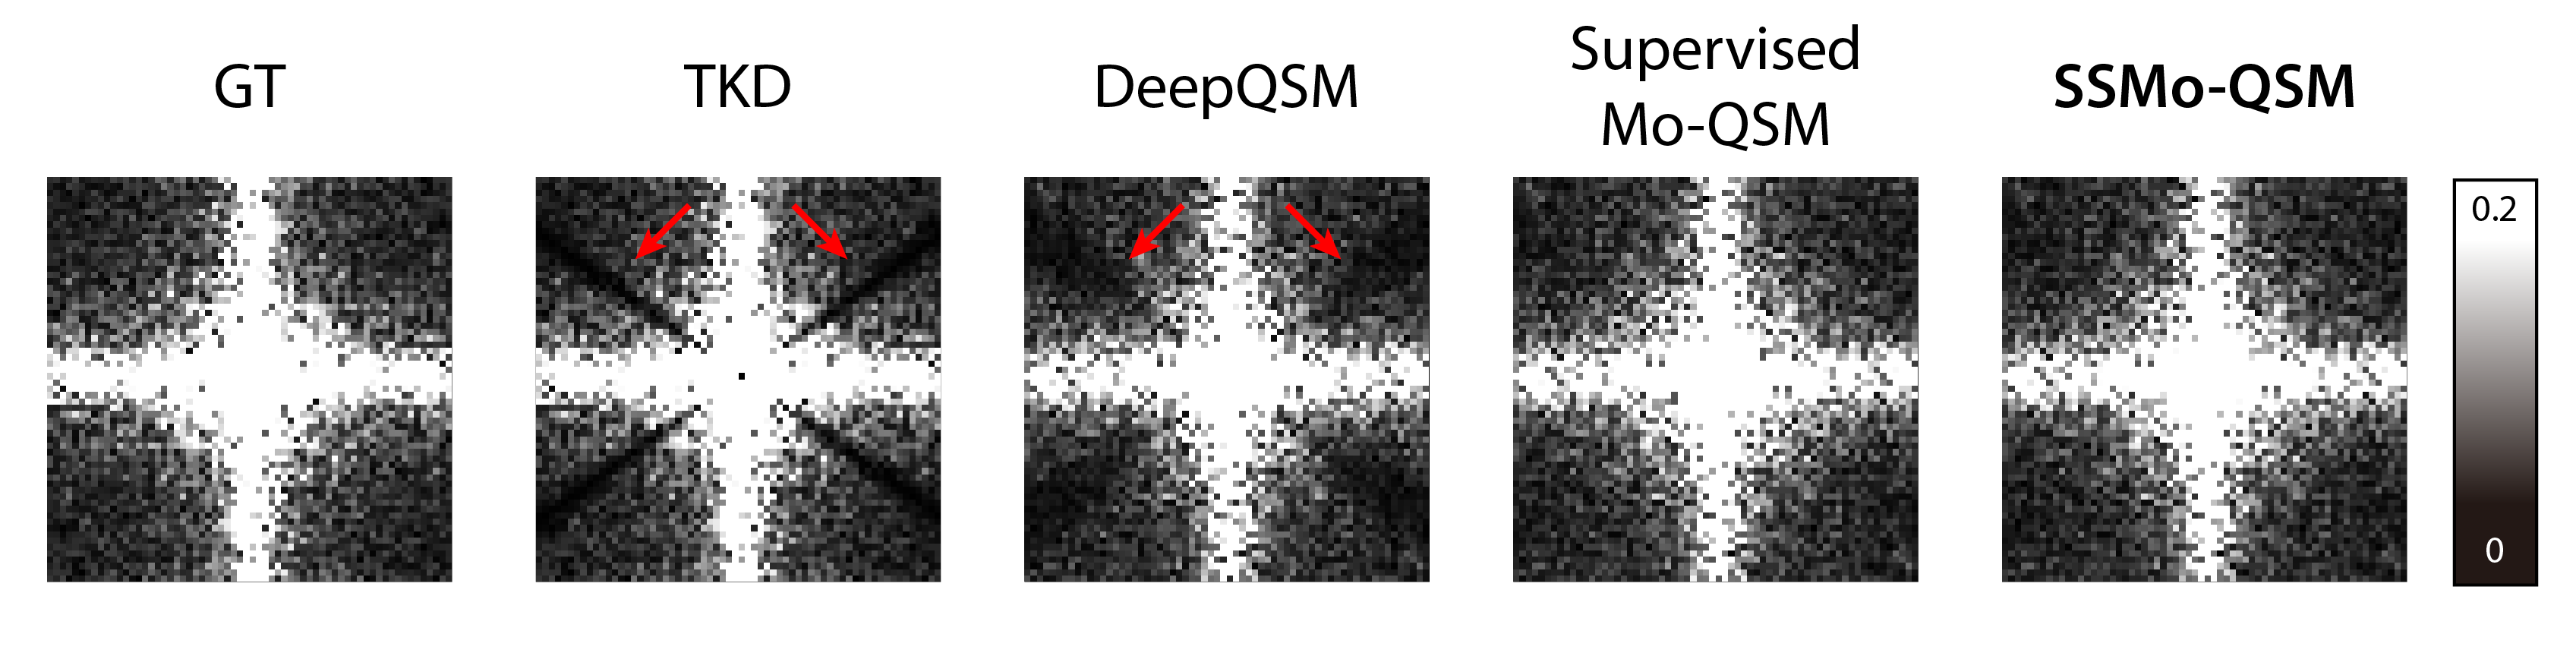
Figure 4 shows the frequency domain of the reconstructed susceptibilities by different methods. Compared with the ground truth, both Supervised Mo-QSM and SSMo-QSM show similar results, while the TKD and DeepQSM suffer obvious data loss at the truncated areas.
Figure 5 gives the generalization test results with a different resolution from the training data. Visually, SSMo-QSM shows less streaking artifact than the results reconstructed using the Supervised Mo-QSM, DeepQSM and TKD.
Discussion
The results on synthetic data showed that the proposed SSMo-QSM achieved a comparable result with the Supervised MoQSM, while outperforming the conventional TKD and the end-to-end learning method DeepQSM. The k-pace comparison results and generalization test further confirmed the effectiveness of the model-based network architecture in recovering the loss information at the truncated areas of TKD, and also the effectiveness of the self-supervised strategy for QSM reconstruction with better generalization.Conclusion
In conclusion, the proposed learning-based SSMo-QSM shows great potential for accurate QSM reconstruction without ground truth. Further studies are needed to validate the self-supervised strategy in realistic in-vivo QSM reconstruction.Acknowledgements
No acknowledgement found.References
1. Yoon, J., et al., Quantitative susceptibility mapping using deep neural network: QSMnet. Neuroimage, 2018. 179: p. 199-206.
2. Bollmann, S., et al., DeepQSM - using deep learning to solve the dipole inversion for quantitative susceptibility mapping. Neuroimage, 2019. 195: p. 373-383.
3. Lai, K.W., et al., Learned Proximal Networks for Quantitative Susceptibility Mapping. Med Image Comput Comput Assist Interv, 2020. 12262: p. 125-135.
4. Feng, R., et al., MoDL-QSM: Model-based deep learning for quantitative susceptibility mapping. Neuroimage, 2021. 240: p. 118376.
5. Shmueli, K., et al., Magnetic Susceptibility Mapping of Brain Tissue In Vivo Using MRI Phase Data. Magnetic Resonance in Medicine, 2009. 62(6): p. 1510-1522.
6. Yaman, B., et al., Self-supervised learning of physics-guided reconstruction neural networks without fully sampled reference data. Magnetic Resonance in Medicine, 2020. 84(6): p. 3172-3191.
Figures