3093
High temporal resolution DCE-MRI improves the performance of model fitting parameters1Advanced Imaging Research Center, Oregon Health & Science University, Portland, OR, United States, 2Pathology, Oregon Health & Science University, Portland, OR, United States, 3Knight Biostatistics Shared Resources, Oregon Health & Science University, Portland, OR, United States, 4Urology, Oregon Health & Science University, Portland, OR, United States, 5Providence Health and Service, Portland, OR, United States, 6Diagnostic Radiology, Oregon Health & Science University, Portland, OR, United States, 7Portland VA Medical Center, Portland, OR, United States
Synopsis
Keywords: Data Analysis, DSC & DCE Perfusion
Recent advance in data acquisition makes fast DCE-MRI data acquisition feasible. This work investigated the impact of DCE-MRI temporal resolution on the data’s pharmacokinetic modeling and the water exchange effect imparted into the model parameters. Using both the Tofts model and the water-exchange sensitized Shutter-Speed model, our results showed that DCE data with higher temporal resolution (shorter intersample interval) is beneficial in model parameter precision and in quantifying transcytolemmal water exchange effect. The later may offer additional lesion-detection specificity in clinical prostate MRI.Introduction
Pharmacokinetic modeling of prostate dynamic contrast-enhanced MRI (DCE-MRI) often employs the Tofts model.1 The well-known finite transcytolemmal water exchange effect on prostate DCE-MRI modeling has been investigated with limited success.2-4 The goal of this work is to investigate the impact of DCE-MRI temporal resolution on the data’s pharmacokinetic modeling and the water exchange effect imparted therein. Using both the Tofts model1 and the Shutter-Speed model3,4, our results show that DCE data with higher temporal resolution (shorter intersample interval) is beneficial in model parameter precision and in quantifying transcytolemmal water exchange effect. The later may offer additional lesion-detection specificity in clinical prostate MRI.Methods
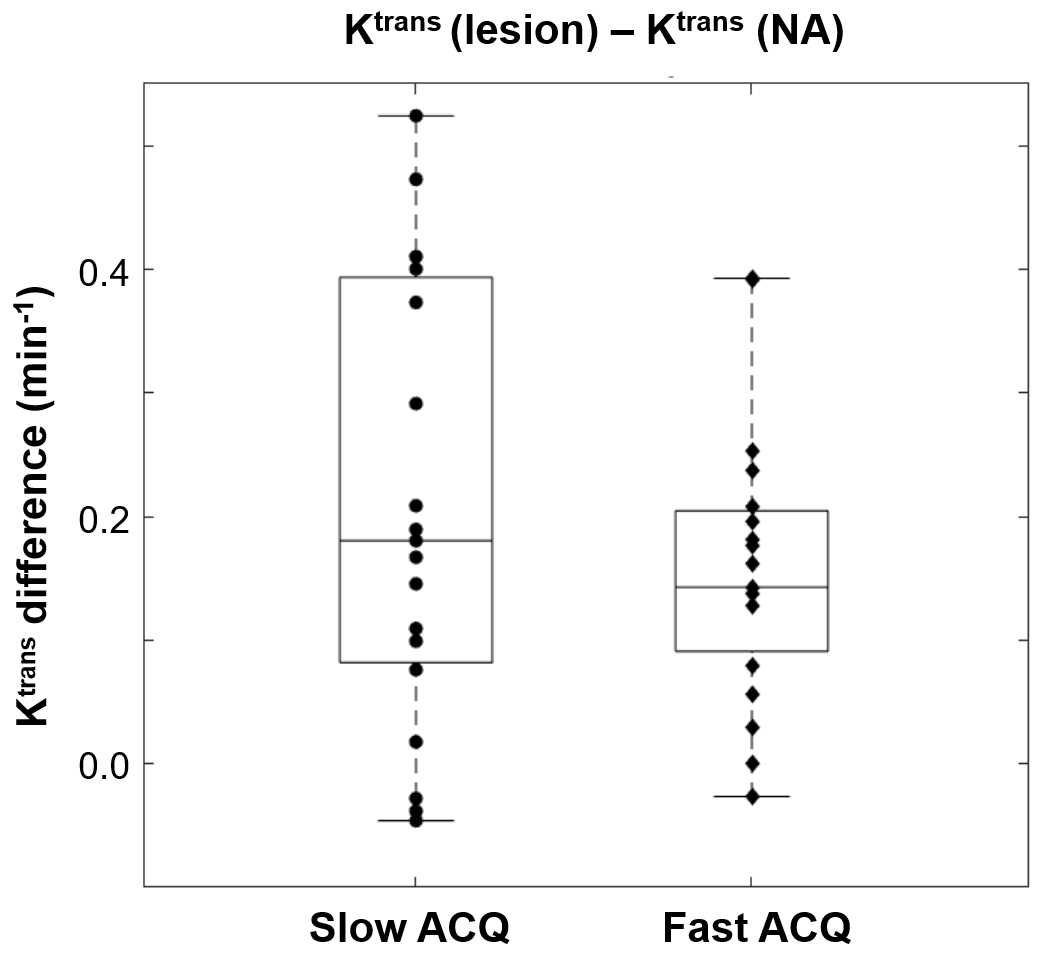
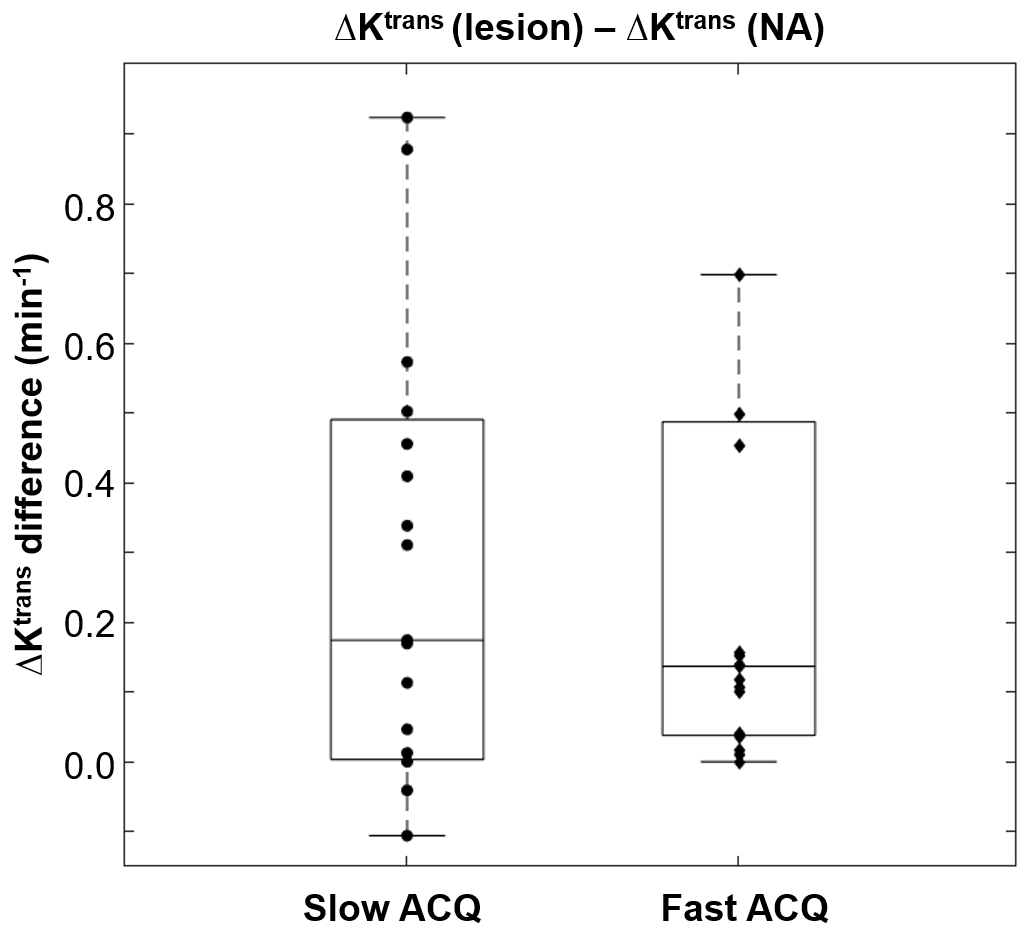
As part of two funded research projects, clinical multiparametric MRI (mpMRI) data with whole mount pathology were retrospectively analyzed after local IRB approvals. All MRI data were acquired at 3T scanners with endorectal RF coils. A standard dose of 0.1 mmol/kg gadolinium-based contrast agent (CA) was used in all DCE scans. Nineteen “slow” DCE data sets (intersample interval 8.51-12.45 s, with 12/19 at 8.67 s) from a Philips 3T scanner and 19 “fast” DCE data sets (intersample interval 4.95 - 6.33 s, with 14/19 at 4.95 s) from a Siemens 3T were included in this data analysis. Lesion and normal appearing regions of interest (ROIs) were drawn on post-CA DCE images with referencing to T2-weighted images and apparent diffusion coefficient (ADC) maps. Each DCE ROI time-course data was modeled with both the fast-exchange-limit (FXL) Tofts model1 and the fast-exchange-regime (FXR) Shutter-Speed Model (SSM).3,4 To facilitate the quantitative evaluation of temporal-resolution on prostate DCE modeling and the effect of transcytolemmal water exchange on model parameters, differences between lesion and normal appearing tissues of the parameters are calculated. For example, the FXL Ktrans difference between lesion (les) and normal-appearing (NA) tissue is simply: Ktrans (les) – Ktrans (NA). In addition, following previous published method4, the Ktrans difference between the two models { ΔKtrans = Ktrans (FXR) - Ktrans (FXL) } was calculated as an indirect approach in quantifying water exchange effect. Then, the difference of this parameter, { ΔKtrans (les) - ΔKtrans (NA)}, is summarized. Thus, the ΔKtrans approach has two differences built-in, that for Ktrans difference between the models, and the 2nd difference between lesion and NA of the derived parameter.Results
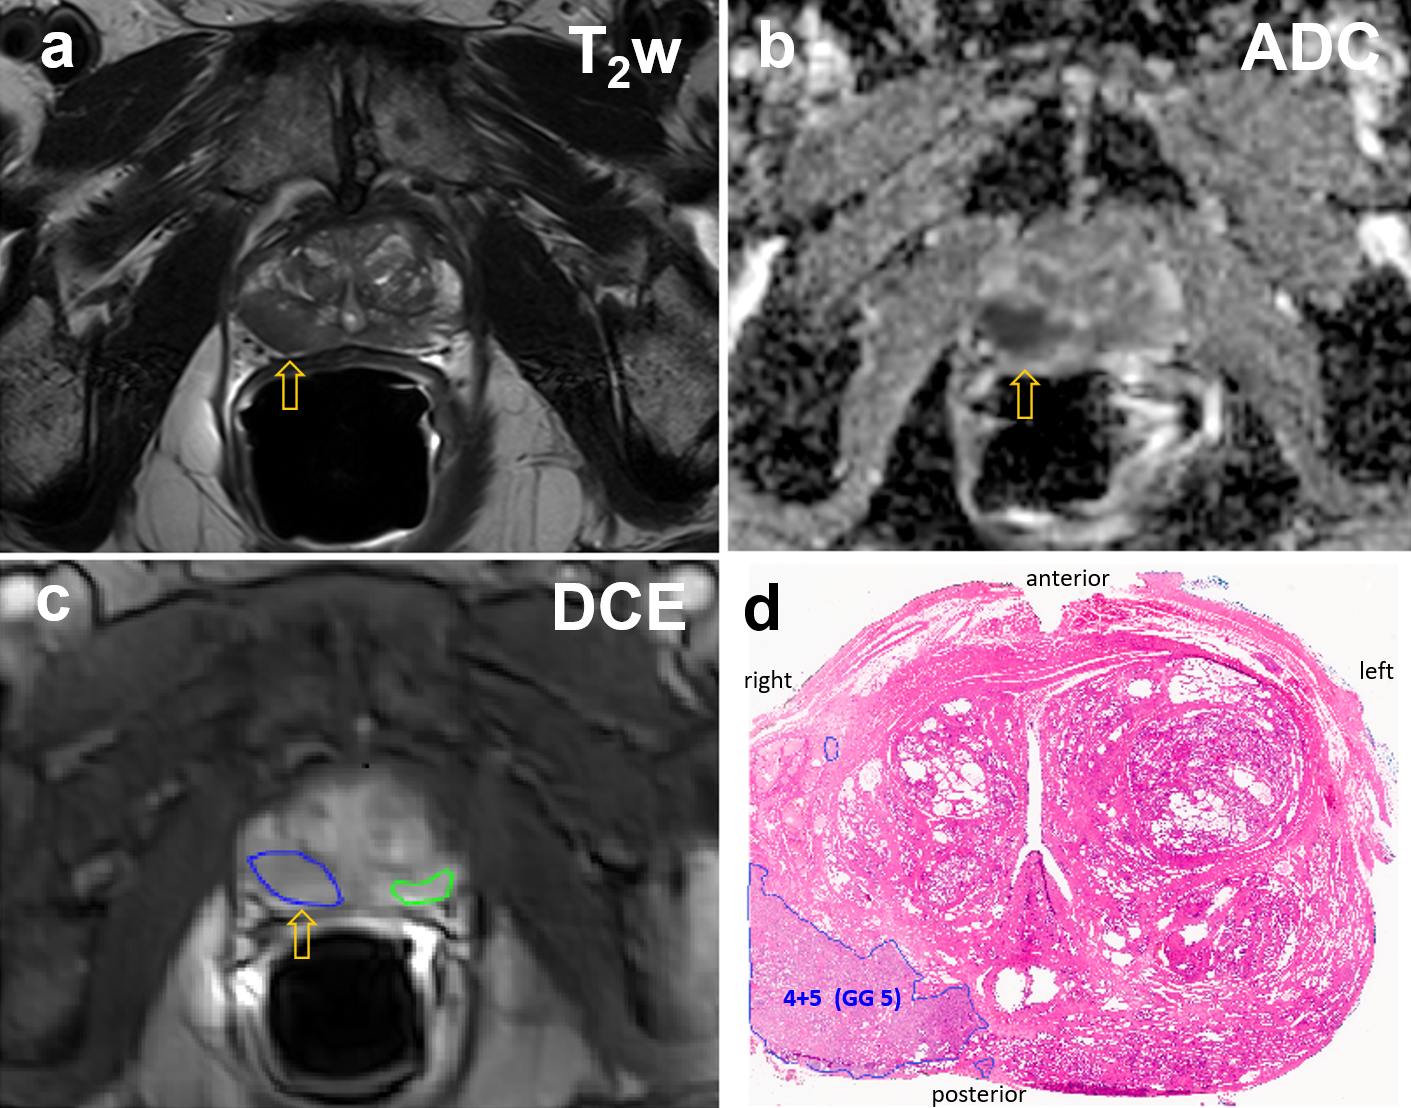
All MRI visible lesions were confirmed by the whole mount pathology slides. Figure 1 shows mpMR images and a digitized whole mount pathology slide: a, axial T2-weighted image; b, ADC map; c, post-CA DCE image with color ROIs for lesion (blue) and NA (green). The orange arrows in a) – c) indicate the MRI suspicious lesion. The digital pathology slide (d) is roughly at the same level as that of the MRI slice and the general agreement of the Gleason grade 5 (GG5) lesion to that seen on MRIs confirms the imaging findings. Figure 2 compares the Tofts model’s Ktrans difference in prostate lesion discrimination for the two groups of DCE-MRI data: slow (long intersample interval) and fast (short intersample interval) data acquisition (ACQ). The Ktrans difference between the lesion and NA ROIs { = Ktrans (les) - Ktrans (NA) } for each subject is calculated and shown (circle for slow ACQ; diamond for fast ACQ). Apart from subject cohort heterogeneity, the slow ACQ showed a much larger range of Ktrans difference than that of fast ACQ. Figure 3 shows the box and whisker plot similar to that of Fig. 2, but for the ΔKtrans difference between lesion and NA, { = ΔKtrans (les) - ΔKtrans (NA)}. Again, apart from the subject cohort difference, more ΔKtrans difference data points for slow ACQ are closer to zero with a few being negative. Using a ΔKtrans of 0.03 min-1 as an example for cutoff, 6 out of 19 data points fell below the threshold for the slow ACQ group, while the number for fast ACQ is 4 out of 19. In addition, there is no negative ΔKtrans difference for the fast ACQ group.Discussion
In this work, the implication of DCE-MRI temporal resolution on model parameters are investigated. Apart from subject cohort difference, results here show that fast ACQ inherently improves the temporal alignment of the time-courses between the arterial input function and the tissue. This results in greatly reduced variance in Ktrans difference (Fig.2). It is generally observed that cancerous tissues are leakier than the normal-appearing counterpart. This implies more prominent water exchange effect is expected to impart into lesion DCE-MRI. Slow ACQ will also diminish this effect expressed in ΔKtrans difference (Fig. 3). Manifested in ΔKtrans for more appreciable water exchange effect, a greater number of ΔKtrans difference data points were above a threshold and no negative value resulted from the fast ACQ group. These mostly likely imply fast ACQ reduces Ktrans variance and also results in a more realistic reflection of increased water exchange effect seen in malignant tissue. Findings from this work are expected to increase the lesion detection specificity in DCE-MRI. Combining this and more readily available fast DCE sequences like the golden-angle radial sparse parallel MRI5 in clinical settings, the relevance of DCE-MRI in prostate mpMRI is expected to improve at fast ACQ. Generally reduced signal-to-noise ratio has to be considered when designing fast ACQ.Acknowledgements
Grant Support:
Collins Medical Trust (RK).
Department of the Army, DOD Prostate Cancer Research Program (RK).
Oregon Clinical and Translational Research Institute, NIH/NCATS (XL).
References
1. Tofts, Brix, Buckley, Evelhoch, Henderson, Knopp, Larsson, Lee, Mayr, Parker, Port, Taylor, Weisskoff. J. Magn. Reson. Imaging. 10:223–232 (1999).
2. Lowry, Zelhof, Liney, Gibbs, Pickles, Turnbull. Invest Radiol. 44:577-84. (2009).
3. Hectors, Besa, Wagner, Jajamovich, Haines, Lewis, Tewari, Rastinehad, Huang, Taouli. J Magn Reson Imaging. 46:837-849 (2017).
4. Li, Priest, Woodward, Tagge, Siddiqui, Huang, Rooney, Beer, Garzotto, Springer. Magn. Reson. Med. 69:171-178 (2013).
5. Feng, Grimm, Block, Chandarana, Kim, Xu, Axel, Sodickson, Otazo. Magn Reson Med. 72:707-17 (2014).
Figures