3091
Tracking the moving stomach using MRI and neural ordinary differential equations1Biomedical Engineering, University of Michgan, Ann Arbor, MI, United States, 2University of Michigan, Ann Arbor, MI, United States
Synopsis
Keywords: Data Analysis, Data Analysis, Neural Network
We describe a method, namely neural ordinary differential equations, to track the movement of the stomach based on dynamic and contrast-enhanced gastrointestinal MRI. This model uses a neural network to learn the continuous biomechanical process that drives the shape change of the stomach wall over the course of digestion. This method allows us to represent gastric motor events on a generic surface template of the stomach and to further reveal the pattern of gastric motility with higher specificity and resolution than are previously attainable in vivo. This method should be also applicable to other organs, such as the heart.Purpose
With oral contrast agents, MRI can visualize how food is stored and moves along the gastrointestinal (GI) tract. Although food movement and transit are useful measures of digestion, they do not report directly on the structure and dynamics of gastric muscles in the stomach wall. To close this gap, we report a method to model the stomach wall and deduce gastric muscle activity from MRI images of the food inside the stomach. Uniquely, we implement a novel model based on neural ordinary differential equations (ODE) to compute the deformation, contraction, and relaxation of the stomach surface as a continuous biomechanically plausible process.Methods
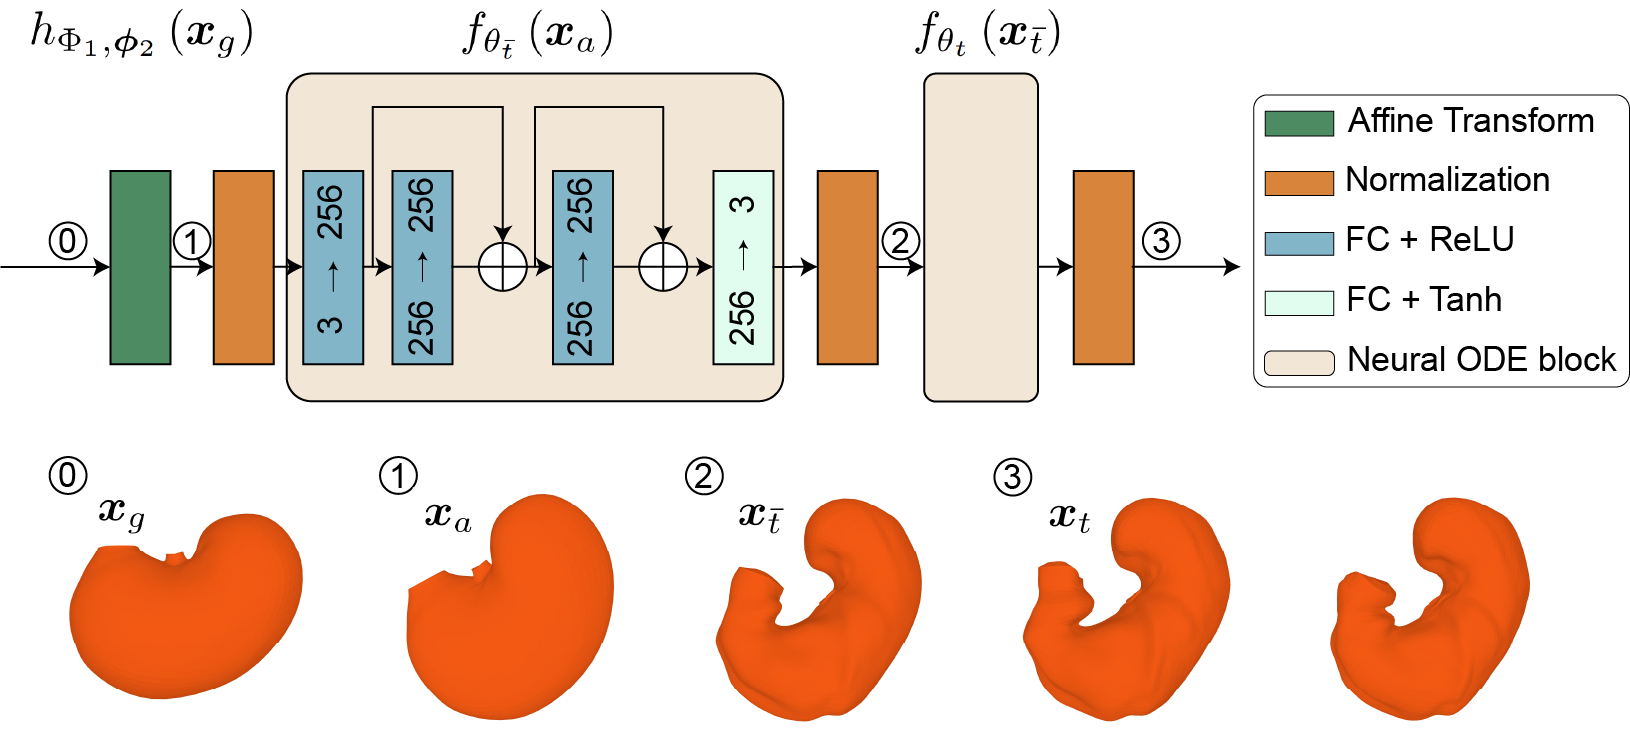
To track the surface of a moving stomach, we model its deformation as driven by a continuous and invertible diffeomorphic flow inspired by the underlying biomechanics. If a source surface $$$\mathbf{X}(t_0)$$$ at $$$t_0$$$ deforms itself to be a target surface $$$\mathbf{X}(t_1)$$$ at $$$t_1$$$, the morphing is modeled as $$\mathbf{X}(t_1) = \mathcal{M}_\theta(\mathbf{X}(t_0),t_0,t_1)= \mathbf{X}(t_0) + \int_{t_0}^{t_1} f_\theta(\mathbf{X}(t)) dt$$ where $$$\mathcal{M}_\theta$$$ defines the mapping from $$$t_0$$$ to $$$t_1$$$, and $$$f_\theta$$$ models the first order derivative of $$$\mathbf{X}(t)$$$. This diffeomorphic flow can be modeled by a neural ODE[1,2].In our implementation, we progressively deform the surface as illustrated in Fig. 1. A generic stomach surface is used as the starting point, which is deformed to match a target iso-surface surrounding the stomach as observed with MRI. The generic stomach surface is approximated with a mesh based on a generic scaffold of the rat stomach[3]. The target iso-surface is extracted from a time-averaged stomach volume to capture the anatomy, or a dynamic stomach volume segmented from MRI images to capture the motility. During morphing, we keep the defined connectivity between vertices and only update their coordinates. The morphing consists of three stages: 1) an initial affine transformation globally transforms the generic surface, 2) a Neural ODE for finer adjustments captures the time-averaged geometry of individuals, 3) a second Neural ODE generates dynamic surfaces for capturing the temporally evolving features of the surface. The model parameters are optimized at each stage separately to minimize the chamfer distance between the source and target as well as penalize the edge length. The chamfer distance is defined as $$$L_c$$$:
$$L_c(\mathbf{X}, \mathbf{Y}) = \frac{1}{N}\sum_{\mathbf{x}^{i}\in \mathbf{X}}\min_{\mathbf{y}\in \mathbf{Y}} \parallel \mathbf{x}^{i}\!-\!\mathbf{y} \parallel_{2}^{2} + \frac{1}{M}\sum_{\mathbf{y}^{i}\in \mathbf{Y}}\min_{\mathbf{x}\in \mathbf{X}} \parallel \mathbf{x}-\mathbf{y}^{i} \parallel_{2}^{2}$$
where $$$\mathbf{X}$$$ is the source surface with $$$\mathbf{x}$$$ as a vertex on $$$\mathbf{X}$$$and $$$N$$$ as the total amount of $$$\mathbf{x}$$$, and $$$\mathbf{Y}$$$ is the target surface with $$$\mathbf{y}$$$ as a vertex on $$$\mathbf{Y}$$$ and $$$M$$$ as the total number of $$$\mathbf{y}$$$. The displacements of all vertices of the mesh can be further derived, providing location-specific temporally evolving features of gastric motor events.
Results
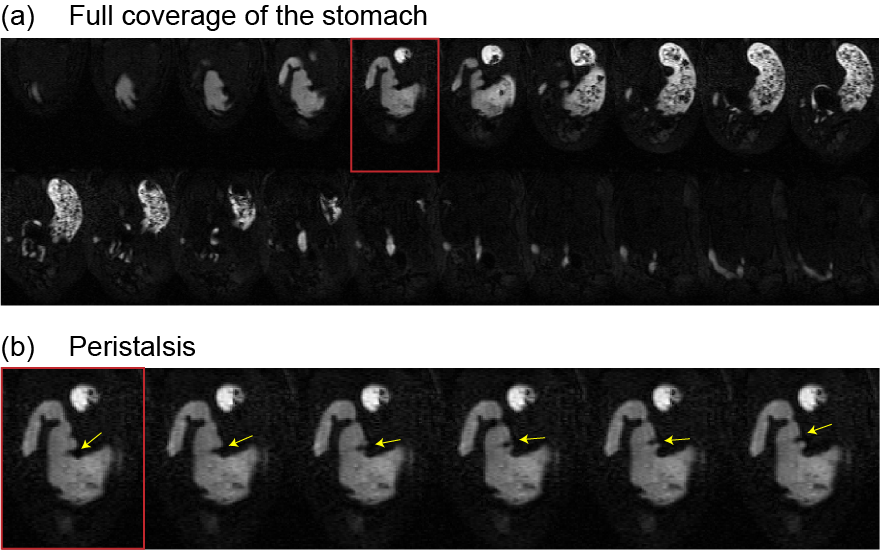
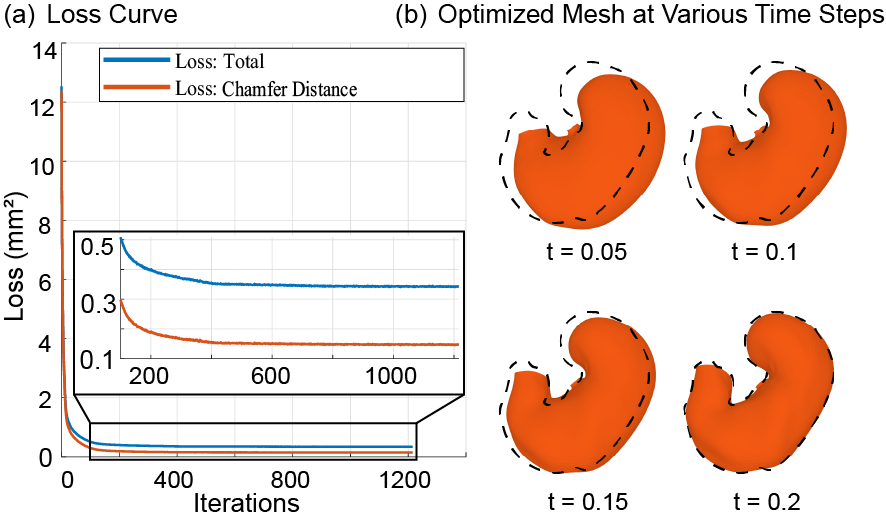
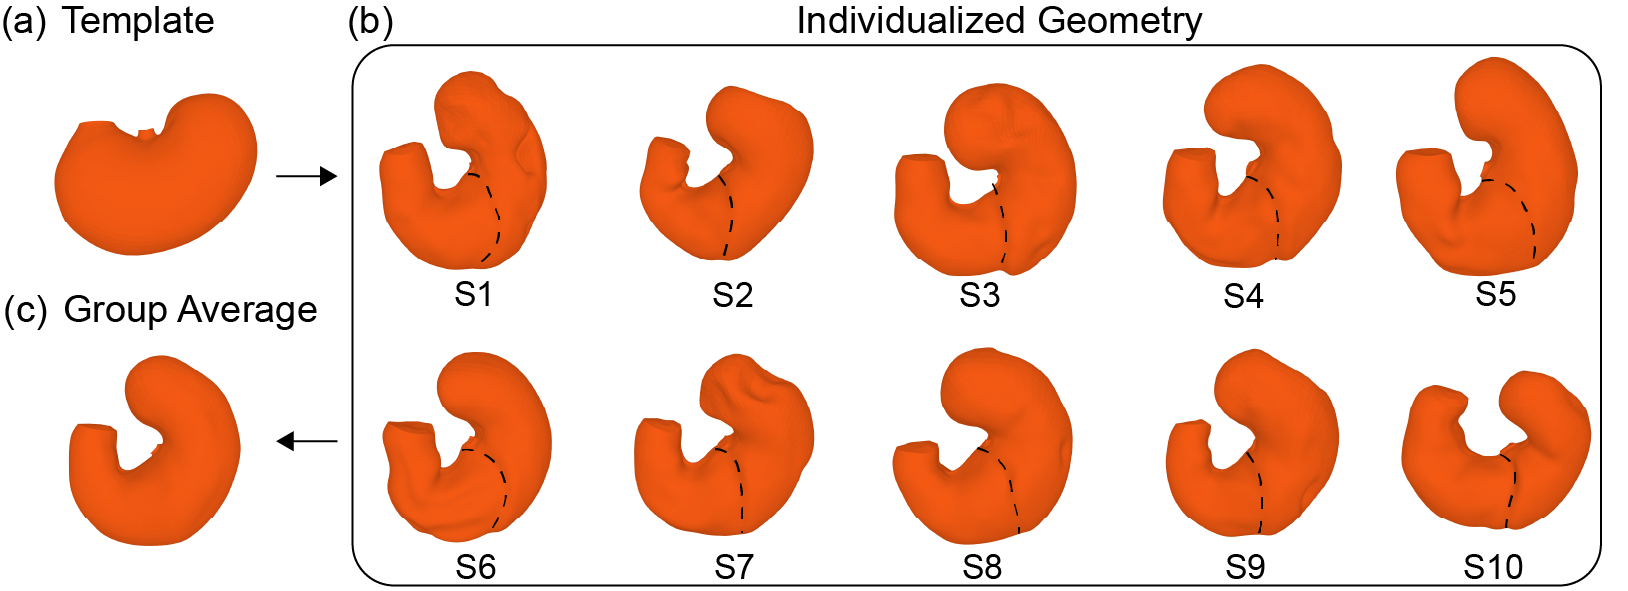
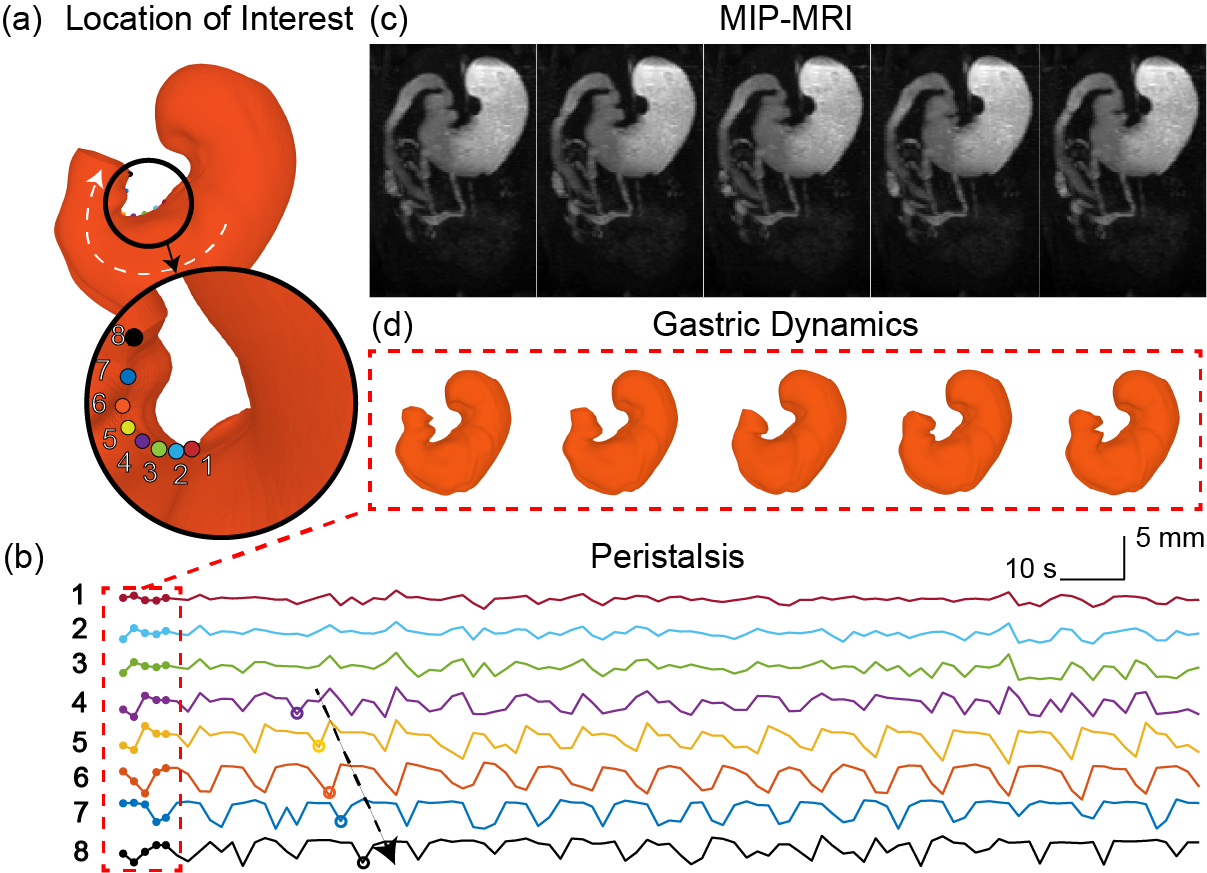
The method is applied to GI MRI data acquired from ten Sprague-Dawley rats using the protocol established elsewhere[4]. Fig. 2.a shows representative MRI images with 20 slices. They are sampled every 2 to 3 s to capture the dynamic propagation of contractions (Fig 2.b). Iterative optimization of the neural ODE models always leads to convergence (Fig. 3.a). After the optimization, the model progressively transforms every point on the surface to match the target iso-surface derived from MRI, as illustrated in Fig.3.b. To quantify the modeling accuracy and the manifoldness of the deformed surface, we evaluate the chamfer distance and the number of self-intersections between faces as 0.127 ± 0.020 mm and 0.028% ± 0.170%, respectively. These values suggest that the neural ODE can effectively track the changing shape of the stomach surface, while keeping the surface smooth and thus biologically plausible. The proposed method generates time-averaged and dynamic stomach surfaces. Fig. 4.b shows ten surfaces representing the time-averaged shapes for all ten rats studied. They capture the overall geometry of the stomach as an oblique U-shape, as shown in Fig. 4.a. An important feature of gastric geometry, the limiting ridge (black dashed lines), is also well delineated by the approach. In addition, the estimated dynamic surfaces provide rich spatiotemporal information about gastric motility. As shown in Fig. 5.c and d, dynamic MRI data and the surfaces of the moving stomach matched well with each other. In a representative rat, eight locations chosen along the lesser curvature (Fig. 5.a) exhibit various motor events in the time series of their movement (Fig. 5.b). Stronger contractions are observed at the antrum compared with the corpus. The propagation of contraction is also observed in the antrum but not or less so in the corpus. The frequency and velocity of the contractile wave are 6.105 ± 0.741 cycles per minute, and 0.645 ± 0.129 mm/s, respectively.Conclusion
In this study, we propose a new approach to characterize gastric anatomy and motility through surface-based morphological analyses of gastrointestinal MR images in rats, as opposed to the traditional volumetric analysis. This approach will advance the understanding of how the stomach organizes its motor events on its surface to facilitate ingestion and digestion. In addition, the applied neural ODE models a biomechanically plausible deformation, which could be potentially used in other organs, such as the intestines and heart.Acknowledgements
This work is supported by NIH OD030538.References
[1] Chen, Ricky TQ, Yulia Rubanova, Jesse Bettencourt, and David K. Duvenaud. "Neural ordinary differential equations." Advances in neural information processing systems 31 (2018).
[2] Gupta, Kunal. Neural mesh flow: 3d manifold mesh generation via diffeomorphic flows. University of California, San Diego, 2020.
[3] Lin, Mabelle, Richard Christie, and Peter Hunter. “Generic Rat Stomach Scaffold.” SPARC Consortium, 2022. https://doi.org/10.26275/IEFX-C2QI.
[4] Wang, X., J. Cao, U. Scheven, and Z. Liu. "Accelerated contrast-enhanced gastrointestinal MRI captures whole-stomach motor events in rats." In Neurogastroenterology and Motility, vol. 33. 111 River ST, Hoboken 07030-5774, NJ USA: Wiley, 2021.
Figures