3074
Reliable blood-brain barrier water exchange estimates in the rat brain using a crusher-compensated exchange rate (CCXR) model1Division of Psychology, Communication and Human Neuroscience, University of Manchester, Manchester, United Kingdom, 2Geoffrey Jefferson Brain Research Centre, University of Manchester, Manchester, United Kingdom, 3UCL, London, United Kingdom, 4Danish Research Centre for Magnetic Resonance, Copenhagen, Denmark, 5Random Walk Imaging, Åkarp, Sweden, 6Bioxydyn Limited, Manchester, United Kingdom, 7Division of Informatics, University of Manchester, Manchester, United Kingdom
Synopsis
Keywords: Data Processing, Permeability
Filter exchange imaging (FEXI) is a promising technique for measuring water exchange across the blood-brain barrier (BBB). However, the application of FEXI for the rodent brain requires thinner slices and therefore higher crusher gradients which lead to a progressive underestimation of the apparent exchange rate (AXR). Here, we implement a crusher-compensated exchange rate (CCXR) model which reduces the bias induced by the crusher gradients and allows more accurate estimates of BBB water exchange in the rat brain.INTRODUCTION
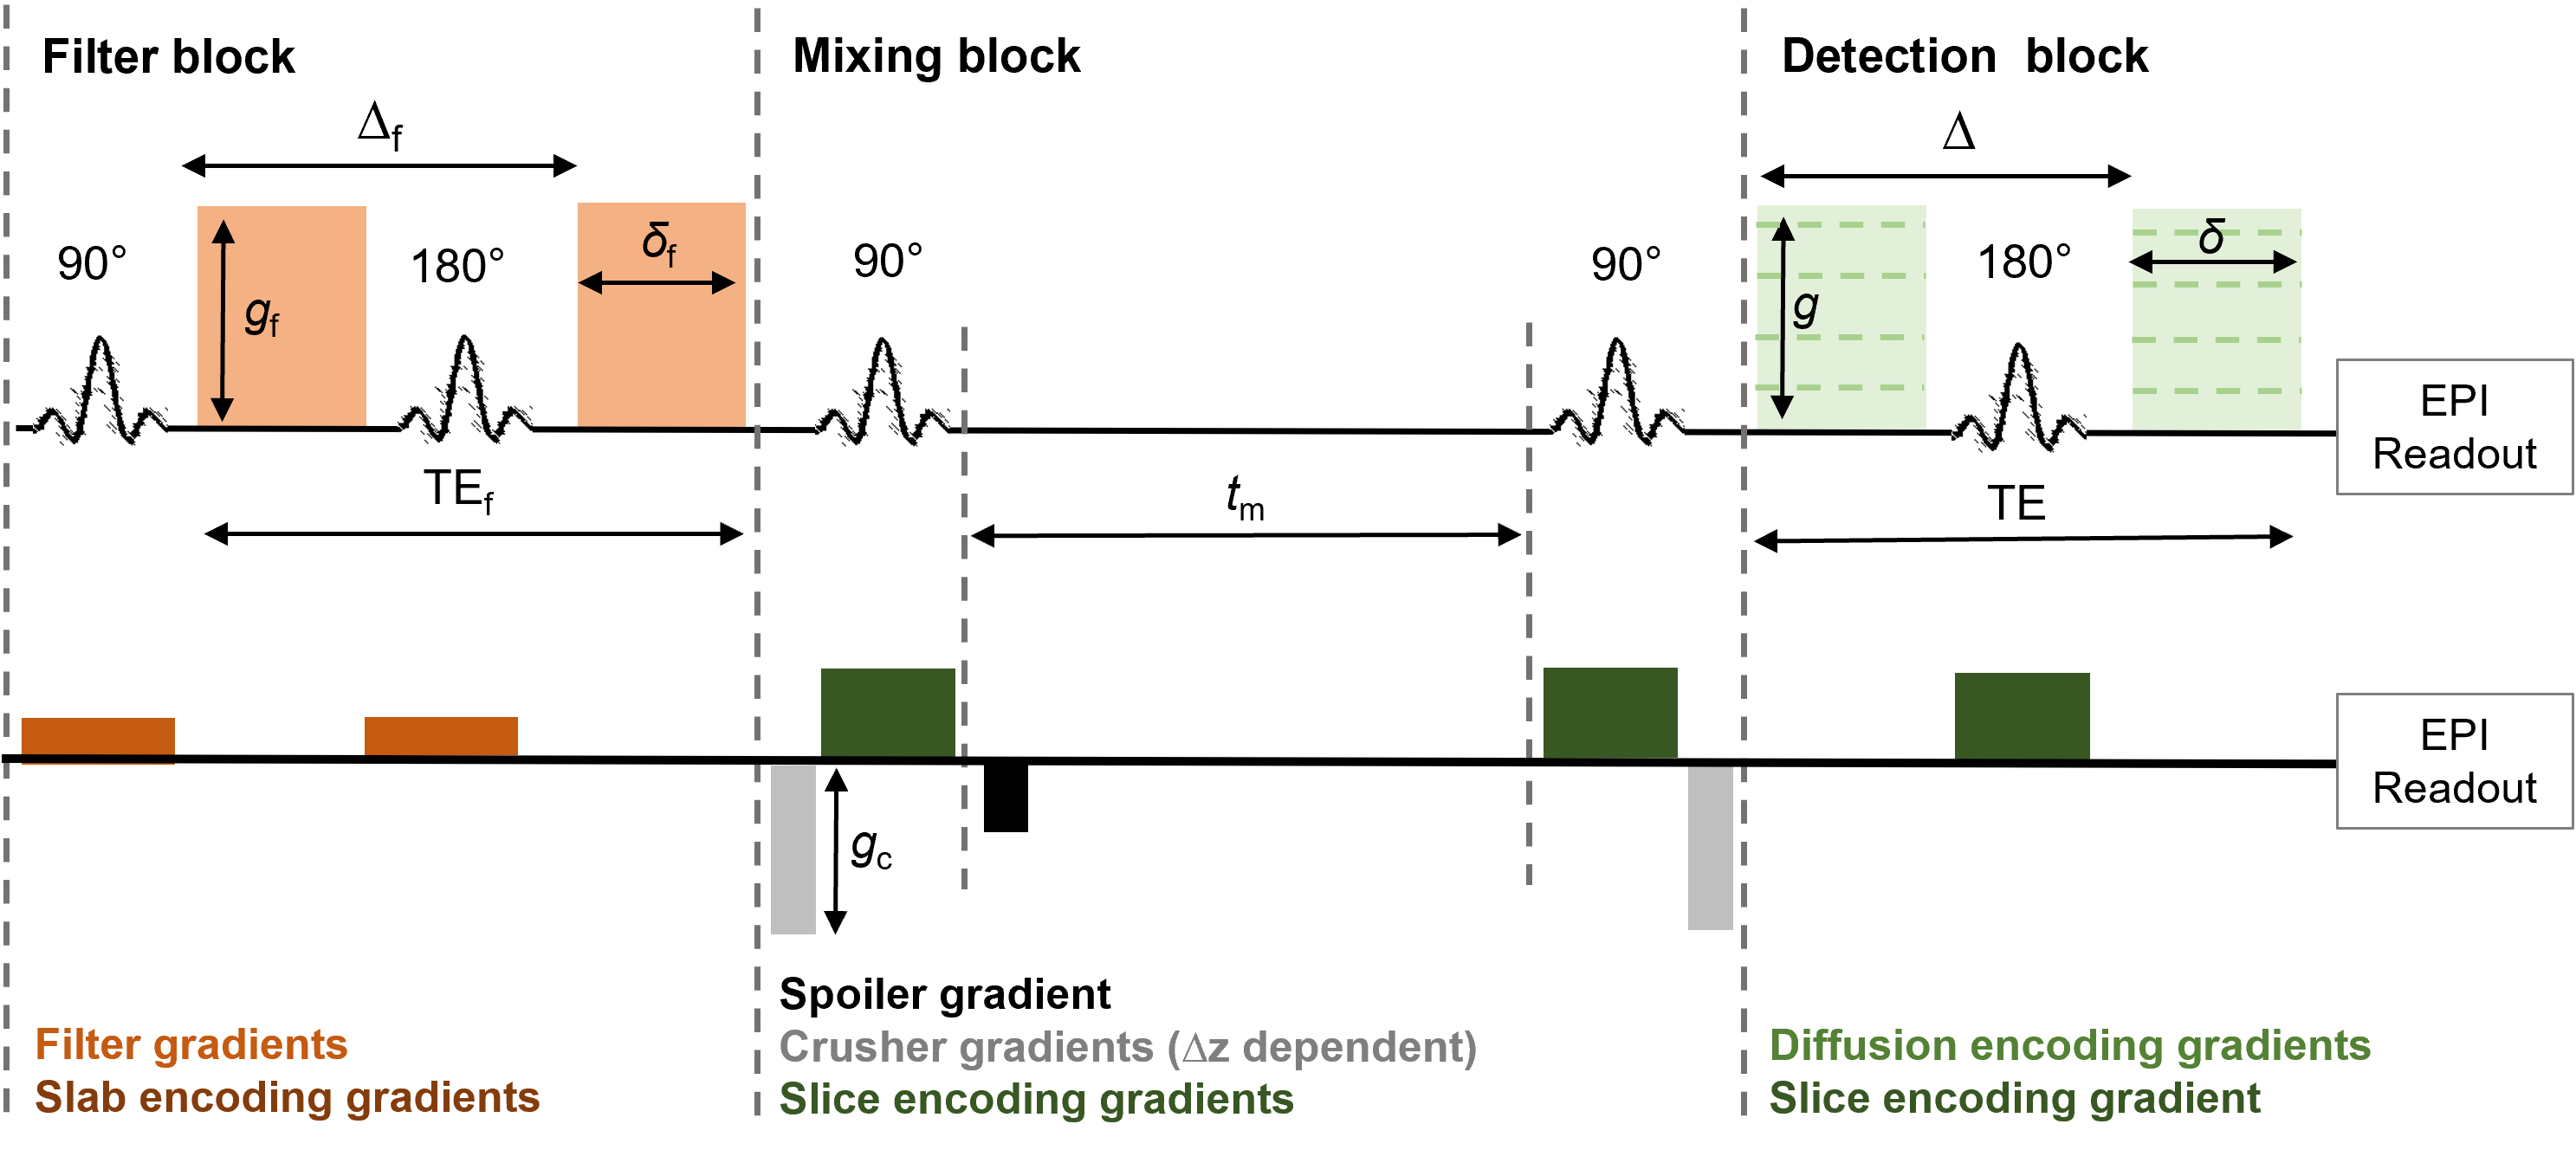
Filter exchange imaging (FEXI) is a promising technique to measure water exchange across the blood-brain barrier (BBB; termed BBB-FEXI) in the human brain [1, 2]. The implementation of BBB-FEXI in the rodent brain would permit controlled studies of disease using transgenic models. However, the markedly smaller rodent brain requires thinner imaging slices. The minimum required magnitude of the crusher gradients in the FEXI sequence increases for thinner slices (Figure 1). Previously, Lasič et al. demonstrated that high crusher gradient magnitudes cause an underestimation of the apparent exchange rate (AXR) [3]. These effects are exacerbated when using low filter b-values and biases are greater for low BBB exchange rates. Therefore, there is a need to explore extended signal models which are able to compensate for the effects of the crusher gradients, facilitating the use of thinner imaging slices needed for accurate BBB water exchange estimates in the rodent brain.METHODS
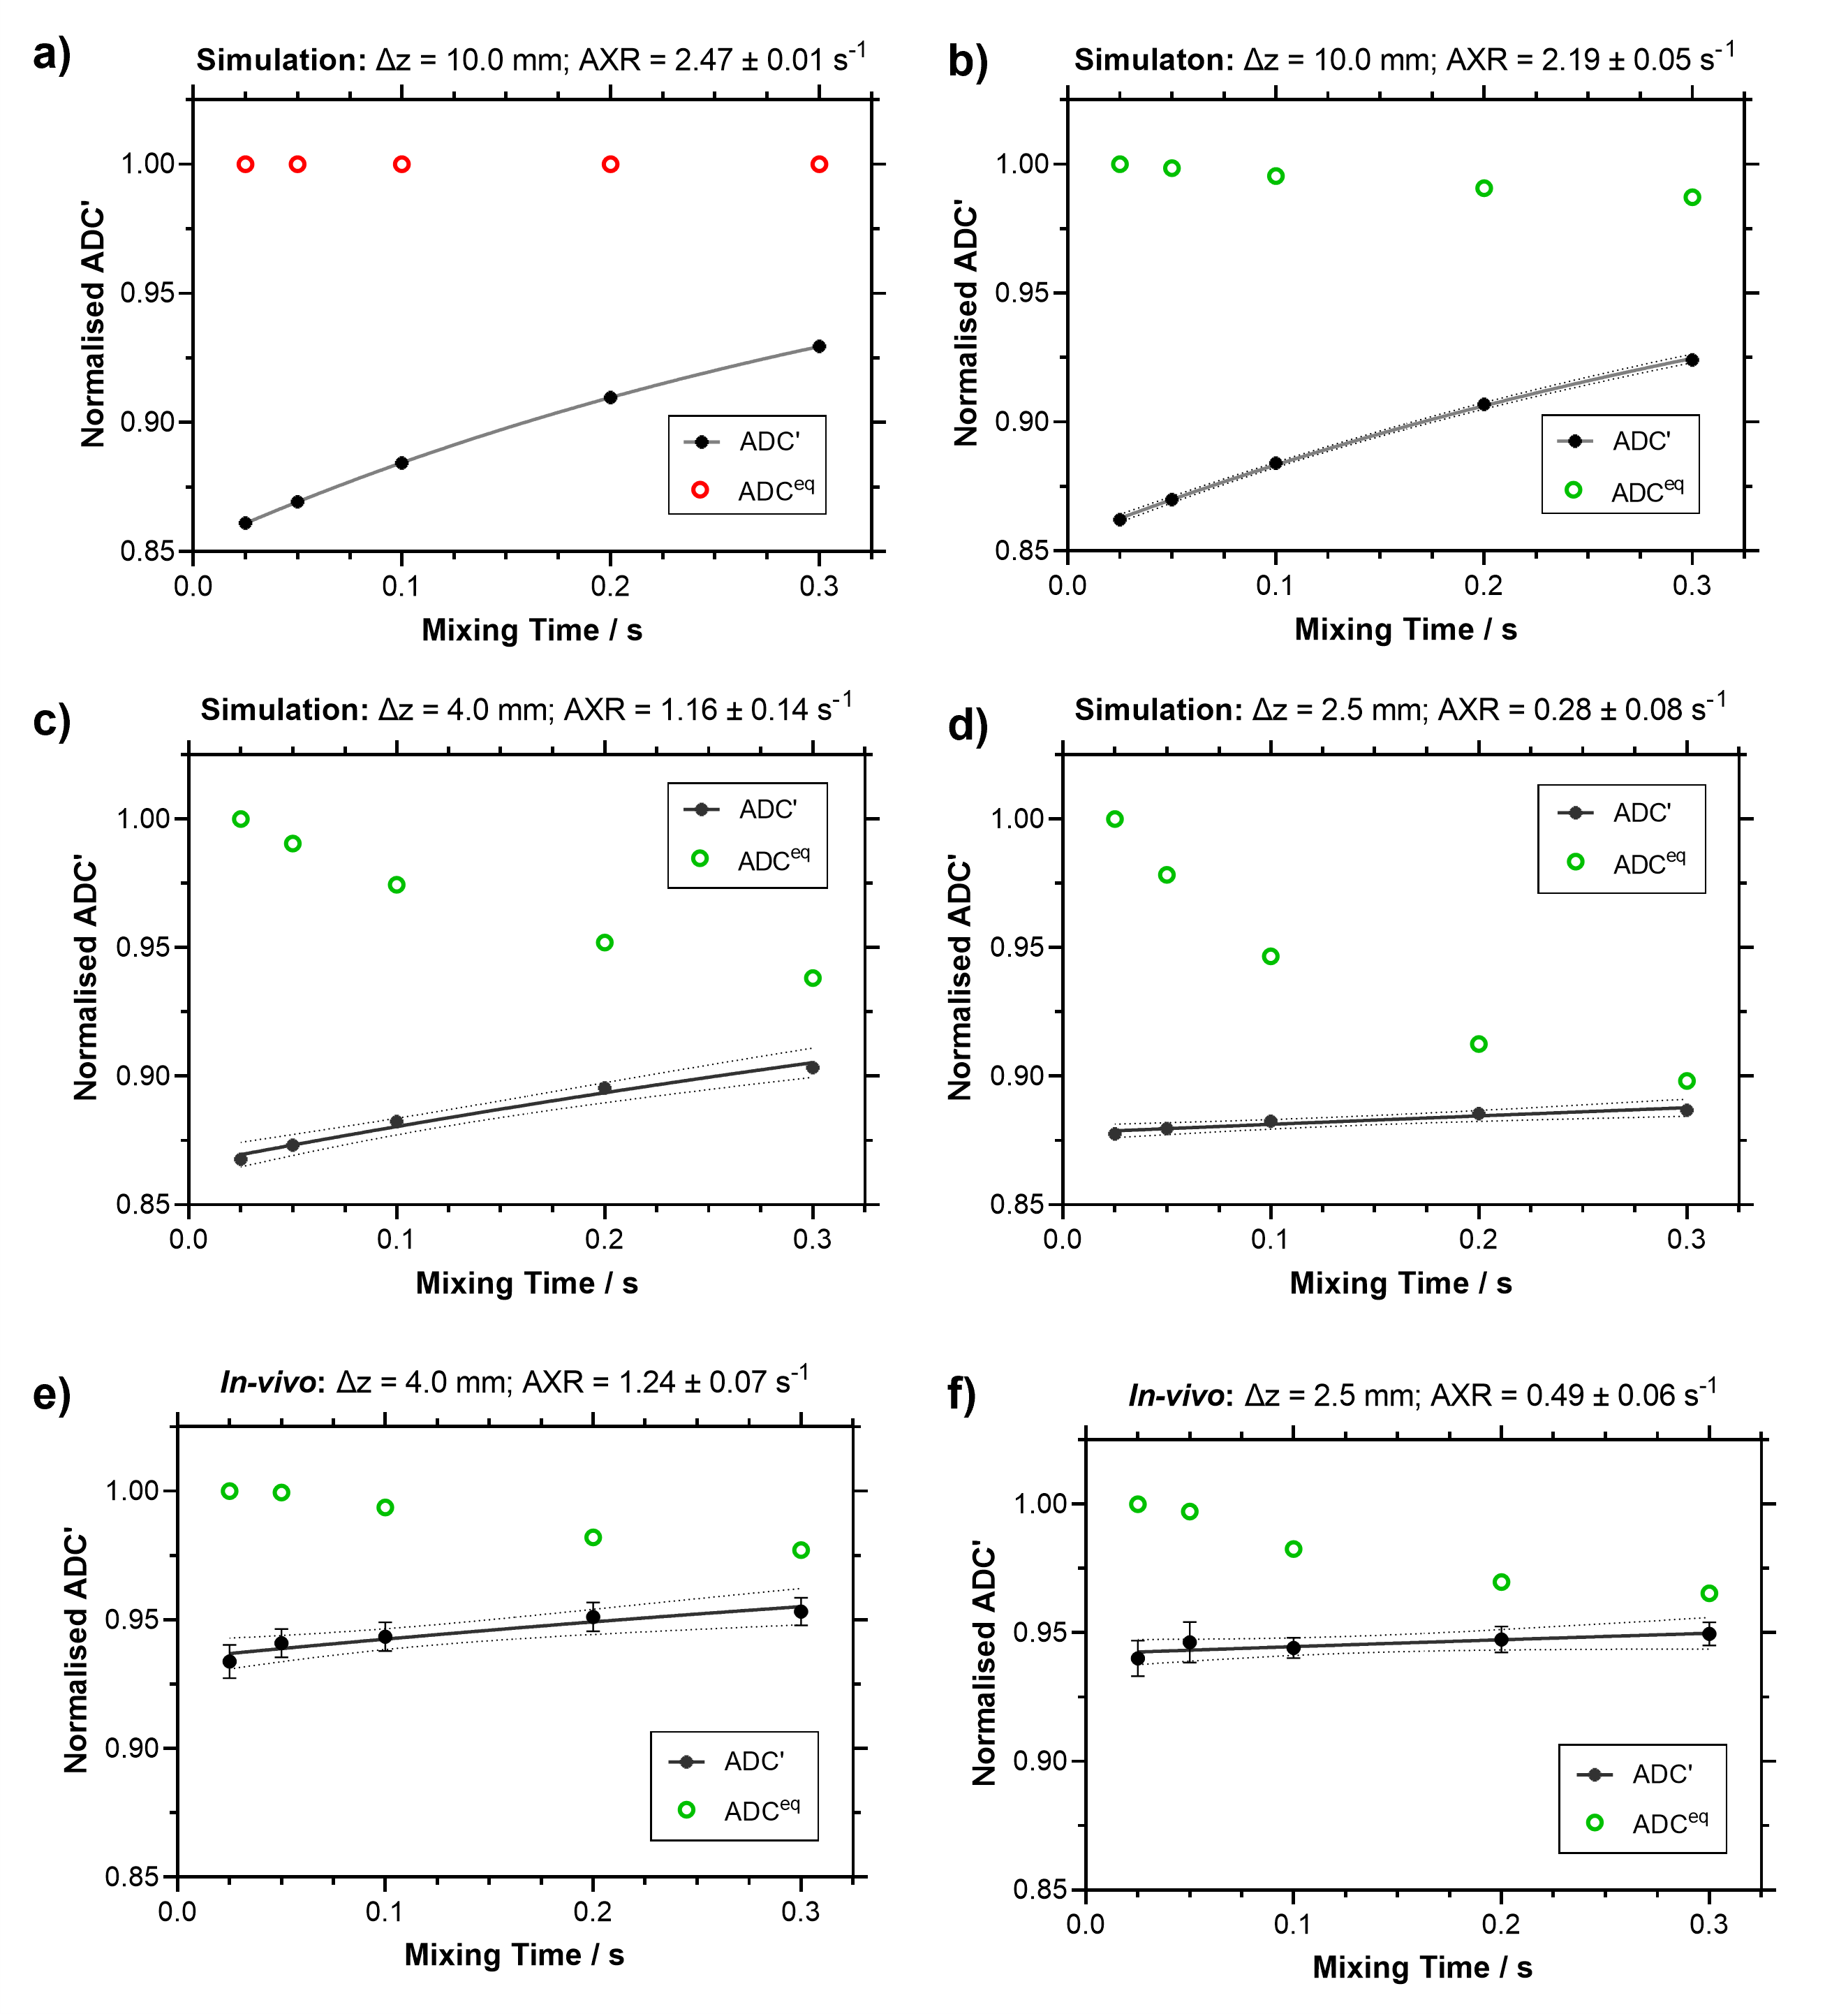
SimulationsTo investigate the impact of crusher gradients on ADC'(tm) and ADCeq(tm) at three slice thicknesses ∆z = 2.5, 4.0 and 10.0 mm, synthetic signals incorporating the effects of crusher gradients were generated in Matlab R2021a using a two-compartment model [3]. Input parameters: water exchange rate, kin = 2.38 s-1, k = kin + kout = AXR = 2.5 s-1 [4], intravascular volume fraction fi = 0.05, intravascular and extravascular diffusivities, Di = 6.5 x 10⁻³ mm2/s and De = 0.65 x 10⁻³ mm2/s respectively [5]. Signals were simulated with the filter block switched on and switched off (bf = 250 and 0 s/mm2 respectively) at mixing times, tm = 0.025, 0.05, 0.1, 0.2 and 0.3 s. The detection block was simulated with eight readout b-values, b = 0, 25, 54, 116, 250, 539, 1160, 2500 s/mm2.
In vivo acquisition & analysis
To confirm simulated effects in vivo at ∆z = 2.5 mm and 4.0 mm, male F334 rats (n = 5) were scanned with a Bruker Avance III console interfaced with an Agilent 7T 16-cm bore magnet using the BBB-FEXI sequence. Imaging parameters were matched to simulations for bf, tm and b = 0, 250 s/mm2; TR = 5000 s; matrix size = 64 x 64; FOV = 32 x 32 mm2; single slice; repetitions = 10, with a spin-echo EPI readout. The signals were evaluated in Matlab R2021a using the standard AXR model [6, 7] and the full signal model [3], which accounts for effects of the crusher gradients, here coined the crusher-compensated exchange rate (CCXR) model: S = S'(tm) exp(-((qd2D + K)td)) x exp(-((qm2D + K)tm)) x exp(-((qf2D + K)tf)) f,
where qf, qm and qd are the dephasing parameters associated with the filter block (f), mixing block (m) which incorporates the effect crusher gradients and detection block (d) (see Figure 1), D, K and f are matrices with intra-/extravascular diffusivities, forward/ backward exchange rates (kin / kout) and intra-/extra signal fraction respectively.
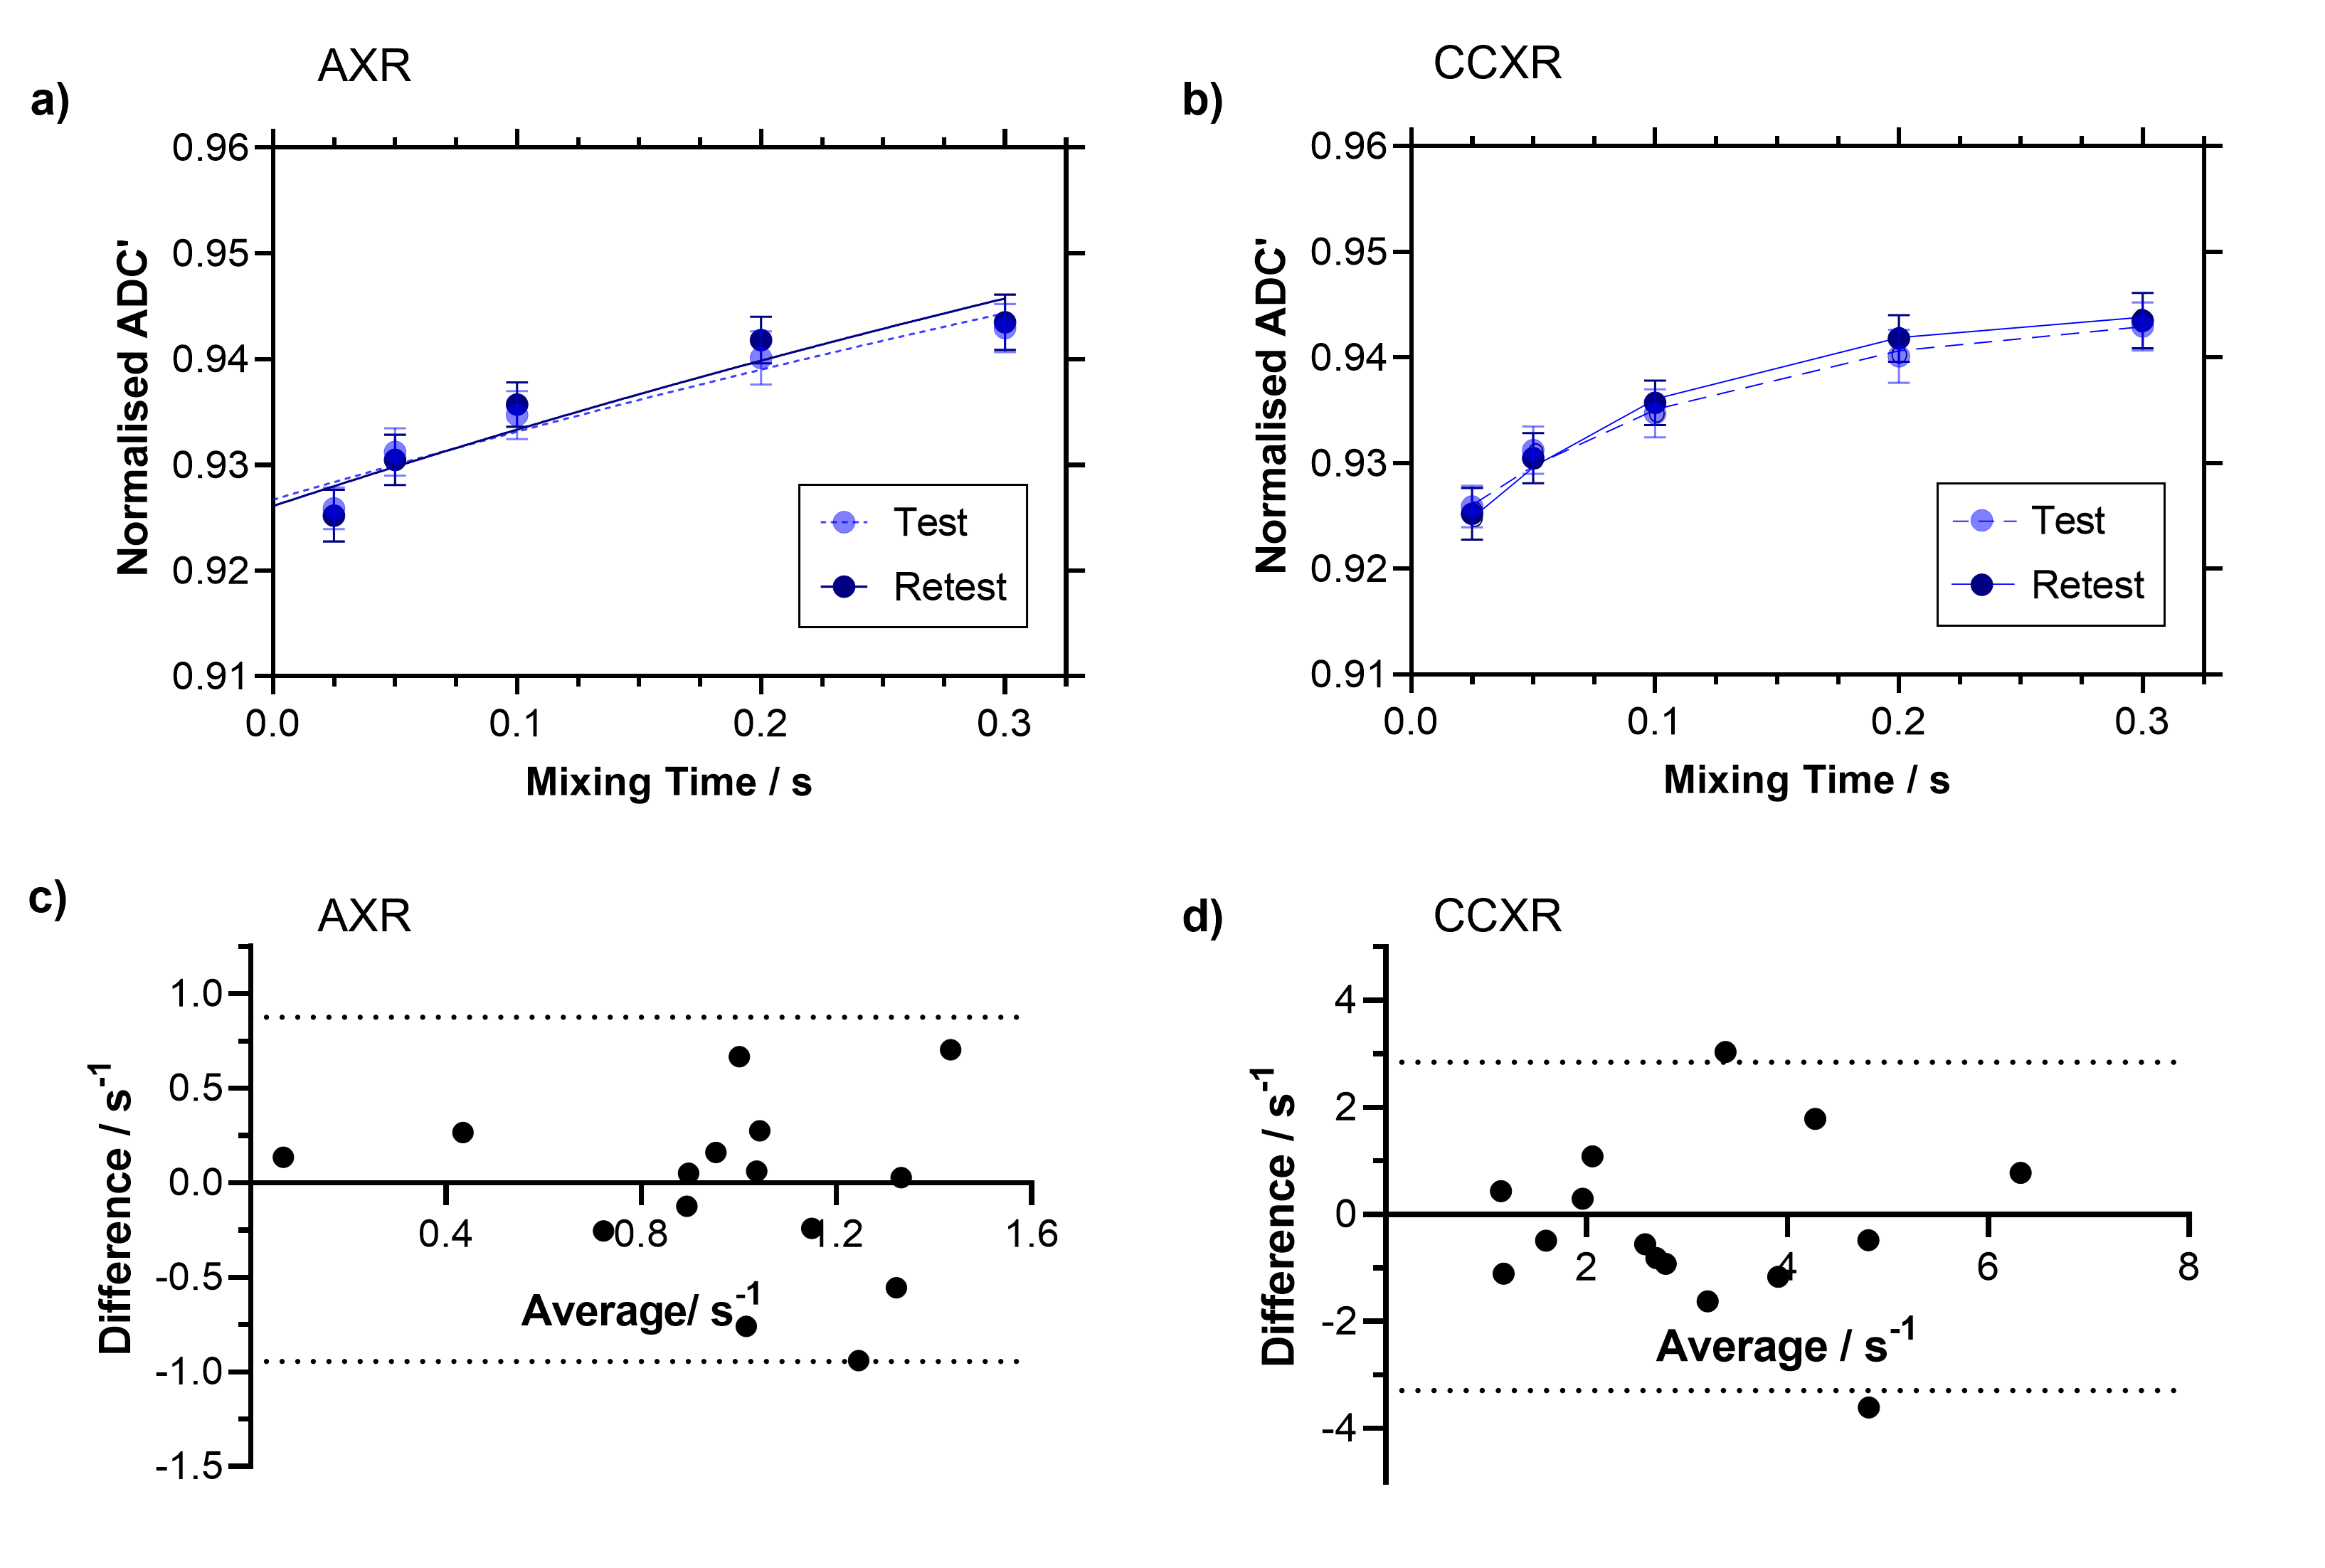
The intrasession repeatability was evaluated in F334 rats (n = 15) for both AXR and CCXR models at ∆z = 4 mm. The first five repetitions were used for test and the second five repetitions for retest. The coefficient of variation (CoV) is given by sw/ µ x 100%.
RESULTS
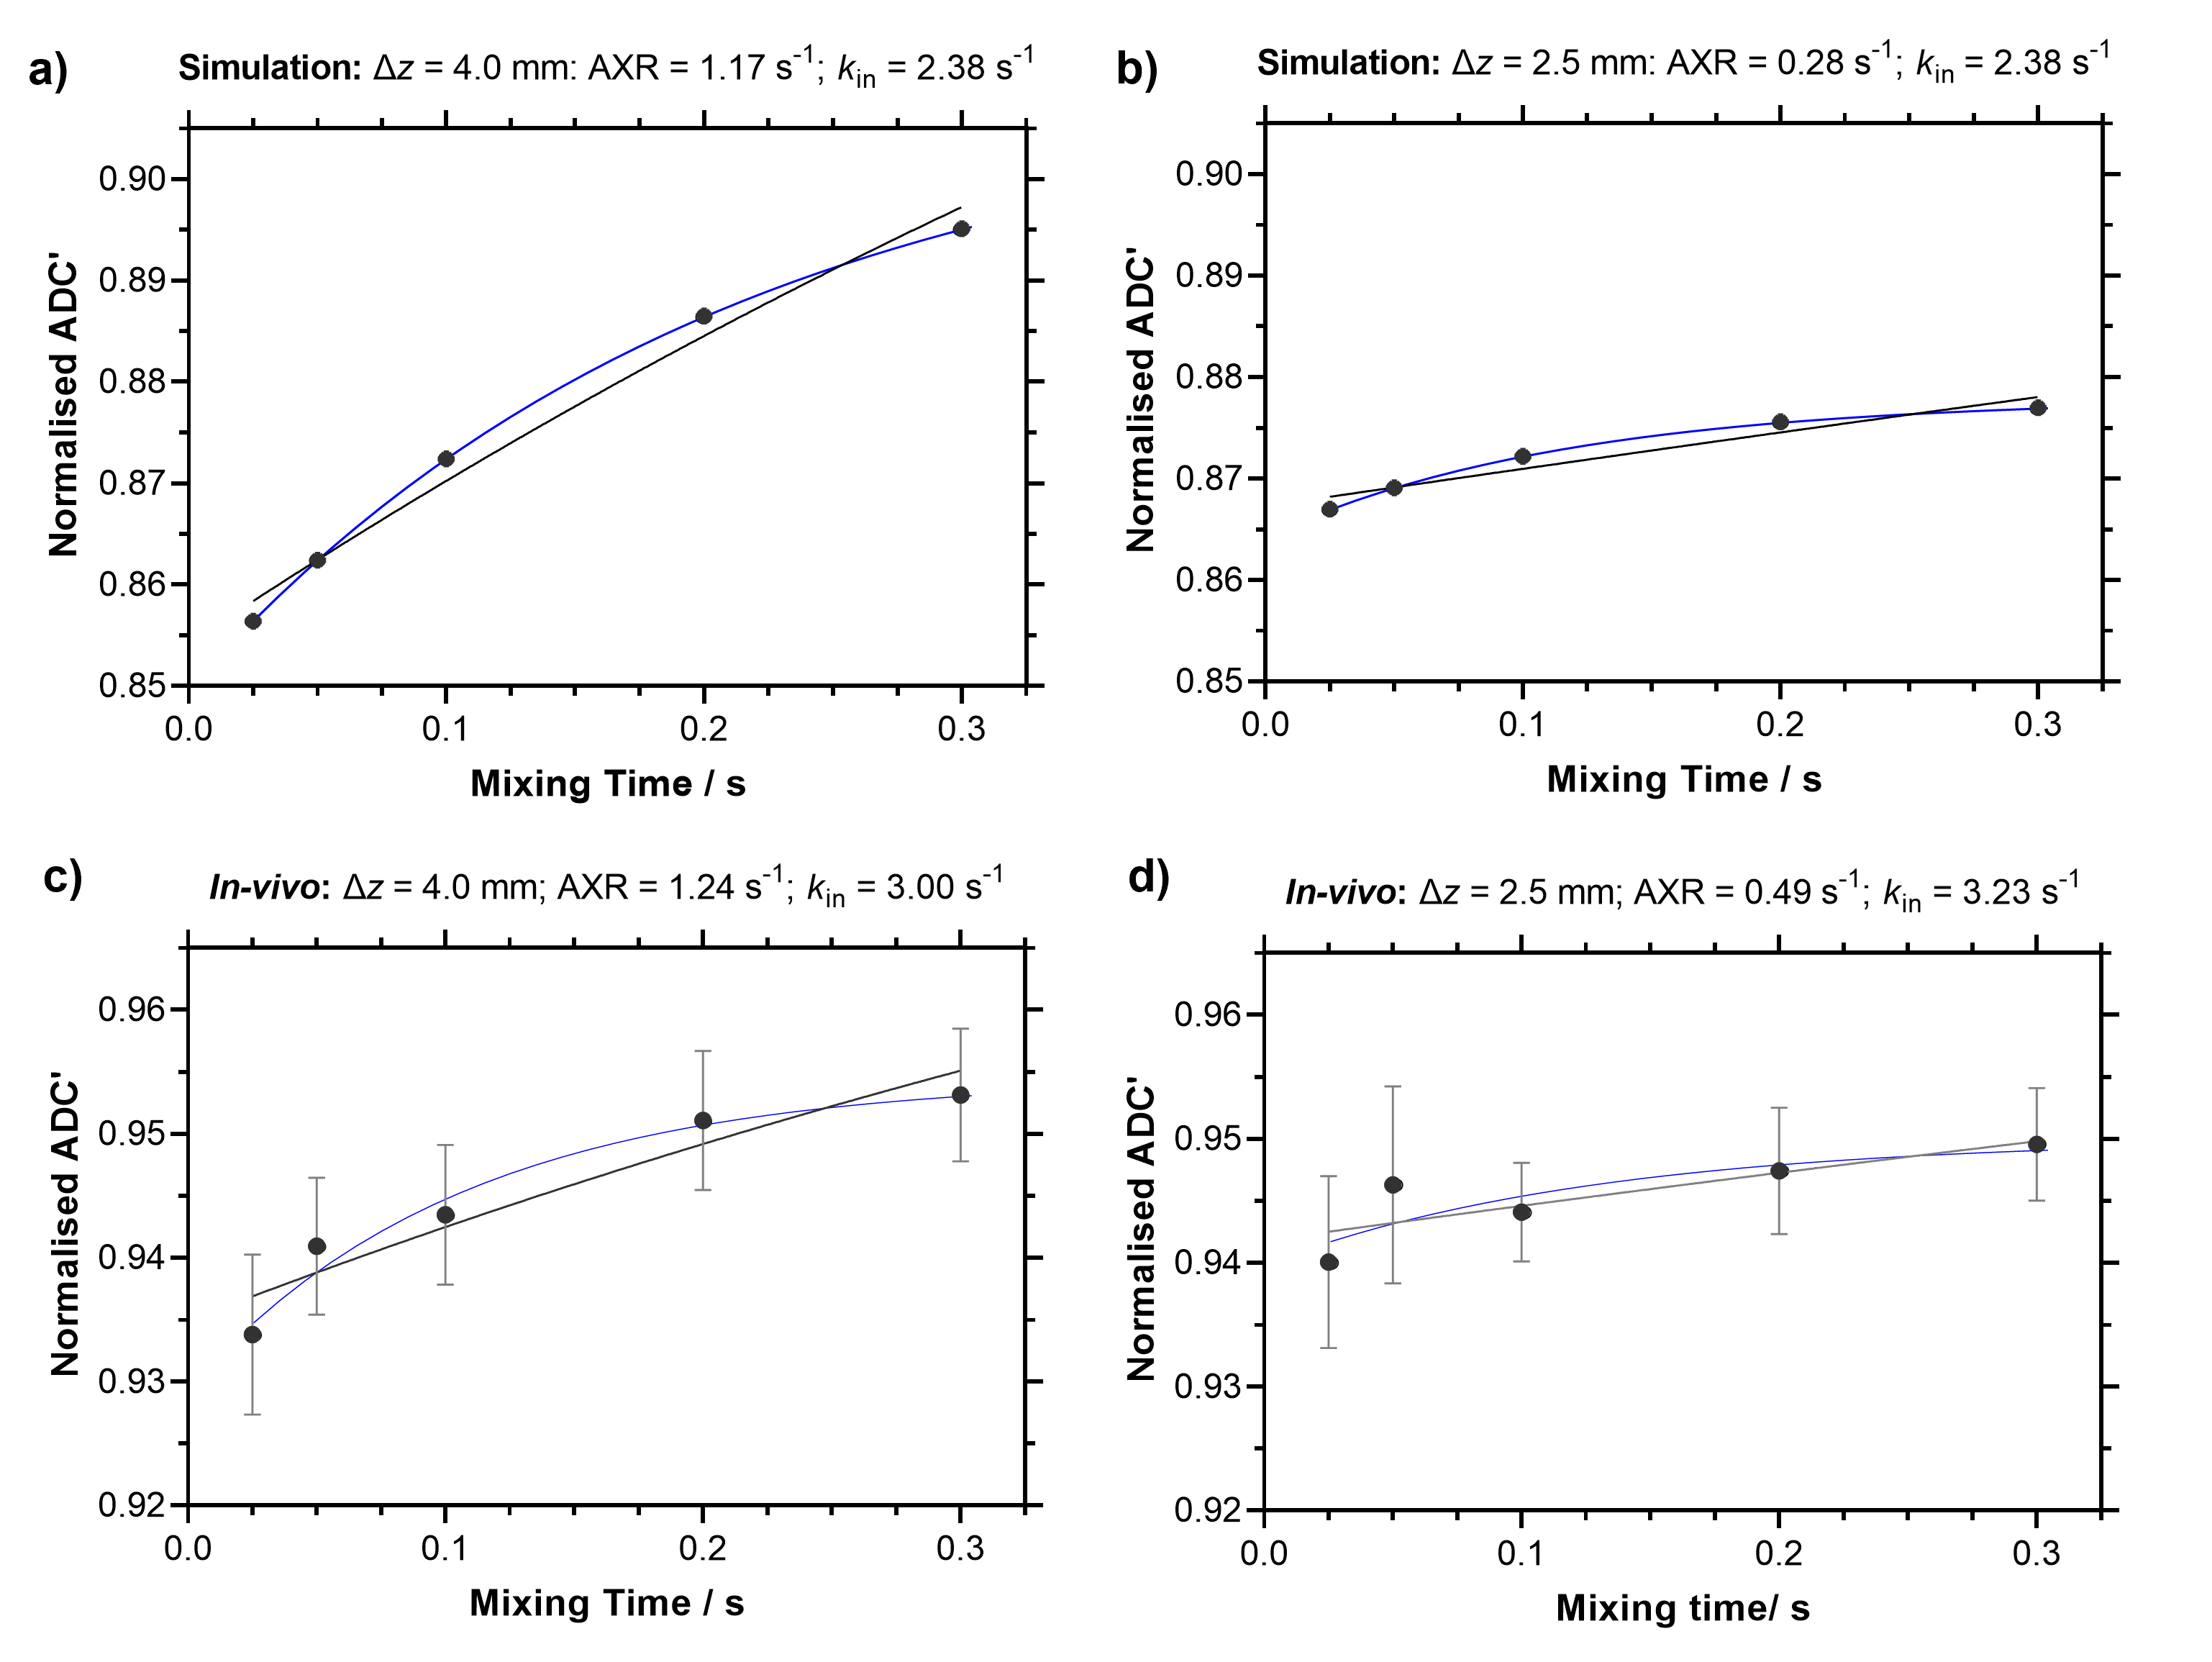
The simulations show that as slice thickness decreases, recovery of ADC’(tm) becomes progressively attenuated leading to underestimation of AXR (2.19 s-1, 1.16 s-1 to 0.28 s-1 for ∆z = 10.0 mm, 4.0 mm to 2.5 mm respectively), which is also reflected in the in vivo data where AXR = 1.24 ± 0.07 s-1 and 0.49 ± 0.06 s-1 at ∆z = 4.0 mm and 2.5 mm respectively (Figure 2). The CCXR model was able to recover the ground truth kin value of 2.38 s-1 for the signals simulated at both slice thicknesses at 4.0 mm and 2.5 mm, as expected (Figure 3a-b). In the in vivo protocol, the CCXR model gave mean kin values of 3.00 s-1 and 3.23 s-1 for ∆z = 4.0 mm and 2.5 mm respectively (Figure 3c-d). The mean water exchange values (± standard deviation) for the repeatability study were AXR = 0.97 ± 0.32 s-1 and kin = 3.11 ± 1.08 s-1 (Figure 4). Both models demonstrated reasonable repeatability with CoV of 33% and 35% for the AXR and CCXR models respectively.DISCUSSION & CONCLUSION
Simulated and in vivo data show progressive underestimation of BBB water exchange measurements with decreasing slice thickness when using the AXR model. The CCXR model removes the biases induced by the crusher gradients, and provides measurements of water exchange in the rodent brain that are more consistent with the literature estimates (~2.5 s-1 [4]). The CCXR model enables thinner slices in both the human and the rodent brain, which could be valuable for probing specific small brain regions particularly affected in diseases, such as the hippocampus in Alzheimer’s disease.Acknowledgements
This work is funded by the EPSRC: grant code EP/S031510/1. SL has received funding from the European Research Council (ERC) under the European Union’s Horizon 2020 research and innovation programme (grant agreement No 804746).References
[1] Bai, R., et al., Feasibility of filter-exchange imaging (FEXI) in measuring different exchange processes in human brain. NeuroImage, 2020. 219: p. 117039.
[2] Powell, E.O., Yolanda; Battiston, Marco; Parkes, Laura M.; Parker, Geoff J. M. , Voxel-wise compartmental modelling of blood-brain barrier water exchnage measurements using FEXI, in 31st Annual Meeting of International Society for Magnetic Resonance in Medicine. 2022: London, UK.
[3] Lasič, S., et al., Effects of imaging gradients in sequences with varying longitudinal storage time—Case of diffusion exchange imaging. Magnetic Resonance in Medicine, 2018. 79(4): p. 2228-2235.
[4] Dickie, B.R., G.J.M. Parker, and L.M. Parkes, Measuring water exchange across the blood-brain barrier using MRI. Progress in Nuclear Magnetic Resonance Spectroscopy, 2020. 116: p. 19-39.
[5] Scott, L.A., et al., Characterisation of microvessel blood velocity and segment length in the brain using multi-diffusion-time diffusion-weighted MRI. Journal of Cerebral Blood Flow & Metabolism, 2020. 41(8): p. 1939-1953.
[6] Lasič, S., et al., Apparent exchange rate mapping with diffusion MRI. Magnetic Resonance in Medicine, 2011. 66(2): p. 356-365.
[7] Nilsson, M., et al., Noninvasive mapping of water diffusional exchange in the human brain using filter-exchange imaging. Magn Reson Med, 2013. 69(6): p. 1573-81.
Figures