3073
Evaluation of multi-echo-based Hybrid-EPI (HEPI) technique for measuring brain oxygenation1Radiology and Nuclear Medicine, Erasmus MC, Rotterdam, Netherlands, 2Radiology, Leiden University Medical Center, Leiden, Netherlands, 3Medical Imaging, TU Delft, Delft, Netherlands
Synopsis
Keywords: Data Acquisition, Brain, Oxygenation
The reversible component of transverse relaxation time, R2’, enables the measurement of blood oxygenation, an important biomarker in several diseases. We propose a multi-echo HEPI technique to estimate R2’. HEPI combines GRE and SE and hence provides R2* and R2, when acquired at different echo-times. The accuracy of ME-HEPI in measuring R2’ is evaluated in a phantom in this work. The sensitivity of HEPI to different oxygenation levels, attained using respiratory challenge MRI, is studied in a healthy subject. This is also investigated using a simulation tool that simulates microvasculature and MR signal for varying oxygenation in the vessels.
INTRODUCTION
Oxygen extraction fraction (OEF) is a key physiological parameter of the brain’s energy metabolism and has been suggested to be a potential biomarker in several diseases, including brain tumor1,2. Several techniques have been developed to quantify OEF, based on the associations between blood oxygenation and MRI properties. Among them, the reversible transverse relaxation rate, R2′, is sensitive to the deoxyhemoglobin content of brain tissue, enabling information about the OEF to be obtained3. In this work we evaluated whether changes in R2’ can be properly measured with a multi-echo (ME) based Hybrid EPI (HEPI) technique which is a fast acquisition sequence that combines a gradient (GRE) and spin (SE) echo read-out4,5. The ability to measure R2’ using this technique is studied in a phantom and its sensitivity to different levels of brain oxygenation is evaluated in a healthy subject. For the latter part, different levels of a hypoxia condition are obtained by altering the arterial partial pressure of oxygen using Respiract, a device for respiratory challenges in MRI6,7. The observed changes in HEPI signals are compared to simulations of the HEPI signal in various oxygenation states.METHODS
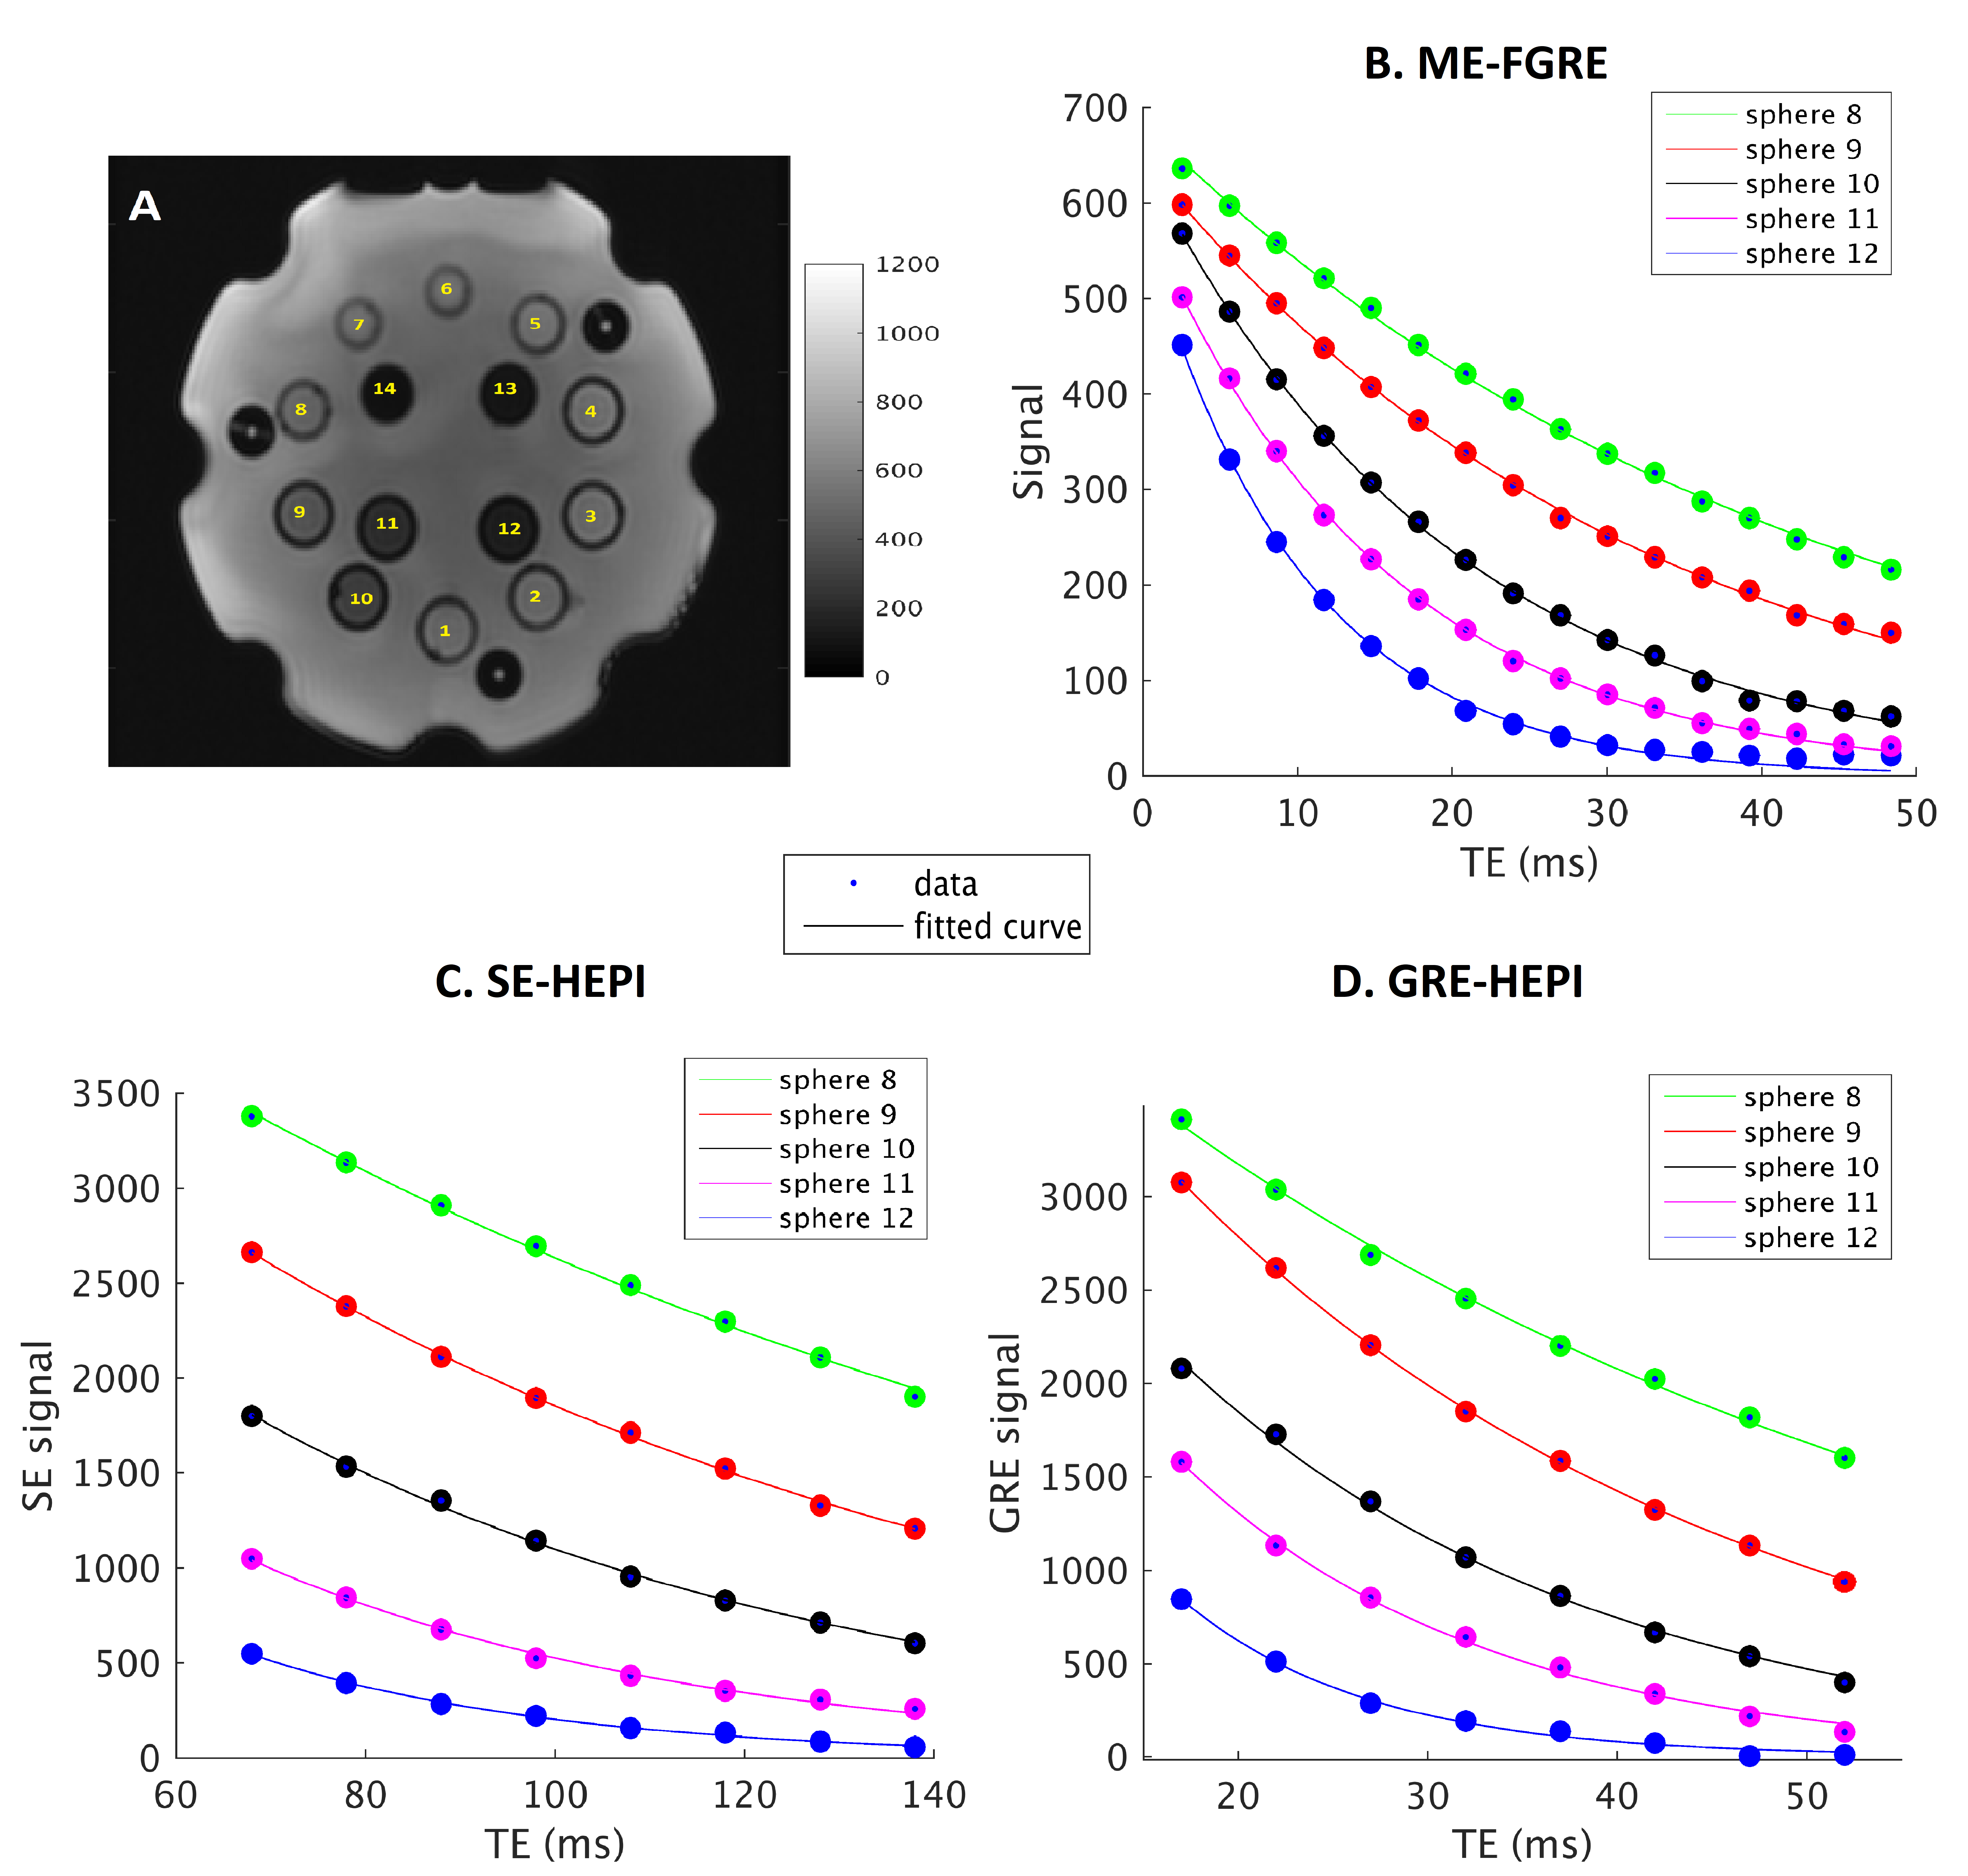
Data is acquired with 8 HEPI acquisitions for different echo times (TE-GRE = [17 – (5) – 52] ms; TE-SE = [68 – (10) – 138] ms; TR = 2s; called ME-HEPI) from ISMRM/NIST phantom8 with known T2 values, by a 3T MR scanner, along with ME-FGRE sequence (16 echoes; TE = [2.54 – 48.6] ms; TR = 100ms) to validate the T2* values. The HEPI sequence includes an excitation pulse followed by GRE readout and a refocusing pulse followed by SE readout for the specified TEs. Hence R2* and R2 are obtained in the phantom by fitting a mono-exponential model to the GRE-HEPI and SE-HEPI signals, respectively for the 8 echo times4. R2’ is subsequently calculated as the difference between R2 and R2*.To investigate the sensitivity of HEPI to oxygenation, the DCESim tool8 was run. We built a dictionary of the resulting ME-HEPI signals, simulating 5 vessels for varying oxygen saturation (Y = [60 - (5) - 95, 98, 100] %) for a blood volume fraction of 3% and vessel radius of 50μm. R2* and R2 are calculated for each Y by fitting to the GRE and SE HEPI signals of the dictionary atoms, respectively. Additionally, the same ME-HEPI acquisition was performed on a healthy subject (female, 24 years) under normal condition (normoxia) and 4 levels of hypoxia, which is attained by lowering the oxygen pressure controlled using Respiract (ThornHill, Canada) connected to the subject through a mask. The 4 levels of hypoxia were achieved by lowering the pressure from 110mmHg (normoxia) to 100mmHg (hypoxia 1), 90mmHg (hypoxia 2), 80mmHg (hypoxia 3) and 75mmHg (hypoxia 4) at a constant CO2 pressure (40mmHg). R2’ maps were obtained by fitting R2* and R2 to the respective ME-GRE and ME-SE data for all conditions.
RESULTS
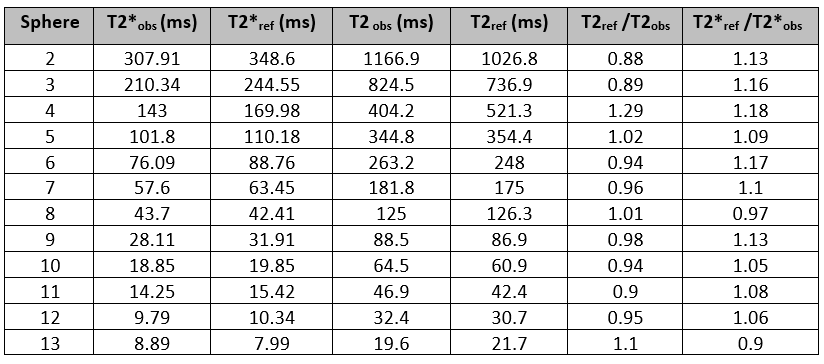
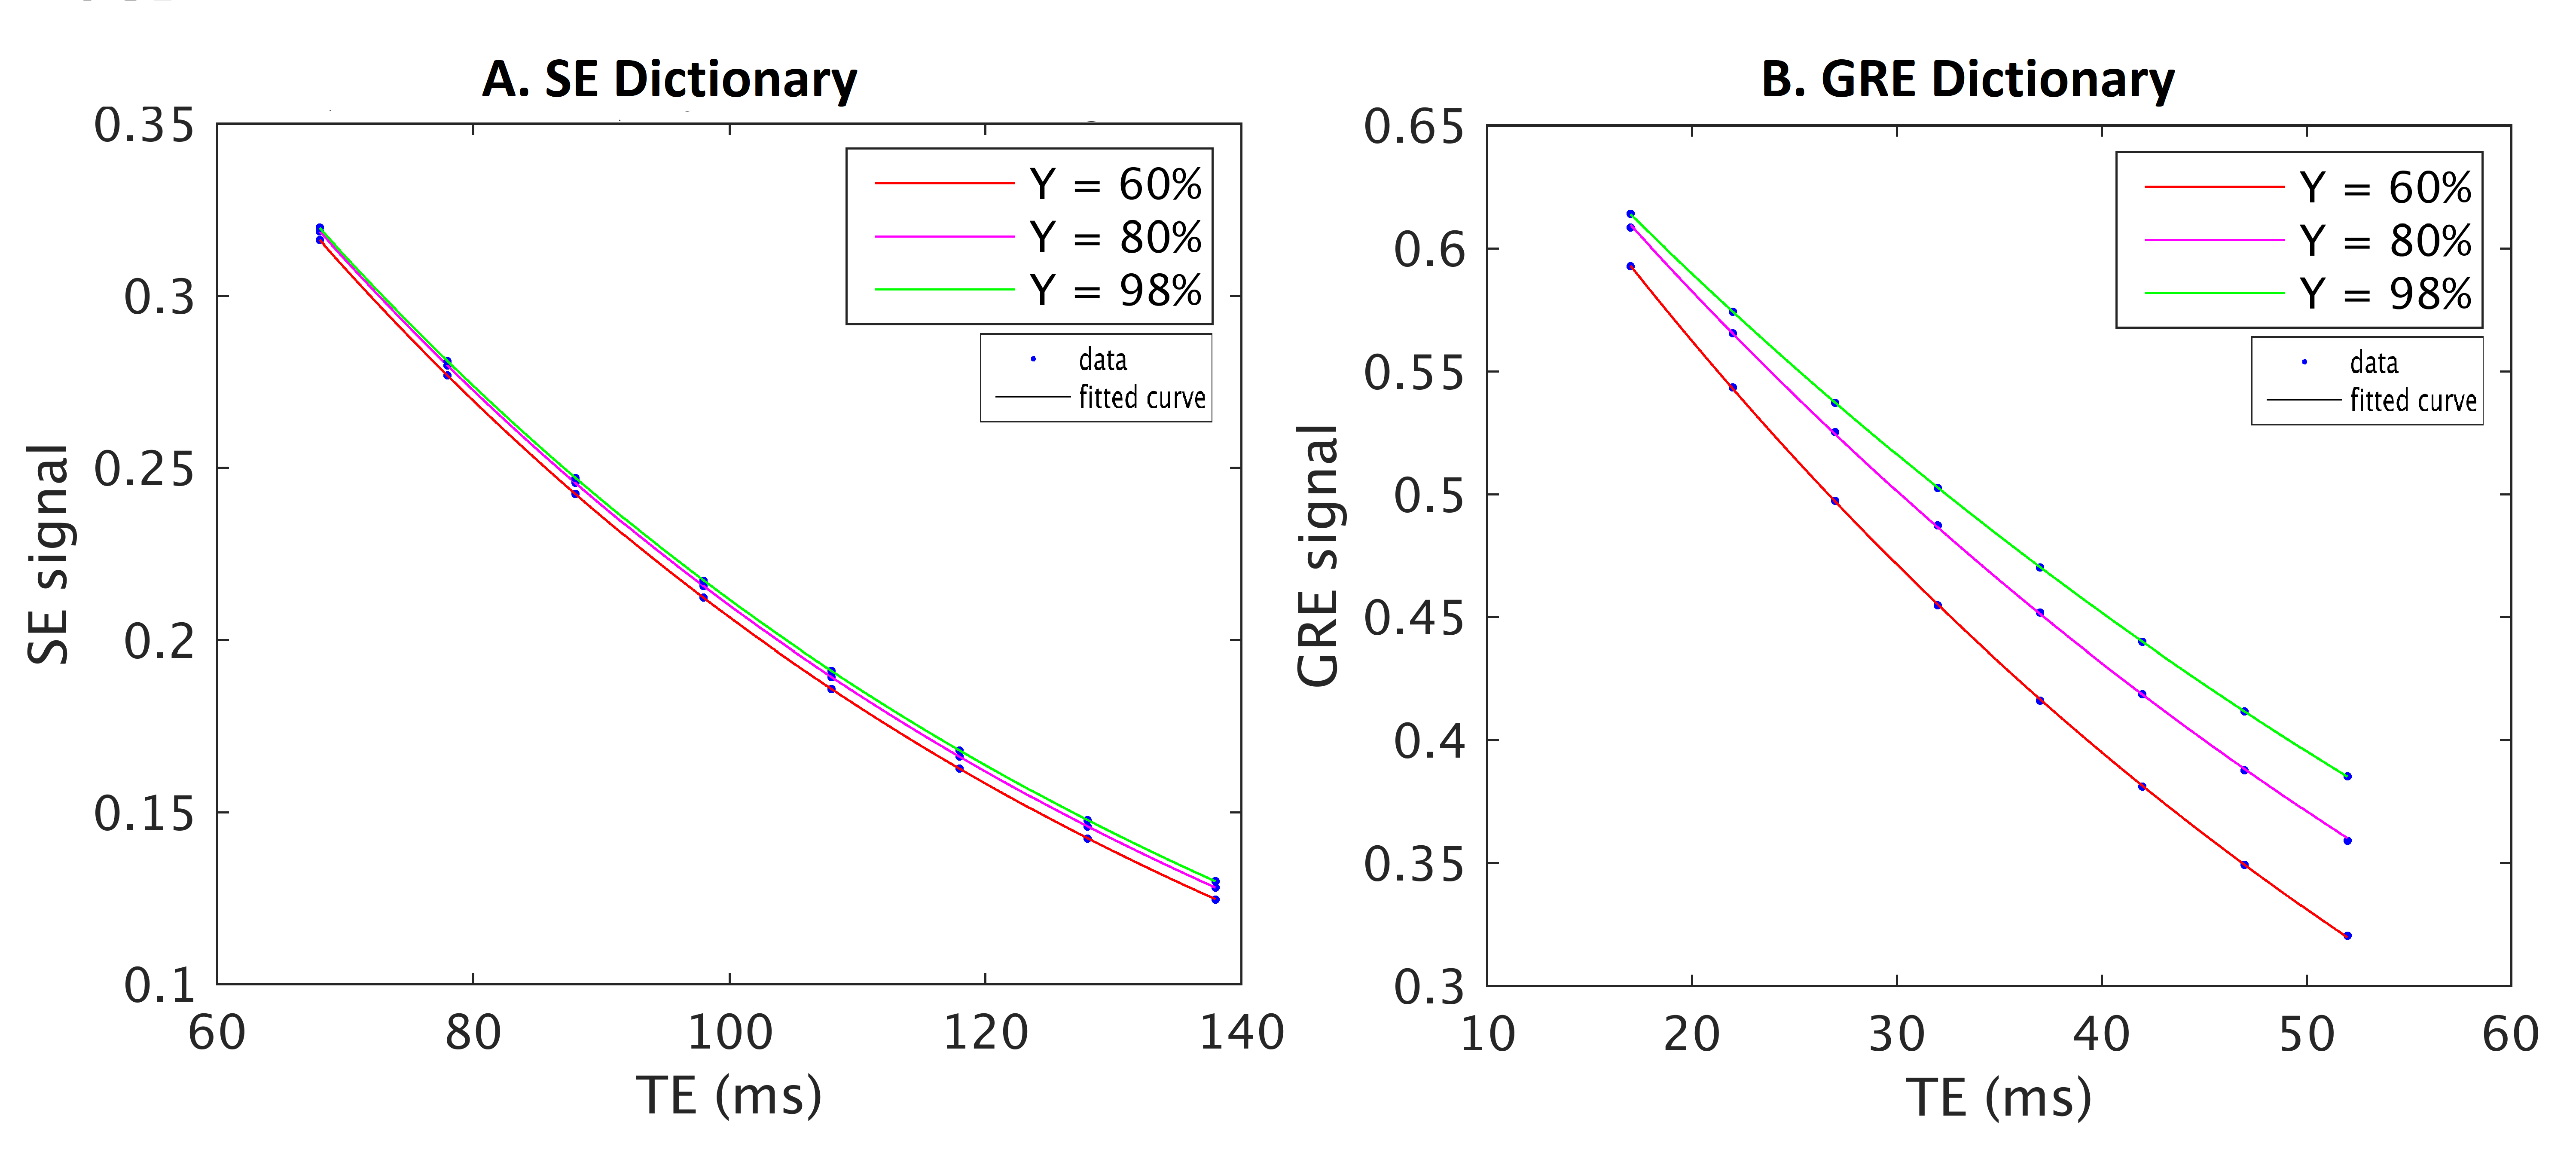
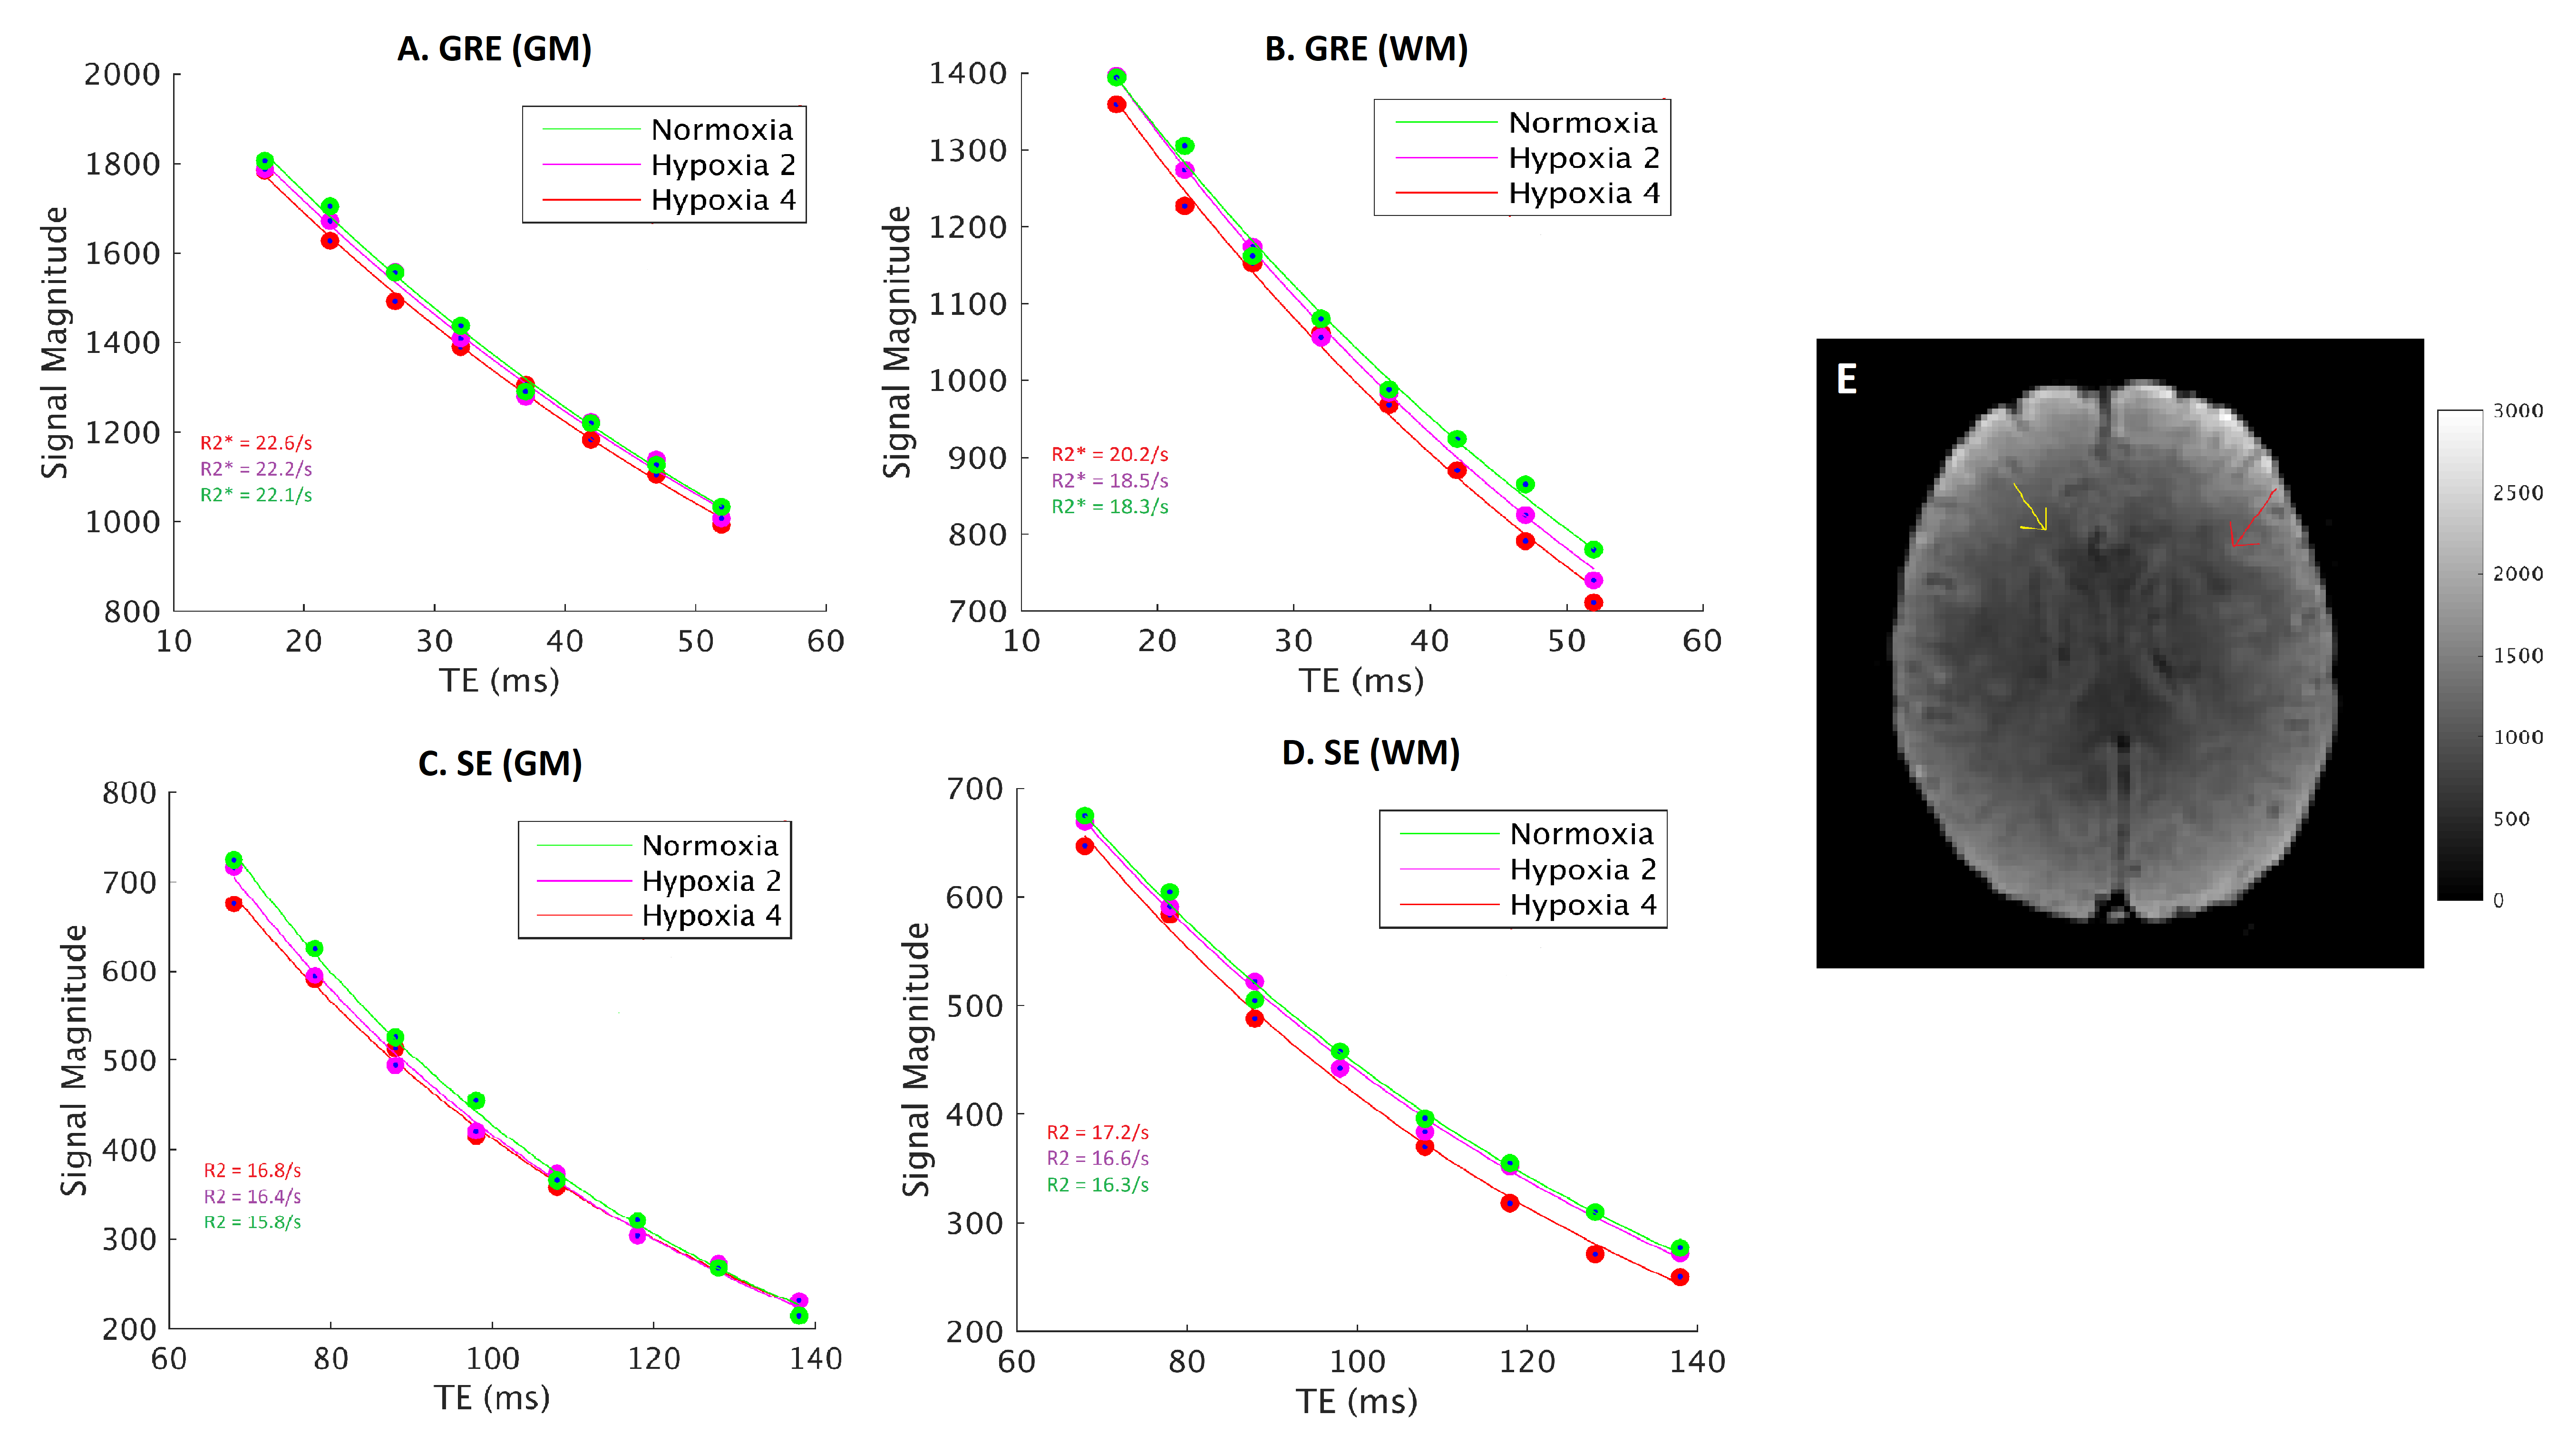
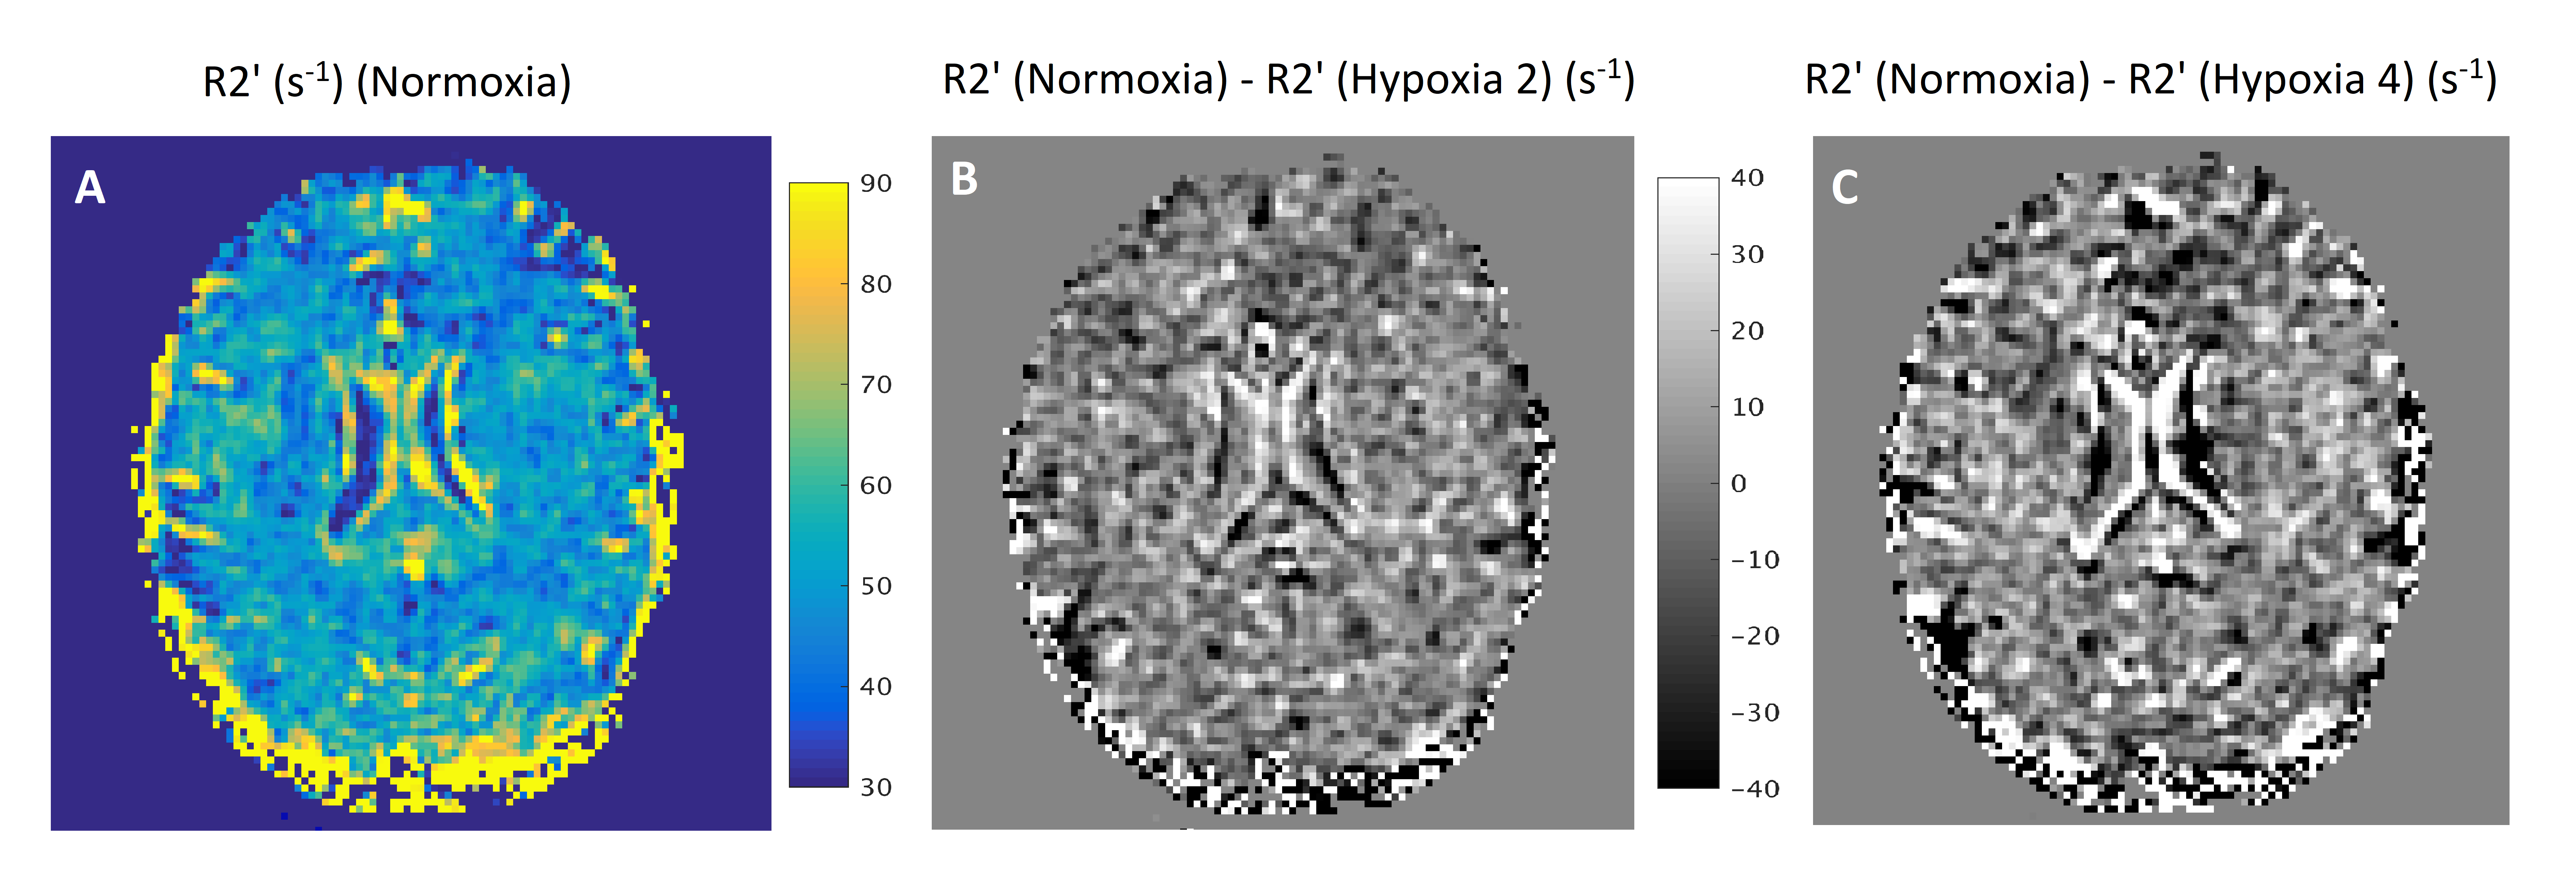
Figure 1 shows the data vs fit for GRE and SE-HEPI acquisition in the phantom. The T2 (1/R2) and T2* (1/R2*) obtained for all the NiCl2 spheres are shown in Table 1. The agreement to the reference techniques (the ratio between observed and reference values ≈1) shows that ME-HEPI accurately measures R2, R2 and hence R2’.Figure 2 shows the dictionary atoms for three Y values and their mono-exponential fit. Note that the signal magnitude decreases for higher Y. It is observed that the GRE is more sensitive to changes in Y which in turn alters the R2’ and therefore it shows sensitivity to brain oxygenation of the proposed technique. Figure 3 shows the data and fit for a voxel in GM and WM for GRE (A, B) and SE (C, D). R2’ maps were obtained from the in-vivo data. The change in signal across the levels appears lower in the GM region compared to WM. The change in R2’ for the different oxygen levels was evaluated and presented in Figure 4. The Hypoxia 4 stage shows more difference in R2’ (especially in the GM) compared to the intermediate stages. Oximeter reading was also performed during the study and the arterial oxygen saturation dropped from 100% (normoxia) to 96% (hypoxia 4) in the subject.
DISCUSSION
With ME-HEPI we can estimate R2’ from R2 and R2*, with results comparable to the standard techniques where R2 and R2* are estimated from separate SE and GRE sequences4. From the simulations it is observed that the ME-HEPI signal is sensitive to changes in oxygenation in the microvasculature. The in-vivo data acquired for different levels of blood oxygenation also provided difference in R2’ maps obtained from ME-HEPI. Hence the method might be a good candidate for quantifying OEF in the brain from R2’ measurements. A limitation of the study is the susceptibility induced artefacts of the GRE scans, which are stronger for longer echo-times and dominant at the phantom or subject boundaries. This affects the accuracy of R2’ estimation in the current results but could be improved by avoiding corrupted echoes9. Further study includes matching the dictionary simulated for different Y with the in-vivo data, based on vascular fingerprinting technique to measure brain oxygenation after obtaining the cerebral blood volume10,11.Acknowledgements
We are thankful to NWO domain AES (project 17079) and Medical Delta Cancer Diagnostics 3.0 for their support.References
1. Jiang, Dengrong, and Hanzhang Lu. "Cerebral oxygen extraction fraction MRI: Techniques and applications." Magnetic Resonance in Medicine (2022).
2. Stadlbauer A, Zimmermann M, Kitzwogerer M, et al. MR imaging-derived oxygen metabolism and neovascularization characterization for grading and IDH gene mutation detection of gliomas. Radiology. 2017; 283:799-809.
3. Blockley, Nicholas P., and Alan J. Stone. "Improving the specificity of R2′ to the deoxyhaemoglobin content of brain tissue: Prospective correction of macroscopic magnetic field gradients." Neuroimage 135 (2016): 253-260.
4. Ni, Wendy, et al. "Comparison of R2′ measurement methods in the normal brain at 3 Tesla." Magnetic resonance in medicine 73.3 (2015): 1228-1236.
5. P. F. Ferreira, P. D. Gatehouse, and D. N. Firmin, “Myocardial first-pass perfusion imaging with hybrid-EPI: Frequency-offsets and potential artefacts,” J. Cardiovasc. Magn. Reson., 2012, doi: 10.1186/1532-429X-14-44.
6. Kety ss, Schmidt cf. the nitrous oxide method for the quantitative determination of cerebral blood flow in man: theory, procedure, and normal values. j clin invest. 1948 jul;27(4):476-83. doi: 10.1172/jci101994. pmid: 16695568; pmcid: pmc439518.
7. Tóth V, Förschler A, Hirsch NM, den Hollander J, Kooijman H, Gempt J, Ringel F, Schlegel J, Zimmer C, Preibisch C. MR-based hypoxia measures in human glioma. J Neurooncol. 2013 Nov;115(2):197-207. doi: 10.1007/s11060-013-1210-7. Epub 2013 Aug 7. PMID: 23918147.
8. Pannetier, Nicolas Adrien, et al. "A simulation tool for dynamic contrast enhanced MRI." PloS one 8.3 (2013): e57636.
9. Z. Abbas, V. Gras, K. Möllenhoff, F. Keil, A.-M. Oros-Peusquens, and N. J. Shah, “Analysis of proton-density bias corrections based on T 1 measurement for robust quantification of water content in the brain at 3 Tesla: Quantitative Water Content Mapping at 3T,” Magnetic Resonance in Medicine, vol. 72, no. 6, pp. 1735–1745, Dec. 2014, doi: 10.1002/mrm.25086.
10. Christen, Thomas, et al. "MR vascular fingerprinting: A new approach to compute cerebral blood volume, mean vessel radius, and oxygenation maps in the human brain." Neuroimage 89 (2014): 262-270.
11. K.Venugopal et al, Quantification of microvascular properties of gliomas using dynamic susceptibility contrast (DSC) – Hybrid EPI based MR Vascular Fingerprinting (MRVF) compared with Vessel Size Imaging (VSI), ISMRM 2022.
Figures