3071
Retrospective quantification pharmacokinetics of clinical breast DCE-MRI using deep learning
Chaowei Wu1,2, Lixia Wang1, Nan Wang1,3, Stephen Pandol4, Anthony G Christodoulou1,2, Yibin Xie1, and Debiao Li1,2
1Biomedical Imaging Research Institute, Cedars-Sinai Medical Center, Los Angeles, CA, United States, 2Department of Bioengineering, University of California, Los Angeles, Los Angeles, CA, United States, 3Radiology Department, Stanford University, Stanford, CA, United States, 4Division of Digestive and Liver Diseases, Cedars-Sinai Medical Center, Los Angeles, CA, United States
1Biomedical Imaging Research Institute, Cedars-Sinai Medical Center, Los Angeles, CA, United States, 2Department of Bioengineering, University of California, Los Angeles, Los Angeles, CA, United States, 3Radiology Department, Stanford University, Stanford, CA, United States, 4Division of Digestive and Liver Diseases, Cedars-Sinai Medical Center, Los Angeles, CA, United States
Synopsis
Keywords: Machine Learning/Artificial Intelligence, DSC & DCE Perfusion
Standard-of-care DCE-MRI suffers from a limited number of contrast phases and low temporal resolution, preventing the quantification of pharmacokinetic parameters. Quantitative DCE-MRI techniques have not yet been widely applied in the clinic due to the limited availability of specialized sequences and image reconstruction. To tackle this problem, we proposed to improve the temporal resolution of multi-phasic DCE-MRI by deep learning post-processing and demonstrated promising results in tumor delineation in the Duke-Breast-Cancer-MRI dataset.Purpose
Pharmacokinetic parameters from quantitative DCE-MRI provide characterization of the tissue perfusion and flow, and are a potential biomarker for tumor staging and prognosis1,2. However, most standard-of-care DCE-MRI protocols have a limited number of phases and insufficient temporal resolution for quantitative analysis3. Advanced quantitative DCE-MRI techniques (e.g. Multitasking DCE4, QIN5, etc.) usually require specialized sequences and lack sufficient clinical validation for wide clinical application. The objective of this study is to develop a retrospective quantification method for multi-phasic DCE-MRI by deep learning. In this study, we synthesized clinical multi-phasic breast DCE-MRI by downsampling 2.8-s temporal resolution Multitasking DCE and developed a deep learning-based method for retrospective pharmacokinetic quantification. We evaluated method performance in tumor mass and contralateral non-tumor breast tissue in the Duke-Breast-Cancer-MRI dataset6.Materials and Methods
Data description:The datasets for training and validation, 19 female subjects, including 13 healthy volunteers and 6 patients with pathologically confirmed triple-negative breast cancer, were scanned on a 3T scanner (MAGNETOM Vida, Siemens Healthcare, Germany). A 20% low-dose (0.02mmol/kg) Multitasking DCE protocol was first performed. Afterwards, a 20% low-dose repeat study was performed on 10 of the healthy volunteers, and a standard-dose (0.1 mmol/kg) Multitasking DCE protocol was performed on 9 of the healthy volunteers. Low-dose or standard-dose Multitasking DCE acquisition lasted for 10-min with 0.9 mm x 0.9 mm x 1.1 mm spatial resolution. Dynamic T1 maps with 2.8-s temporal resolution were obtained from Multitasking DCE.
Figure 1 (A) summarizes the synthesis of the input and reference. Each T1W DCE-MRI signal $$$S_{ref}$$$ was generated from 2.8-s temporal resolution both doses of Multitasking R1 values using the FLASH signal equation, then downsampled to multi-phasic DCE-MRI $$$S_{in}$$$ based on a randomized number of phases (4 to 7) and temporal resolution (74-s to 130-s). The same pipeline was used for left ventricular so that 2.8-s temporal resolution $$$AIF_{ref}$$$ and multi-phasic artery input function $$$AIF_{in}$$$ were generated. The synthesis was based on the median TR/TE/flip angle in the Duke-Breast-Cancer-MRI dataset (TR/TE=5.2/2.39 ms, flip angle=10°).
The standard Tofts model7 was used. A pre-screening strategy was used to exclude data that could not be well characterized by the standard Tofts model, i.e. pixel-wise data with an L-S fitting residual of greater than 1 was excluded.
Network architecture:
A deep-learning-based pipeline was built to enable retrospective quantification by improving the temporal resolution. The neural network consisted of two sub-networks. As shown in Figure 1(B), upsampling block aims to convert low-temporal resolution inputs to high-temporal resolution outputs, which were passed to a deconvolution block along with $$$AIF_{ref}$$$ for three pharmacokinetic parameters outputs $$$K^{trans}$$$, $$$k_{ep}$$$, and $$$v_e$$$ in the standard Tofts model.
The whole network was trained jointly in 100 epochs. The loss function consists of three components: (1) mean squared error; (2) data consistency loss defined as mean squared error of outputs and reference in known phases; (3) self-supervised loss defined as mean squared error of outputs and reconstructed outputs using the intermediate pharmacokinetic parameters and $$$AIF_{ref}$$$. In brief, the cost function was:
$$$L=\left\|S_{\text {out }}-S_{\text {ref }}\right\|_2^2+\lambda_1\left\|S_{\text {in }}-\Omega S_{\text {out }}\right\|_2^2+\lambda_2\left\|S_{\text {out }}-f_{\text {Tofts }}\left(A I F_{\text {out }}, k_{\mathrm{ep}, \text { out }}, K_{\text {out }}^{\text {trans }}\right)\right\|_2^2$$$
with standard Tofts model $$$f_{Tofts}\left(C_p, k_{ep}, K^{trans}\right)=K^{trans} C_{\mathrm{p}} * e^{-k_{\mathrm{ep}} t}$$$ and temporal down-sampling operator $$$\Omega$$$.
For inference, only the upsampling block was used for temporal super-resolution before parameter estimation by variable projection (VARPRO)8. Tissue signal $$$S_{out}$$$ and the $$$AIF_{out}$$$ were obtained by passing $$$S_{in}$$$ and $$$AIF_{in}$$$ to the upsampling block individually.
Performance assessment:
The Duke-Breast-Cancer-MRI dataset was used to assess the performance of the proposed method. An experienced radiologist labeled tumor and non-tumor regions in 89 of the dataset. Testing was performed in these labeled patient data.
Result
A representative example of retrospectively quantified pharmacokinetic maps from one of the breast cancer patients in the test set was shown in Figure 2. The tumor mass is marked by a red arrow, and the non-tumor tissue is marked by a green arrow. Retrospectively quantified maps demonstrated higher $$$K^{trans}$$$, higher $$$k_{ep}$$$, and higher $$$v_e$$$ in tumor region compared to contralateral tissue. Figure 3 shows the box plot of the tumor region versus non-tumor region. Table 1 shows the ROI statistics of the retrospective quantified parameters in tumor and non-tumor regions. Both figure and table show that the proposed method provides promising results in terms of uniformity within the same tissue and difference between different tissue types. For all three parameters, Wilcoxon Signed Rank test shows significant differences.Discussion and Conclusion
In this work, we demonstrated the feasibility of retrospective quantification of multi-phasic clinical breast DCE-MRI. The quantitative pharmacokinetic parameters derived retrospectively using deep learning show significant differences between tumor and contralateral tissue, which is consistent with previous studies9 using quantitative DCE MRI. This retrospective approach has the potential to quantify a large number of conventional multi-phasic breast DCE MRI studies to establish the range of various pharmacokinetic parameters for tumor and non-tumor tissues. Upon further validation, this approach could quantify the underlying pharmacokinetics using clinical multi-phasic DCE MRI to improve breast cancer diagnosis and assessment of treatment responses.Acknowledgements
No acknowledgement found.References
- Alonzi R, Padhani AR, Taylor NJ, et al. Antivascular effects of neoadjuvant androgen deprivation for prostate cancer: an in vivo human study using susceptibility and relaxivity dynamic MRI. International Journal of Radiation Oncology* Biology* Physics. 2011;80(3):721-727.
- Zhang N, Zhang L, Qiu B, Meng L, Wang X, Hou BL. Correlation of volume transfer coefficient Ktrans with histopathologic grades of gliomas. Journal of Magnetic Resonance Imaging. 2012;36(2):355-363.
- Kershaw LE, Cheng HLM. Temporal resolution and SNR requirements for accurate DCE-MRI data analysis using the AATH model. Magnetic Resonance in Medicine. 2010;64(6):1772-1780
- Wang N, Xie Y, Fan Z, et al. Five-dimensional quantitative low-dose multitasking dynamic contrast-enhanced MRI: preliminary study on breast cancer. Magnetic Resonance in Medicine. 2021;85(6):3096-3111.
- Tudorica LA, Oh KY, Roy N, et al. A feasible high spatiotemporal resolution breast DCE-MRI protocol for clinical settings. Magnetic resonance imaging. 2012;30(9):1257-1267.
- Saha A, Harowicz MR, Grimm LJ, et al. A machine learning approach to radiogenomics of breast cancer: a study of 922 subjects and 529 DCE-MRI features. British journal of cancer. 2018;119(4):508-516.
- Tofts PS, Berkowitz B, Schnall MD. Quantitative analysis of dynamic Gd-DTPA enhancement in breast tumors using a permeability model. Magnetic resonance in medicine. 1995;33(4):564-568.
- Golub GH, Pereyra V. The differentiation of pseudo-inverses and nonlinear least squares problems whose variables separate. SIAM Journal on numerical analysis. 1973;10(2):413-432.
- Lee J, Kim SH, Kang BJ. Pretreatment prediction of pathologic complete response to neoadjuvant chemotherapy in breast cancer: perfusion metrics of dynamic contrast enhanced MRI. Scientific Reports. 2018;8(1):1-8.
Figures
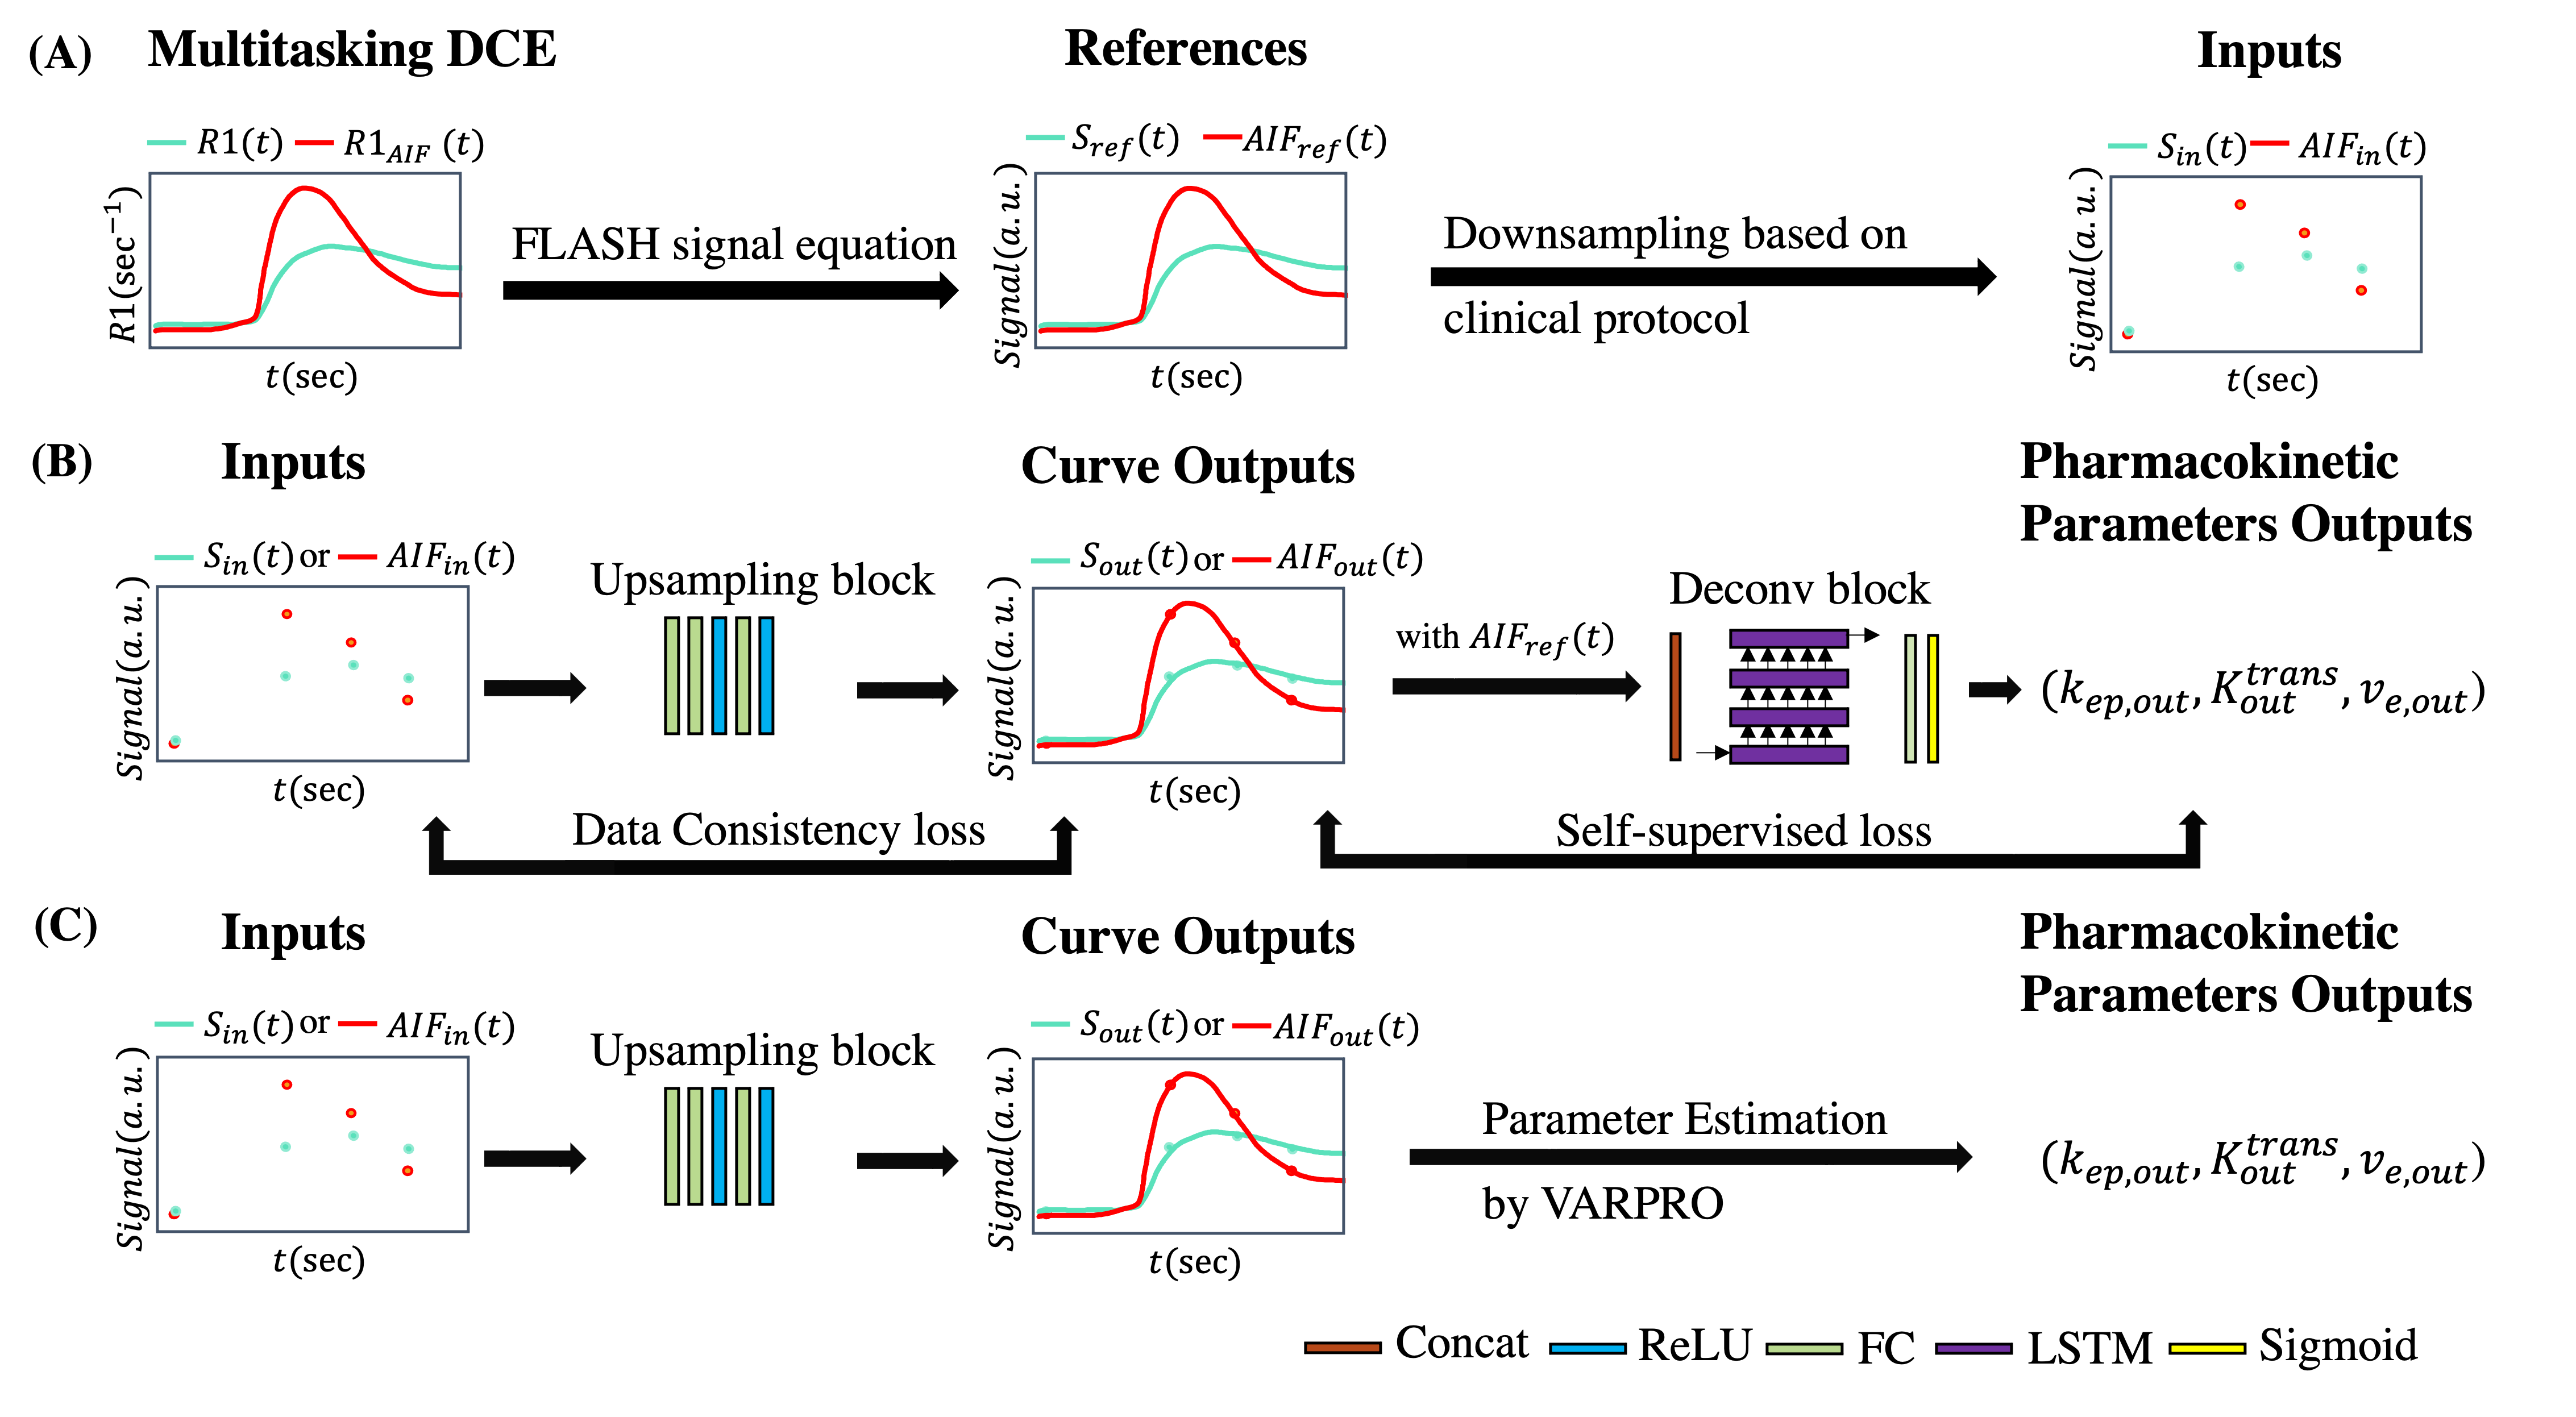
Figure 1. (A) Input and reference preparation pipeline. Synthesized T1W DCE-MRI signal Sref was generated from 2.8-s temporal resolution R1 via FLASH signal equation, then downsampled to multi-phasic DCE-MRI Sin based on randomized number of phases and temporal resolution. The same pipeline was used for left ventricular so that 2.8-s temporal resolution AIFref and multi-phasic artery input function AIFin were generated.
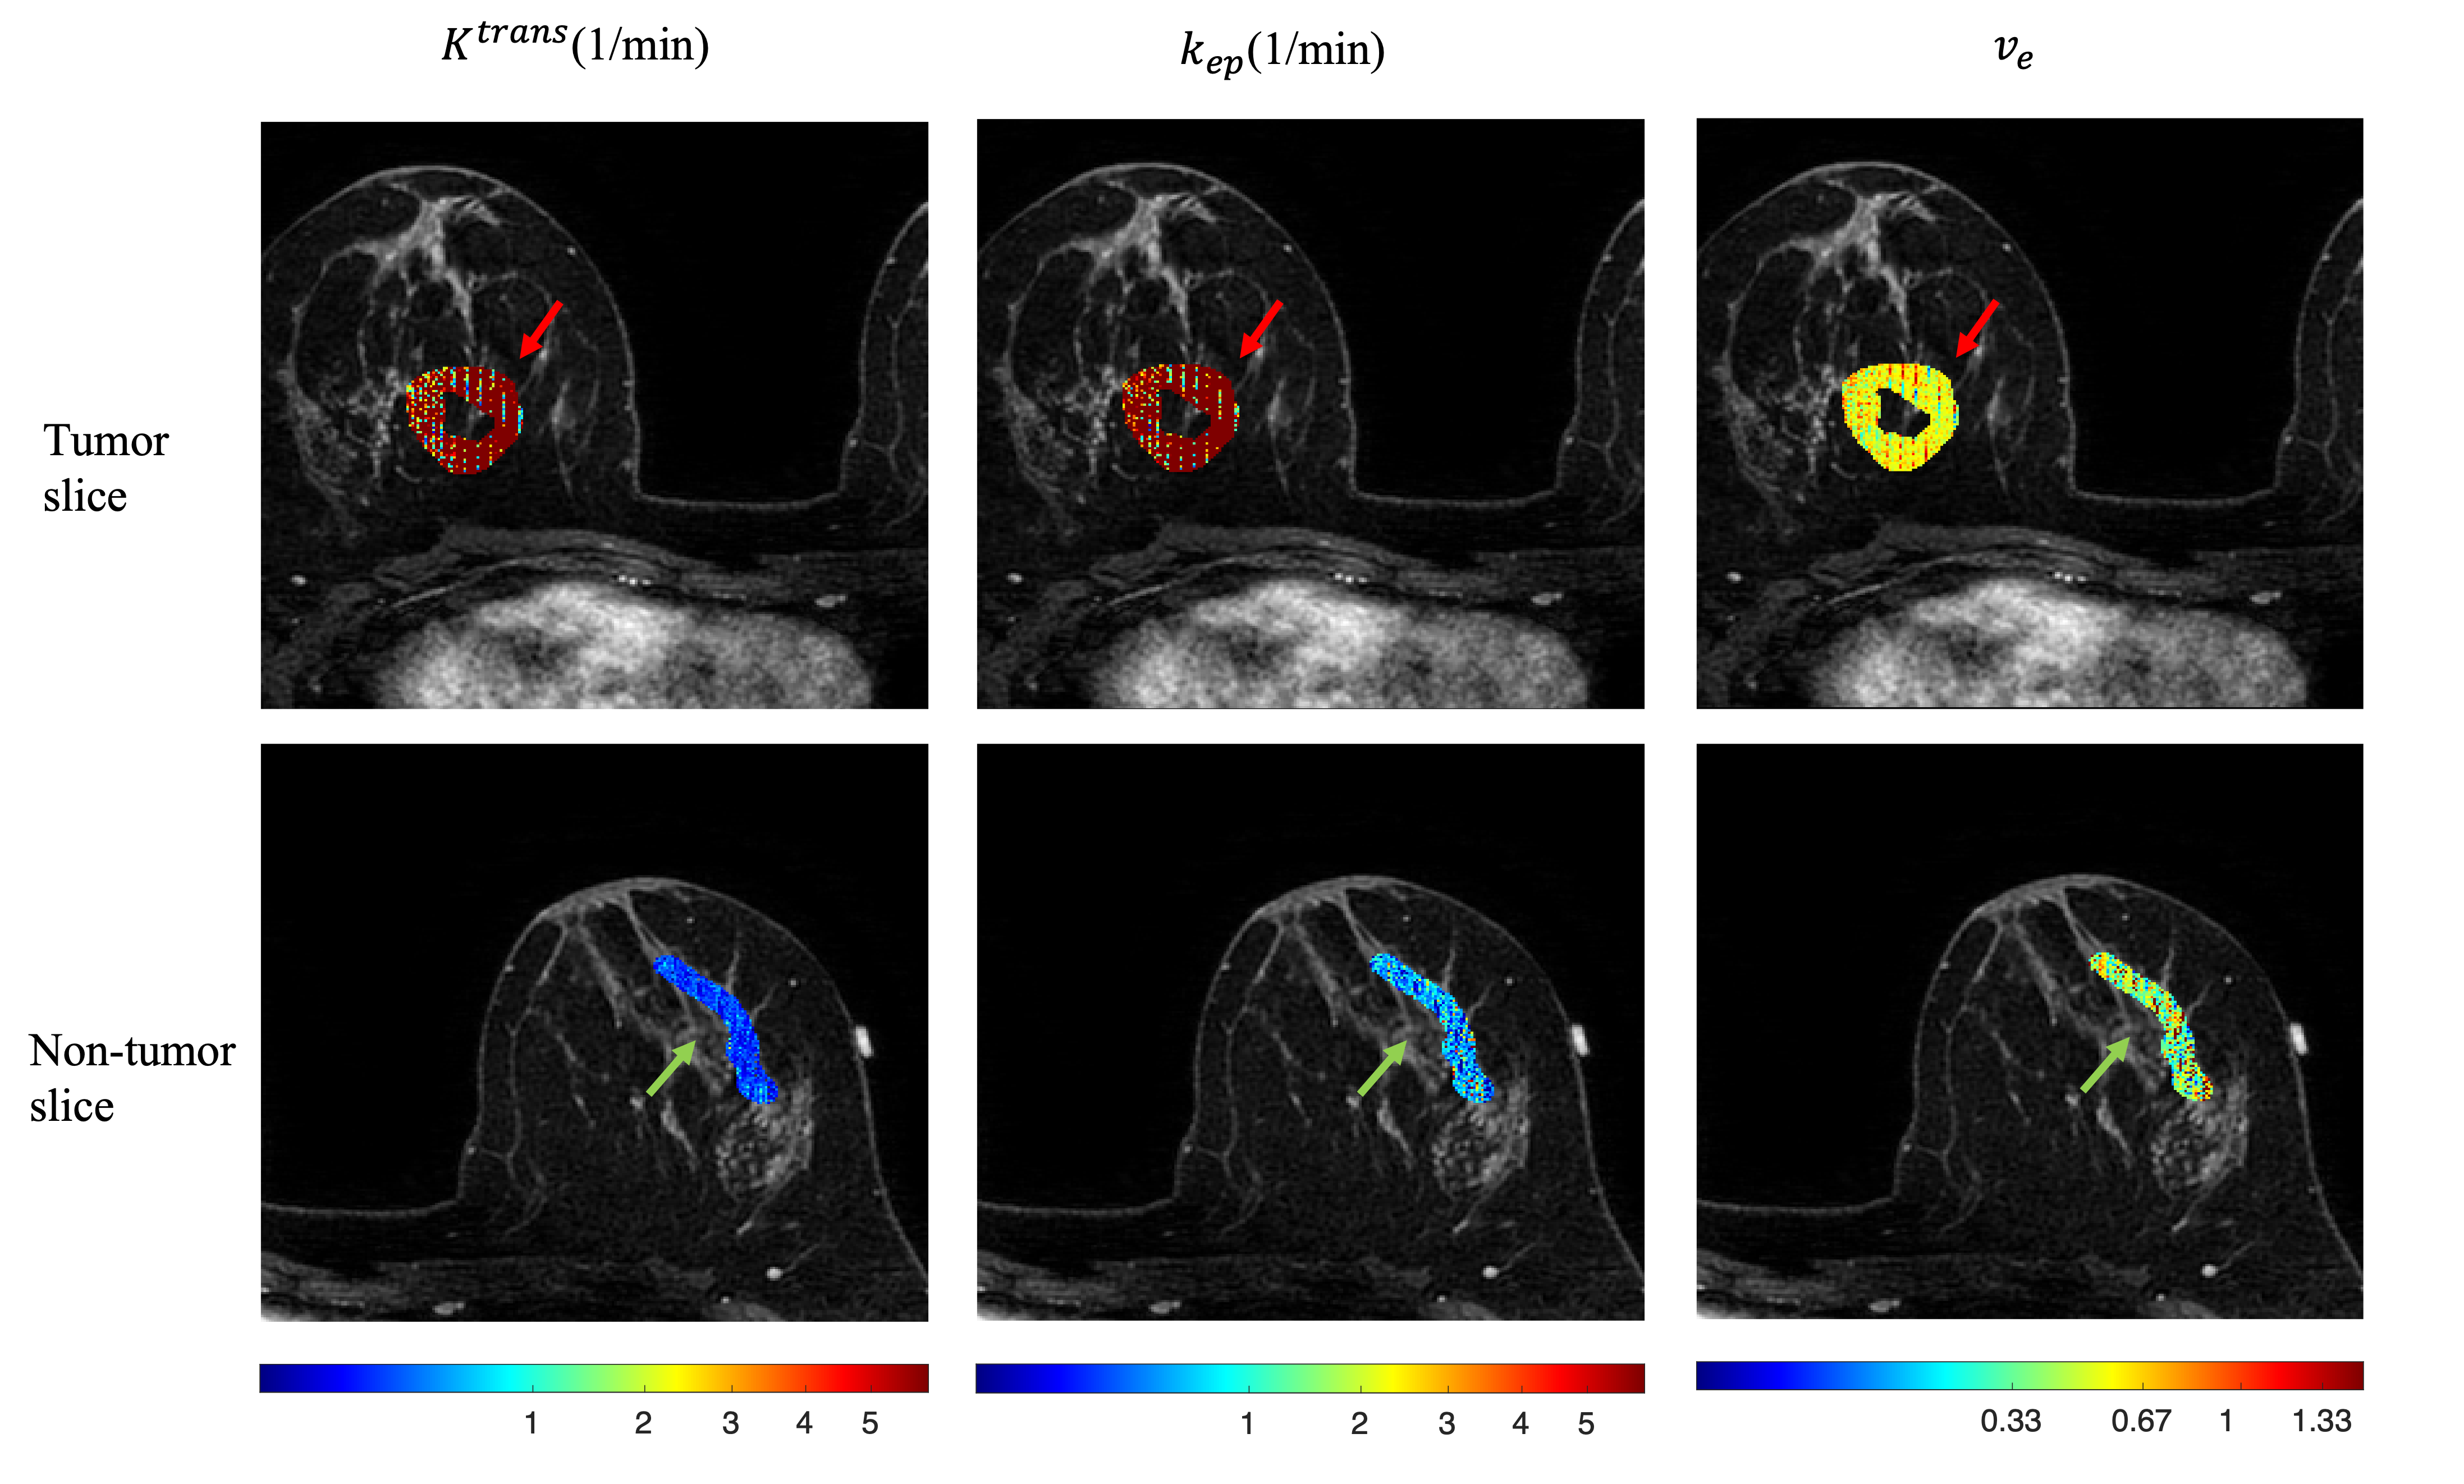
Figure 2. Retrospective pharmacokinetic maps in one of the representative case. Left to right: Ktrans, kep, ve. Top row shows one slice with most of the tumor mass. The red arrow points out to the tumor. Bottom row shows one slice with most of the contralateral breast tissue (non-tumor). The green arrow points out to the non-tumor region.
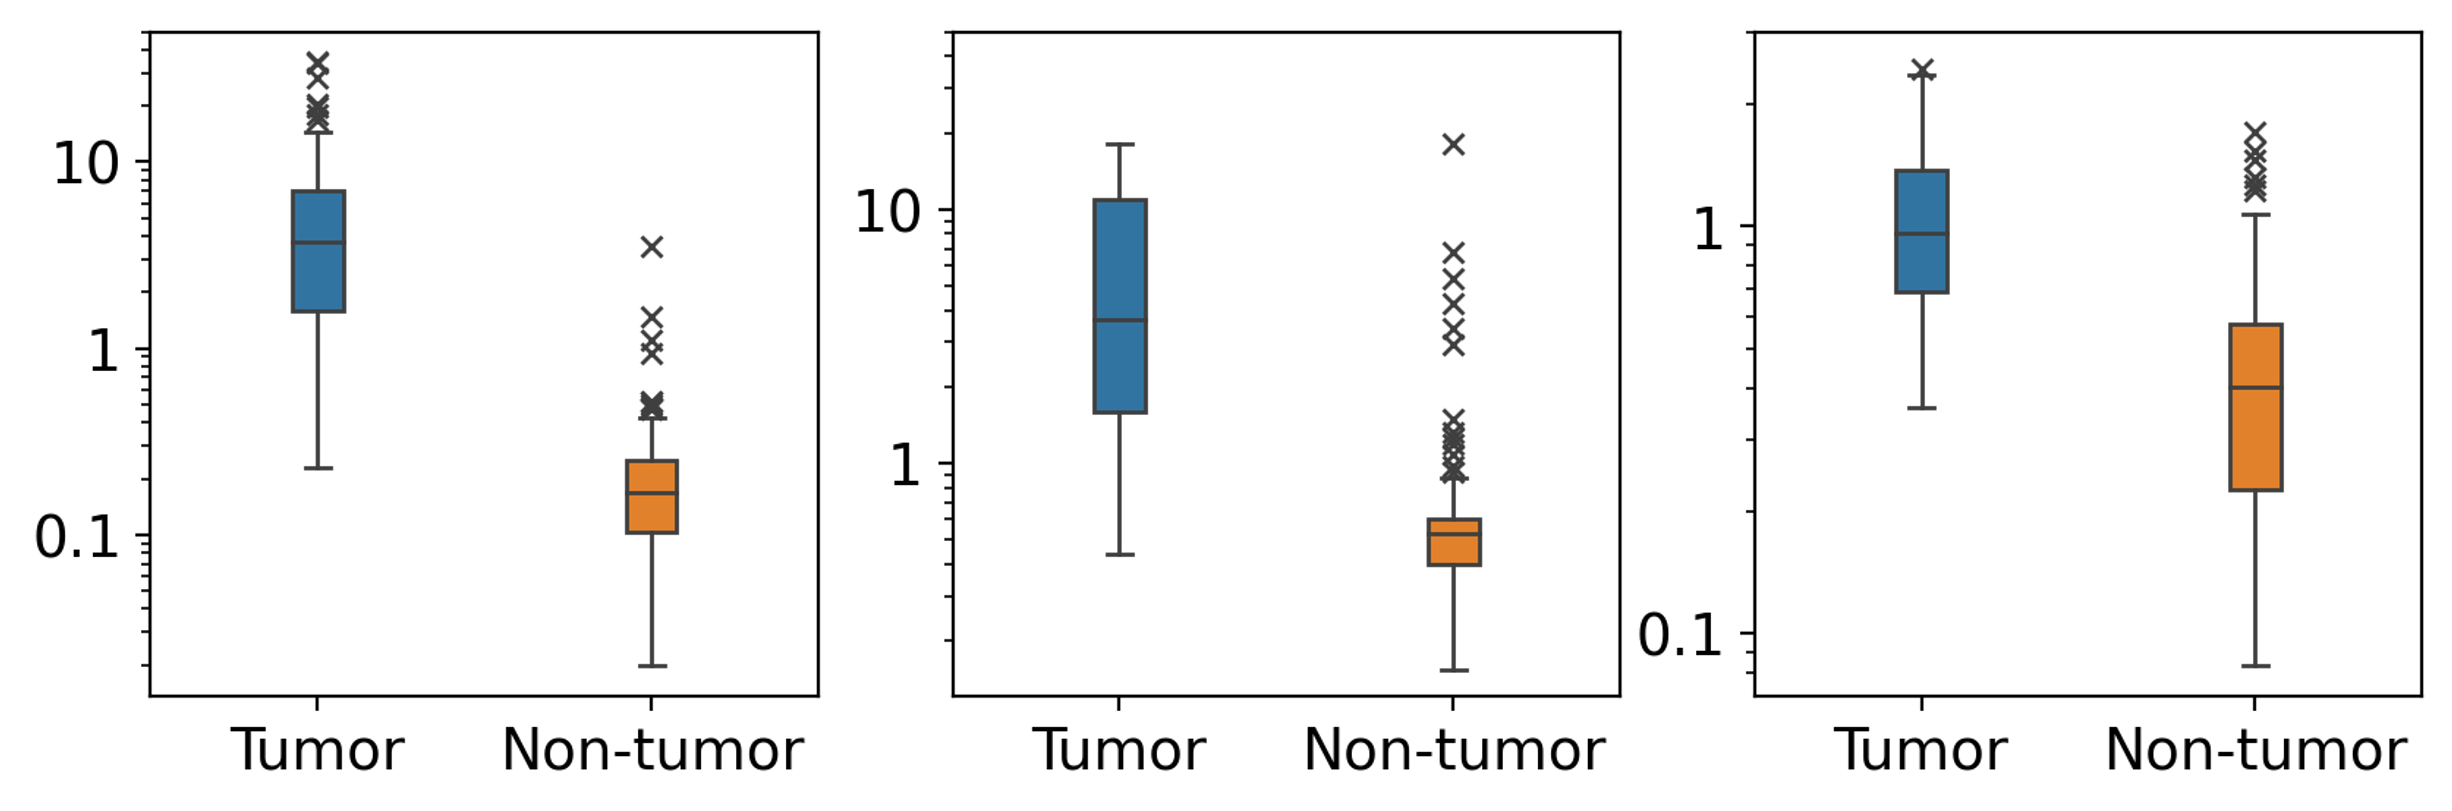
Figure 3. Box plot of averaged kinetic parameters within tumor and non-tumor areas. Left to right: Ktrans, kep, ve. Tumor: tumor region in breast cancer patients. Non-tumor: bilateral (if applicable) breast tissue in breast cancer patients.
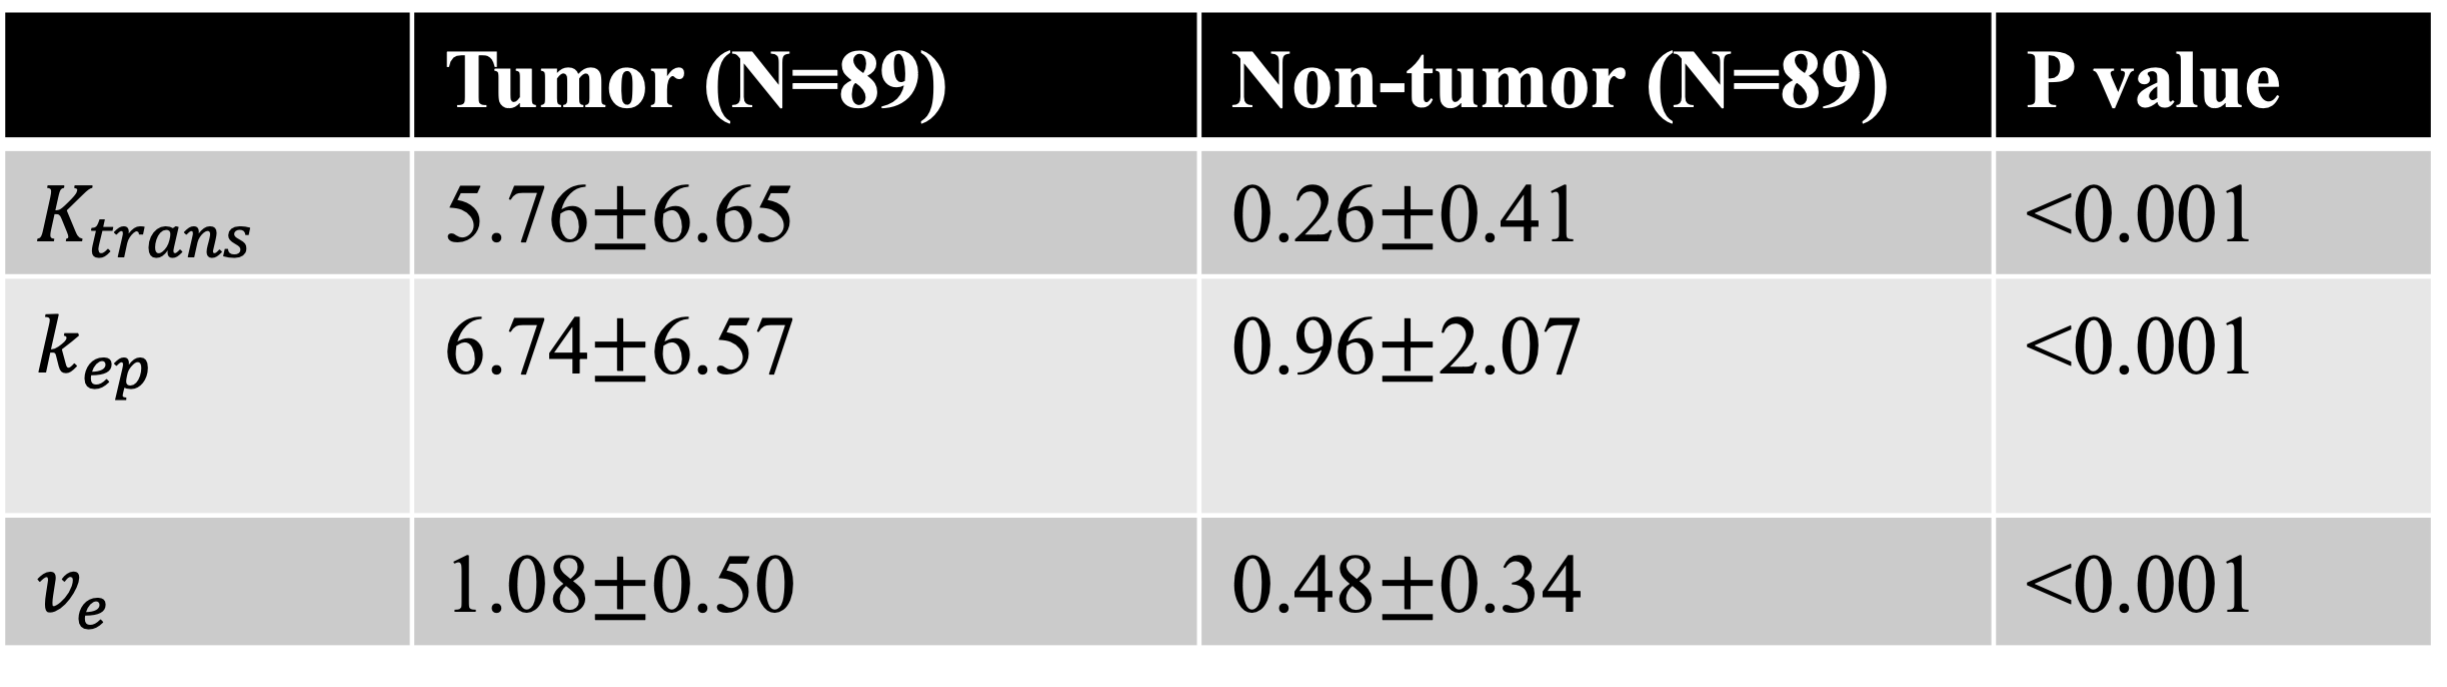
Table 1. ROI statistics and Wilcoxon Signed Rank test results of retrospectively estimated pharmacokinetic parameters
DOI: https://doi.org/10.58530/2023/3071