3068
Automated Localization of the Extracranial Carotid Artery in Black Blood Contrast MR Images Using a Deep Learning Approach1Radiology and Imaging Sciences, University of Utah, SALT LAKE CITY, UT, United States, 2Department of Radiology, University of Washington, Seattle, WA, United States, 3Radiology, Zagazig University, Zagazig, Egypt
Synopsis
Keywords: Machine Learning/Artificial Intelligence, Cardiovascular, Vessel Wall Imaging
In this work, a deep learning approach for automated localization of carotid arteries in black blood contrast MR data is proposed. This is the first step in automated analysis of vessel wall imaging data. Carotid arteries supply oxygenated blood to the brain and are susceptible to atherosclerosis, so their vessel wall imaging is of significant importance in clinical evaluations. However, currently only qualitative assessment of VW imaging data relying on visual inspection is implemented in clinics that are not scaleable. Therefore, developing automated image processing tools to quantitatively analyze vessel wall imaging data can have a major clinical impact.Introduction
Vessel wall (VW) magnetic resonance imaging (MRI), using black blood contrast, provides valuable information on diseased arteries and atherosclerotic lesions. Vessel wall imaging of carotid arteries is of significant importance in clinical evaluations as they supply oxygenated blood to the brain and are susceptible to atherosclerosis. However, currently only qualitative assessment of VW imaging data relying on visual inspection is implemented in clinics that are time-consuming, prone to inter-rater variability, deficient due to the size and complexity of imaging data and lack of enough trained/experienced radiologists to interpret them. Therefore, developing automated image processing tools to quantitatively analyze vessel wall imaging data can have a major clinical impact. This work focuses on the first step in automated analysis of the carotid VW imaging data, which is the localization of carotid arteries. We propose a deep learning (DL) method trained and tested using imaging data of a fast 3D carotid black blood MRI sequence, called 3D motion sensitized driven equilibrium prepared rapid gradient Echo (3D-MERGE)[1]. The proposed approach might be applied to other similar vascular imaging data.Materials and Methods
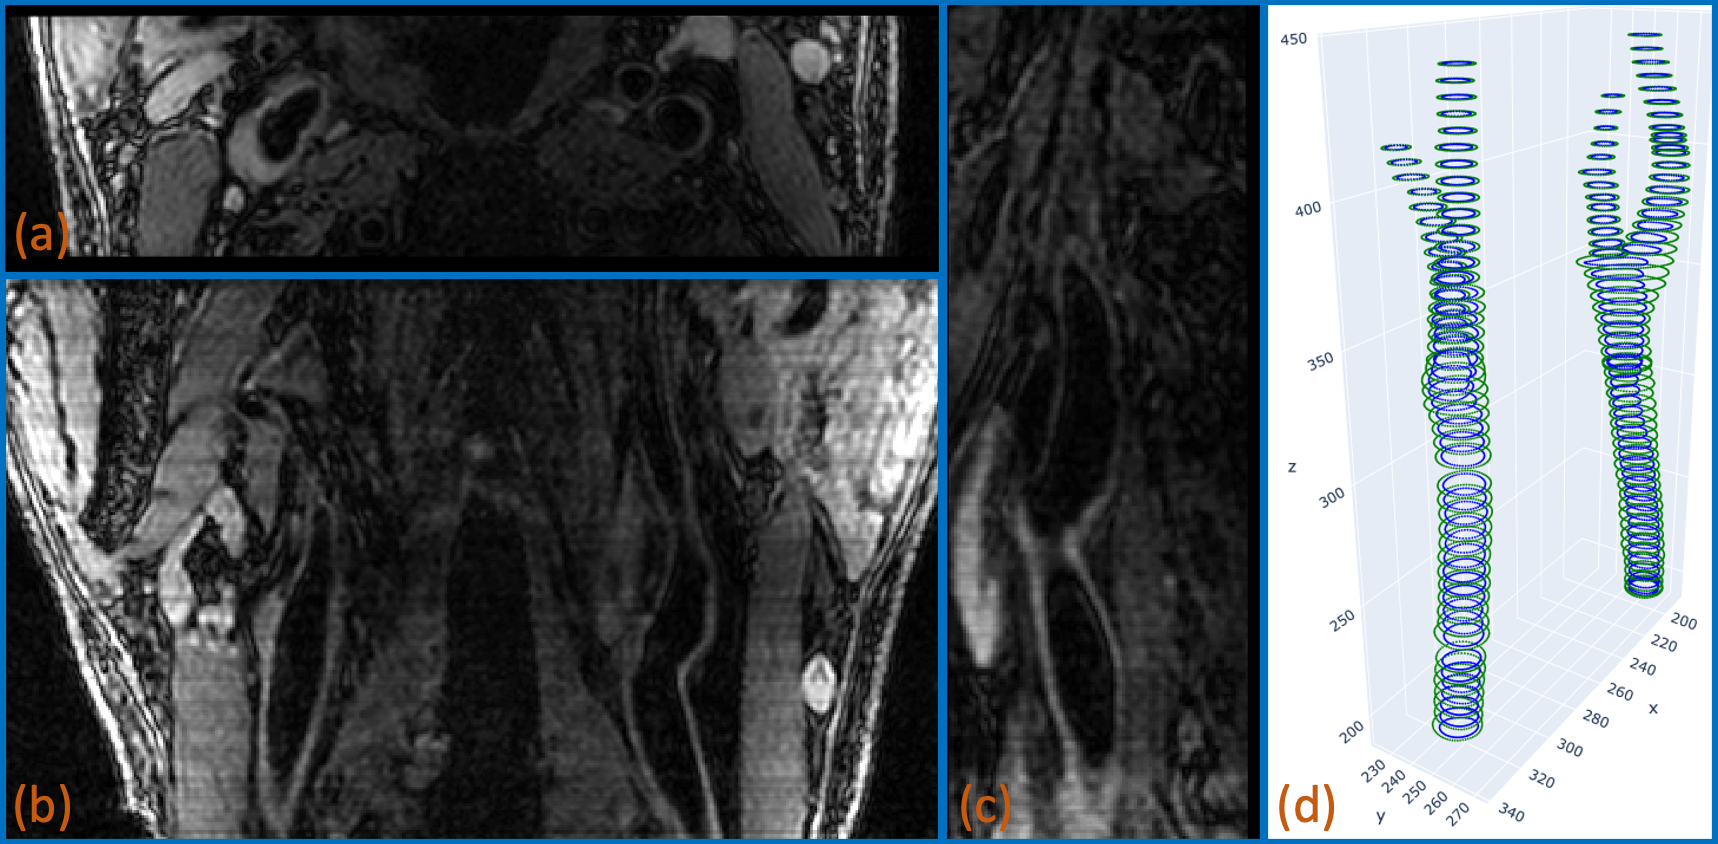
1) Vessel Wall Imaging DataThe data used in this work are from CARE-II study[2], in which Chinese patients with recent ischemic stroke or transient ischemia were imaged. The vessel wall imaging data of 50 subjects, acquired using the 3D MERGE sequence, were used in training and testing the deep learning methods. We note that the same data were used in a carotid vessel wall segmentation challenge[3] sponsored by international conference on medical image computing and computer assisted intervention (MICCAI). For each subject, the original scan was coronal, but the 3D imaging data were resliced axially with the typical matrix size of 720x100x720 and isotropic voxel size of 0.34 mm$$$^3$$$. The contours of the lumen and outer vessel wall of left and right carotid arteries were semi-manually drawn at about 20% of axial slices for training. The contours were available in a customized vessel wall annotation software (CASCADE)[4] format. In Fig. 1, an example of 3D MERGE imaging data and the corresponding lumen and outer wall contours are shown.
2) Bifurcation Detection
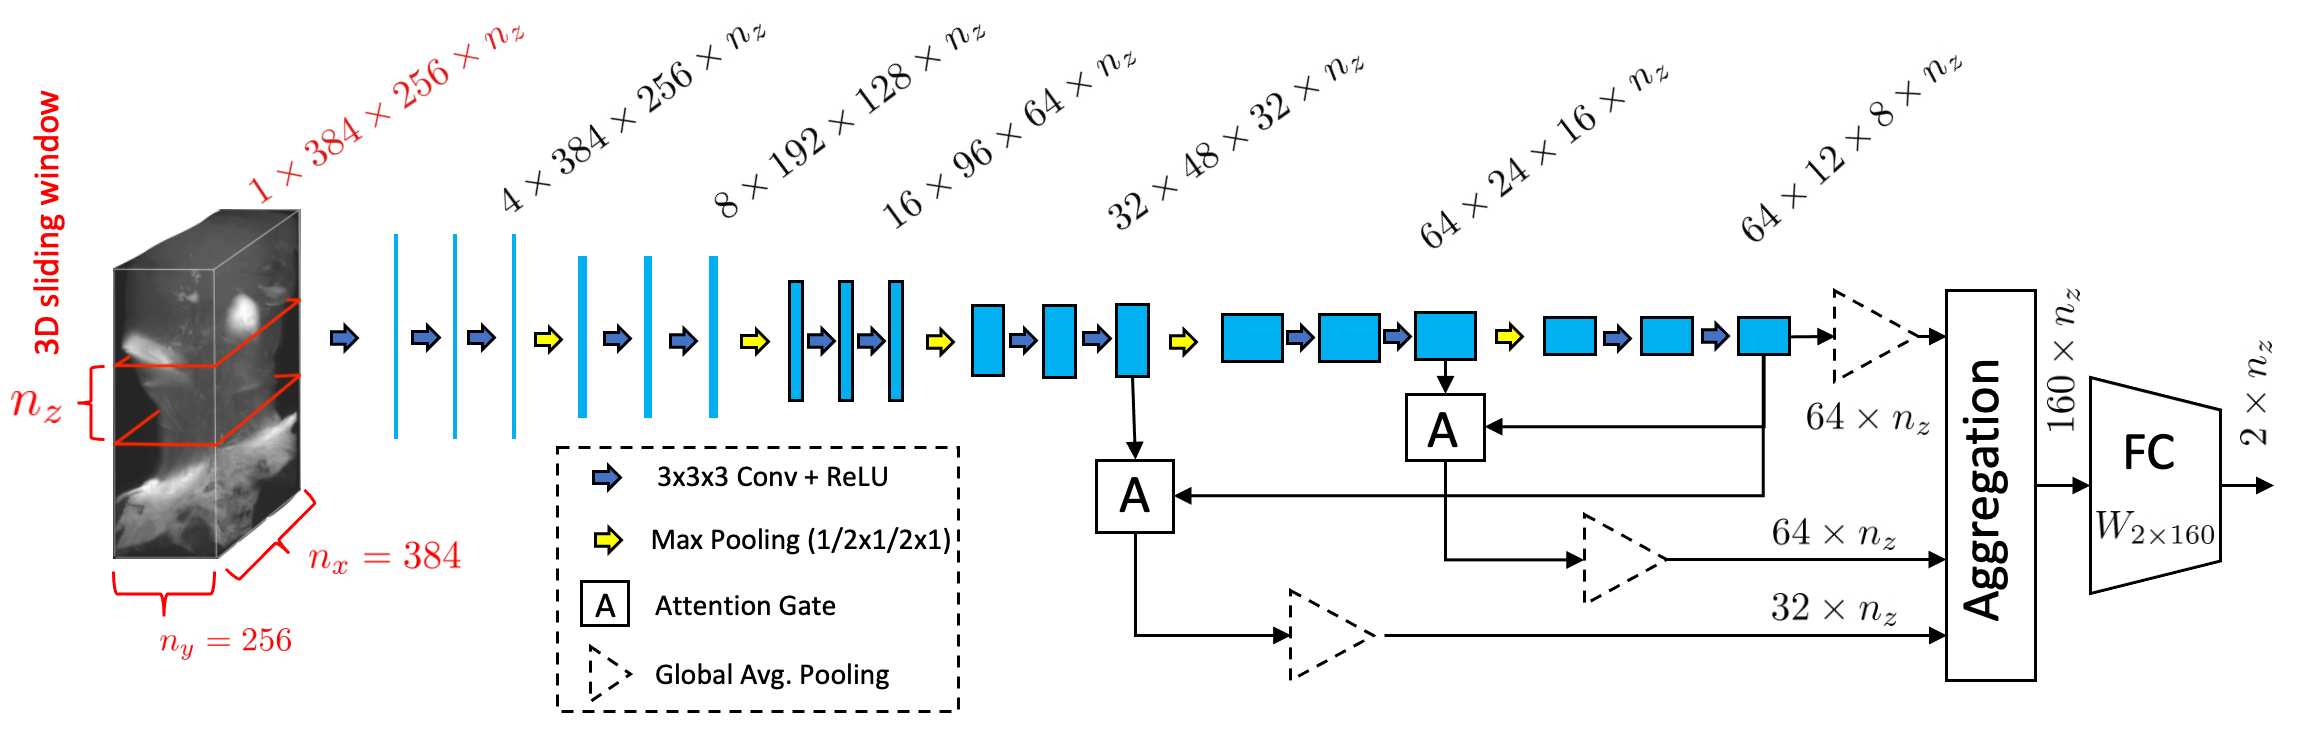
In this work, we perform the localization of carotid arteries by coarse estimation of 3D binary masks of the lumens. To limit the localization processing to a region of interest, in the first step, 3D bounding boxes containing right and left carotid arteries are extracted by detecting axial slices corresponding to the right and left bifurcations. We use a 3D Attention-Gated Sononet[5] architecture, as illustrated in Fig. 2, to detect the right and left bifurcations. The network is fully convolutional in the slice direction and generates two scores corresponding to the right and left bifurcations, respectively. Slices with maximum scores are identified as bifurcation locations. This network was trained/tested using 42/8 subjects' imaging data. The training was done using cross entropy loss function and the data were enhanced by 3D sliding windows, random rotation, and random flipping.
3) Carotid Localization Using Lumen Detection
After bifurcation detection, a 3D bounding box covering bifurcation areas and carotid arteries in distal and proximal directions can be extracted for the localization task. We use a 3D-UNet architecture for the lumen localization. Designing a good loss function is the challenging part of this task as the output of the network is a 3D binary mask, whereas the lumen and outer wall labels are sparse contours. We use three terms in the loss functions:
- Euclidean distance loss: This loss is implemented by using convolutional edge detectors and convolutional distance transforms to minimize the distance between edges of 3D binary mask and lumen contours drawn manually and vise versa.
- Cross entropy loss: This loss is applied in the lumen and outer wall areas at the slices where the labels are available.
- Active contour energy loss: We use a 3D Chan-Vese model to ensure consistency of signal intensity inside the lumen mask and inside a narrow band around the lumen mask, and also smoothness of the lumen surface.
4) Connected Component Analysis
After lumen detection, the predicted 3D binary mask is refined by using connected component analysis:
- The smaller connected components are removed.
- The holes in the connected components are filled.
- The connected component that don't have 3D y-shape are removed.
- Two remaining connected components that match closely are labeled as two lumen masks.
Results
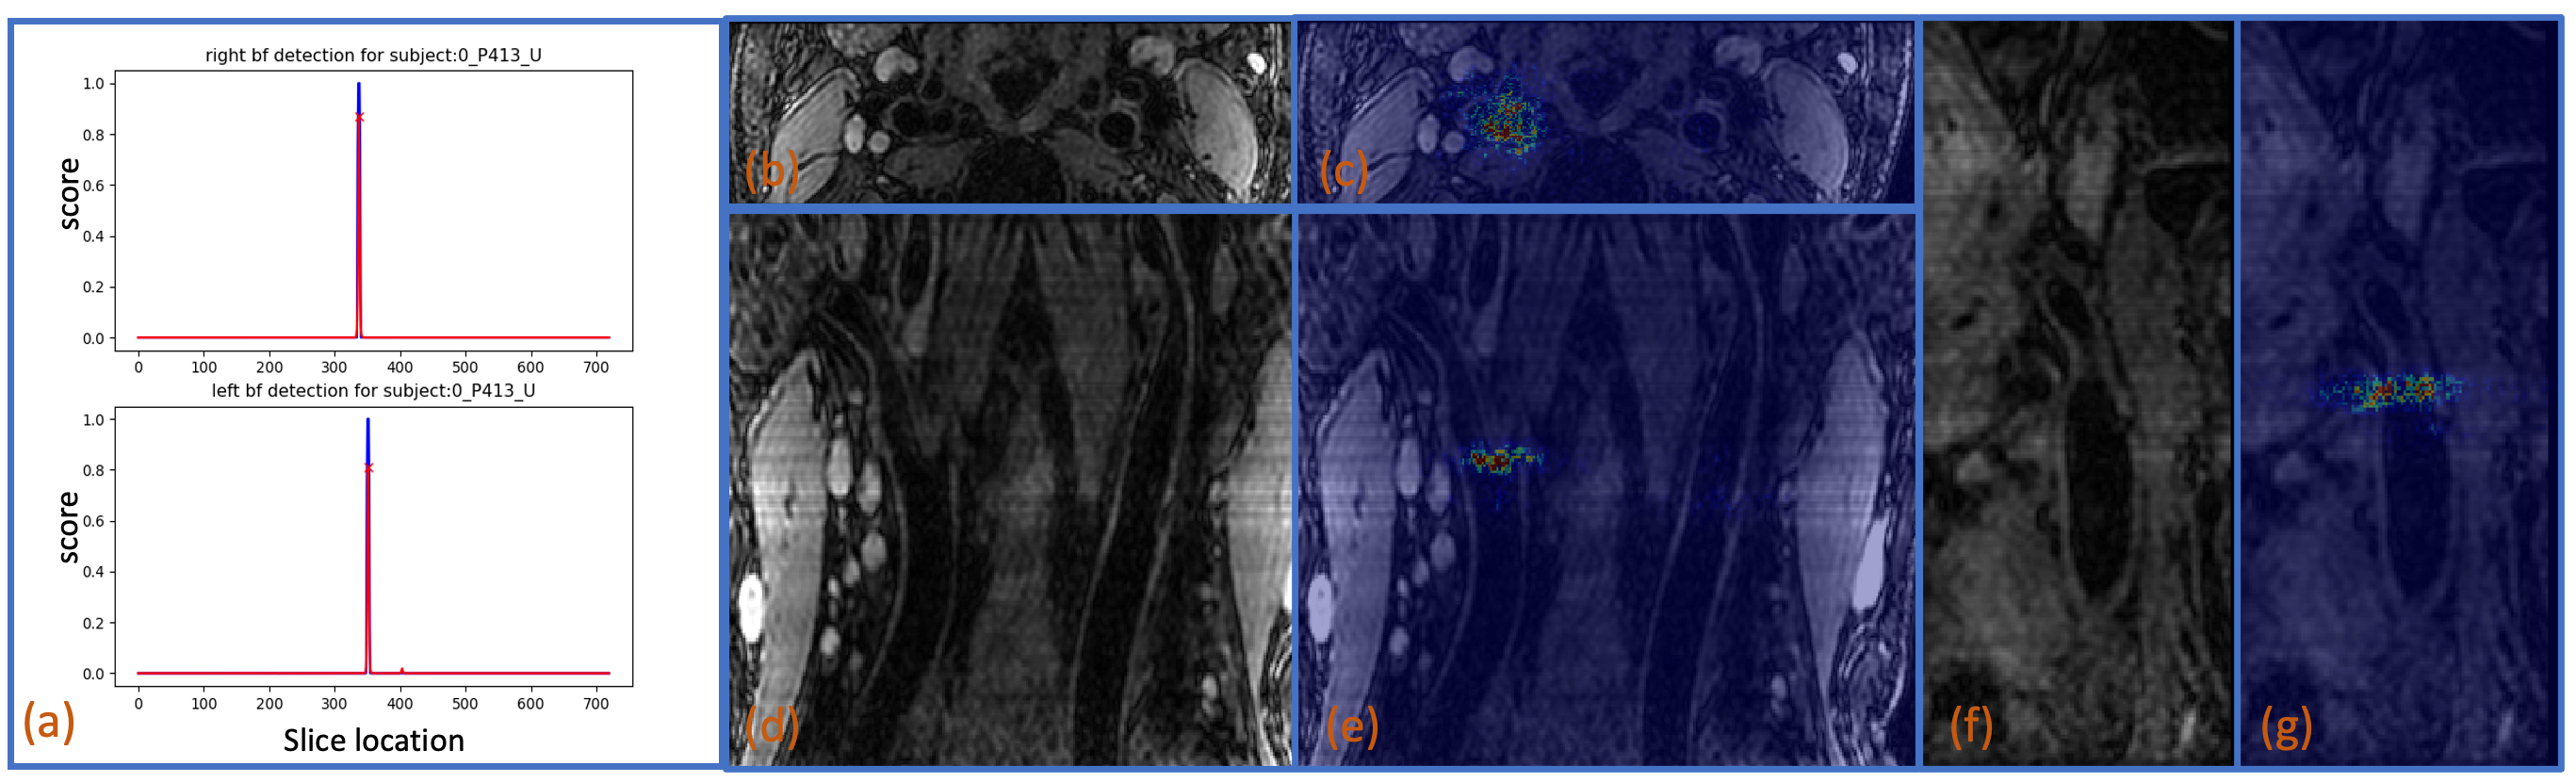
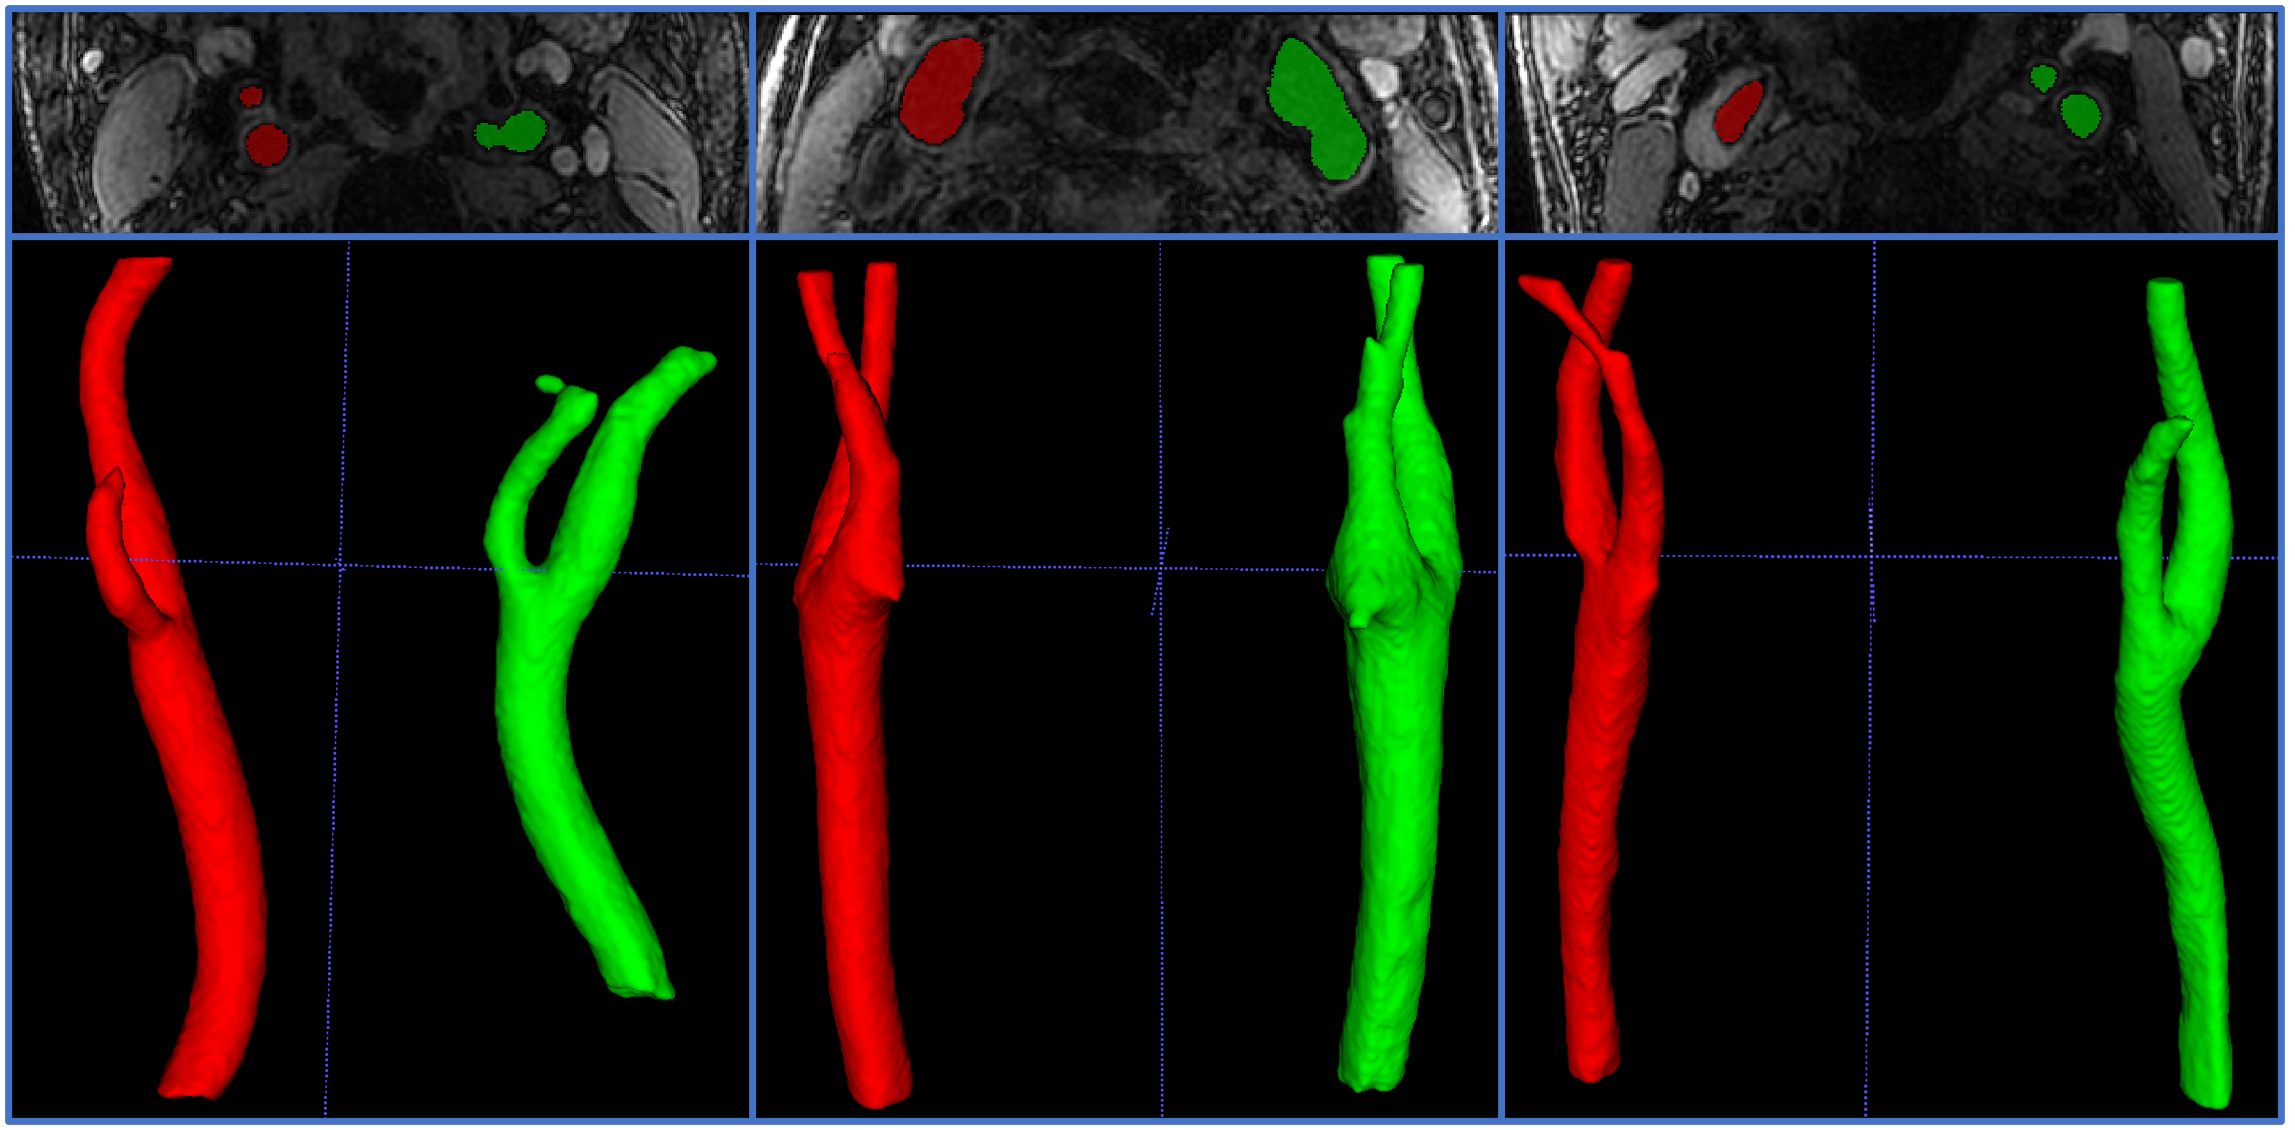
In Fig. 3 (a), ground truth and predicted scores by the bifurcation detection network for a test subject are shown. Similar results are observed for other test subjects. In Fig. 3 (b-g), the activation (saliency) maps of the bifurcation detection for the same test subject are shown.In Fig. 4, the lumen localization results for three test subjects are shown. Similar results are observed for other test subjects.
Conclusions
We proposed a novel deep learning method for automated localization of carotid arteries, which is the first step in automated analysis of vessel wall imaging data. The proposed method was trained/tested using 3D VW imaging data but is applicable to other similar problems.Acknowledgements
No acknowledgement found.References
[1] Balu, N., Yarnykh, V.L., Chu, B., Wang, J., Hatsukami, T. and Yuan, C. (2011), Carotid plaque assessment using fast 3D isotropic resolution black-blood MRI. Magn. Reson. Med., 65: 627-637. https://doi.org/10.1002/mrm.22642
[2] Zhao X, Li R, Hippe DS, et al. Chinese Atherosclerosis Risk Evaluation (CARE II) study: a novel cross-sectional, multicentre study of the prevalence of high-risk atherosclerotic carotid plaque in Chinese patients with ischaemic cerebrovascular events—design and rationaleStroke and Vascular Neurology 2017;2:doi: 10.1136/svn-2016-000053
[3] Chun Yuan, Li Chen, Niranjan Balu, Mahmud Mossa-Basha, Jenq-Neng, David Saloner, & Peter Douglas. (2021). Carotid Vessel Wall Segmentation Challenge. International Conference on Medical Image Computing and Computer Assisted Intervention (MICCAI). https://doi.org/10.5281/zenodo.4575301
[4] Kerwin, W. , Xu, D. , Liu, F. , Saam, T. , Underhill, H. , Takaya, N. , Chu, B. , Hatsukami, T. & Yuan, C. (2007). Magnetic Resonance Imaging of Carotid Atherosclerosis. Topics in Magnetic Resonance Imaging, 18 (5), 371-378. doi: 10.1097/rmr.0b013e3181598d9d.
[5] Schlemper, Jo, et al. Attention-gated networks for improving ultrasound scan plane detection. arXiv preprint arXiv:1804.05338 (2018).
Figures