3065
Intracranial Wall Permeability for Prediction of Aneurysm Growth Using Dynamic Contrast-Enhanced MRI1Center for Biomedical Imaging Research, School of Medicine, Tsinghua University, Beijing, China, 2Department of Neurosurgery, Beijing Tiantan Hospital, Beijing Neurosurgical Institute, Capital Medical University, Beijing, China
Synopsis
Keywords: Data Analysis, DSC & DCE Perfusion
Size of intracranial aneurysm (IA) is considered the most important clinical factor to determine the risk of IA rupture. Accurate prediction of aneurysm growth is crucial for preventive management but remains challenging. Herein, we studied the potential predictive roles of demography and imaging characteristics in a radiological follow-up study. And wall permeability calculated by DCE-MRI was firstly observed to accurately identify the IAs with a relatively high risk of aneurysm growth (AUC = 0.875). Our study demonstrated that higher wall permeability was associated with aneurysm growth and the regions with higher wall permeability co-localized with the direction of aneurysm growth.Introduction
Intracranial aneurysm (IA), as a life-threatening disease, occurs in around 3% of the adult population1. The International Study of Unruptured Intracranial Aneurysms reported that the risk of IA rupture increases with the increased IA size2. Therefore, identifying the risk factors for IA growth is important for preventive management but remains challenging. The Population, Hypertension, Age, Size, Earlier Subarachnoid Hemorrhage, and Site (PHASES) score has been reported to be associated with IA growth3, but is not suitable for all population. Recently, aneurysm wall permeability calculated by dynamic contrast-enhanced magnetic resonance images (DCE-MRI) has newly emerged as a quantitative marker of aneurysm wall remodeling4, 5. In this study, we aimed to investigate whether the aneurysm wall permeability, along with othe aneurysm characteristics could predict aneurysm growth accurately.Methods
Subjects: This study was approved by the Ethics Committee of Tsinghua University, and all patients provided written informed consent. Patients with unruptured non-saccular IA≥5 mm in size, clinically diagnosed by DSA, CTA, or MRA, were referred to this IRB-approved study with informed consent. Exclusion criteria were any contraindications to MR imaging or gadolinium contrast. All enrolled patients had ≥ 3 months radiological follow-up and the time-interval for follow-up imaging was determined by the neurosurgeon.Imaging Protocol: Patients were imaged at baseline and at follow-up on a 3T MR scanner (Ingenia CX, Philips Healthcare, Best, the Netherlands) using a 32-channel head coil. The aneurysm was first located by a 3D time of flight (TOF) sequence. A 3D black-blood T1-weighted volume isotropic turbo spin-echo acquisition (VISTA) sequence6 was performed to acquire precontrast vessel wall images with the following parameters: TR/TE = 800/20.7 ms, voxel size = 0.6 * 0.6 * 0.6 mm3, 133 transverse slices. DCE-MRI was then acquired with the imaging slab centered on the target aneurysm: TR/TE = 6.7/3.3 ms, , spatial resolution = 0.8 × 0.8 mm2, slice thickness = 1 mm. After DCE MRI, the VISTA sequence was repeated to acquire postcontrast vessel wall images with the same imaging parameters mentioned above.
Imaging Analysis: Aneurysm size was defined as the maximum width or height measured on the slice demonstrating the largest aneurysm on precontrast vessel wall images and aneurysm growth was defined as growth ≥ 0.5 mm in at least 1 direction3. Pharmacokinetics of the contrast agent were analyzed using the extended Kety/Tofts model7:
$$C(t)=K^{trans}\int_{0}^{t}{e^{-K^{trans}/V_e\times\left(t-\tau\right)}C_p\left(\tau\right)d\tau+V_pC_p\left(t\right)}$$
where C(t) is the contrast agent concentration in tissue, Ktrans (min-1) represents the transfer rate of contrast agent from the intravascular space to the extravascular space, Ve is the extracellular extravascular fractional volume, Cp(t) is the arterial input function which was extracted from the aneurysm, and Vp represents the fractional plasma volume. The kinetic model was fitted using the least-squares method. The slice demonstrating the largest Ktrans was selected and the regions adjacent the target aneurysm was defined as regions of interest (ROI)5. Mean Ktrans within the chosen ROI was used to characterize aneurysm wall permeability. Additionally, the aneurysm wall regions of the same slice on pre- and postcontrast VISTA images were also drawn as ROIs and wall enhancement index (WEI) was then calculated (Figure 1)8:
$$WEI=\frac{\frac{{SI\_wall}_{postcontrast}}{{SI\_brain}_{postcontrast}}-\frac{{SI\_wall}_{precontrast}}{{SI\_brain}_{precontrast}}}{\frac{{SI\_wall}_{precontrast}}{{SI\_brain}_{precontrast}}}$$
where SI_brainprecontrast and SI_brainpostcontrast were extracted from normal brain parenchyma to normalize the signal intensity. ROI segmentation and post-processing analysis were performed using a dedicated software (CASCADE, UW, Seattle, Washington, USA) and MATLAB (MathWorks, Natick, Massachusetts, USA), separately.
Statistical Analysis: Variables were expressed as n (%) or median (interquartile range, [IQR]). Two-tailed independent student’s t test was performed to compare imaging characteristic including aneurysm size, Ktrans and WEI between baseline and follow-up. Receiver operating characteristics (ROC) analyses were applied to test performance of the demography and aneurysm characteristics at baseline in predicting aneurysm growth. P-value < 0.05 was interpreted to carry statistical significance and all statistical analyses were performed using MATLAB.
Results
Fifteen patients with unruptured aneurysms were included in our study. Patient demographics, clinical presentations and imaging characteristics are summarized in Table 1. The size of aneurysm at a median follow-up of 4.0 months significantly increased compared with baseline (median: 7.3 mm vs. 8.6 mm), while there was no significant change in Ktrans and WEI (Figure 2). The receiver operating characteristics (ROC) curves of the aneurysm growth are shown in Figure 3. The area under the ROC curve (AUC) of Ktrans at baseline was significantly larger than any other predictor and achieved 0.875 (95% CI: 0.605-0.986), which indicated that Ktrans could identify the aneurysms with a relatively high risk of aneurysm growth accurately. Additionally, Figure 4 shows the vessel wall images and inhomogeneous Ktrans maps of one patient who had aneurysmal rupture 1 month after follow-up. Notably, the region with high Ktrans apparently correlated with the direction of aneurysm growth.Discussion and Conclusion
Our results indicated that Ktrans calculated by DCE-MRI had outstanding predictive ability of aneurysm growth. In addition, the regions with higher Ktrans co-localized with the direction of aneurysm growth. Since Ktrans is related to inflammatory cell infiltration5, this result might reveal that the aneurysm growth is associated with the inflammatory conditions of the aneurysm wall. More patients, longer follow-up time and radiologic-pathologic correlation studies are critically needed to confirm our findings and elucidate the underlying pathophysiologic mechanism.Acknowledgements
None.References
1. Vlak MH, Algra A, Brandenburg R, Rinkel GJ. Prevalence of unruptured intracranial aneurysms, with emphasis on sex, age, comorbidity, country, and time period: a systematic review and meta-analysis. Lancet Neurol 2011;10:626-636.
2. Wiebers DO, Whisnant JP, Huston J, 3rd, Meissner I, Brown RD, Jr., Piepgras DG, Forbes GS, et al. Unruptured intracranial aneurysms: natural history, clinical outcome, and risks of surgical and endovascular treatment. Lancet 2003;362:103-110.
3. Backes D, Vergouwen MD, Tiel Groenestege AT, Bor AS, Velthuis BK, Greving JP, Algra A, et al. PHASES Score for Prediction of Intracranial Aneurysm Growth. Stroke 2015;46:1221-1226.
4. Vakil P, Ansari SA, Cantrell CG, Eddleman CS, Dehkordi FH, Vranic J, Hurley MC, et al. Quantifying Intracranial Aneurysm Wall Permeability for Risk Assessment Using Dynamic Contrast-Enhanced MRI: A Pilot Study. AJNR Am J Neuroradiol 2015;36:953-959.
5. Qi H, Liu X, Liu P, Yuan W, Liu A, Jiang Y, Li Y, et al. Complementary Roles of Dynamic Contrast-Enhanced MR Imaging and Postcontrast Vessel Wall Imaging in Detecting High-Risk Intracranial Aneurysms. AJNR Am J Neuroradiol 2019;40:490-496.
6. Qiao Y, Steinman DA, Qin Q, Etesami M, Schar M, Astor BC, Wasserman BA. Intracranial arterial wall imaging using three-dimensional high isotropic resolution black blood MRI at 3.0 Tesla. J Magn Reson Imaging 2011;34:22-30.
7. Tofts PS, Brix G, Buckley DL, Evelhoch JL, Henderson E, Knopp MV, Larsson HB, et al. Estimating kinetic parameters from dynamic contrast-enhanced T(1)-weighted MRI of a diffusable tracer: standardized quantities and symbols. J Magn Reson Imaging 1999;10:223-232.
8. Omodaka S, Endo H, Niizuma K, Fujimura M, Inoue T, Sato K, Sugiyama SI, et al. Quantitative Assessment of Circumferential Enhancement along the Wall of Cerebral Aneurysms Using MR Imaging. AJNR Am J Neuroradiol 2016;37:1262-1266.
Figures
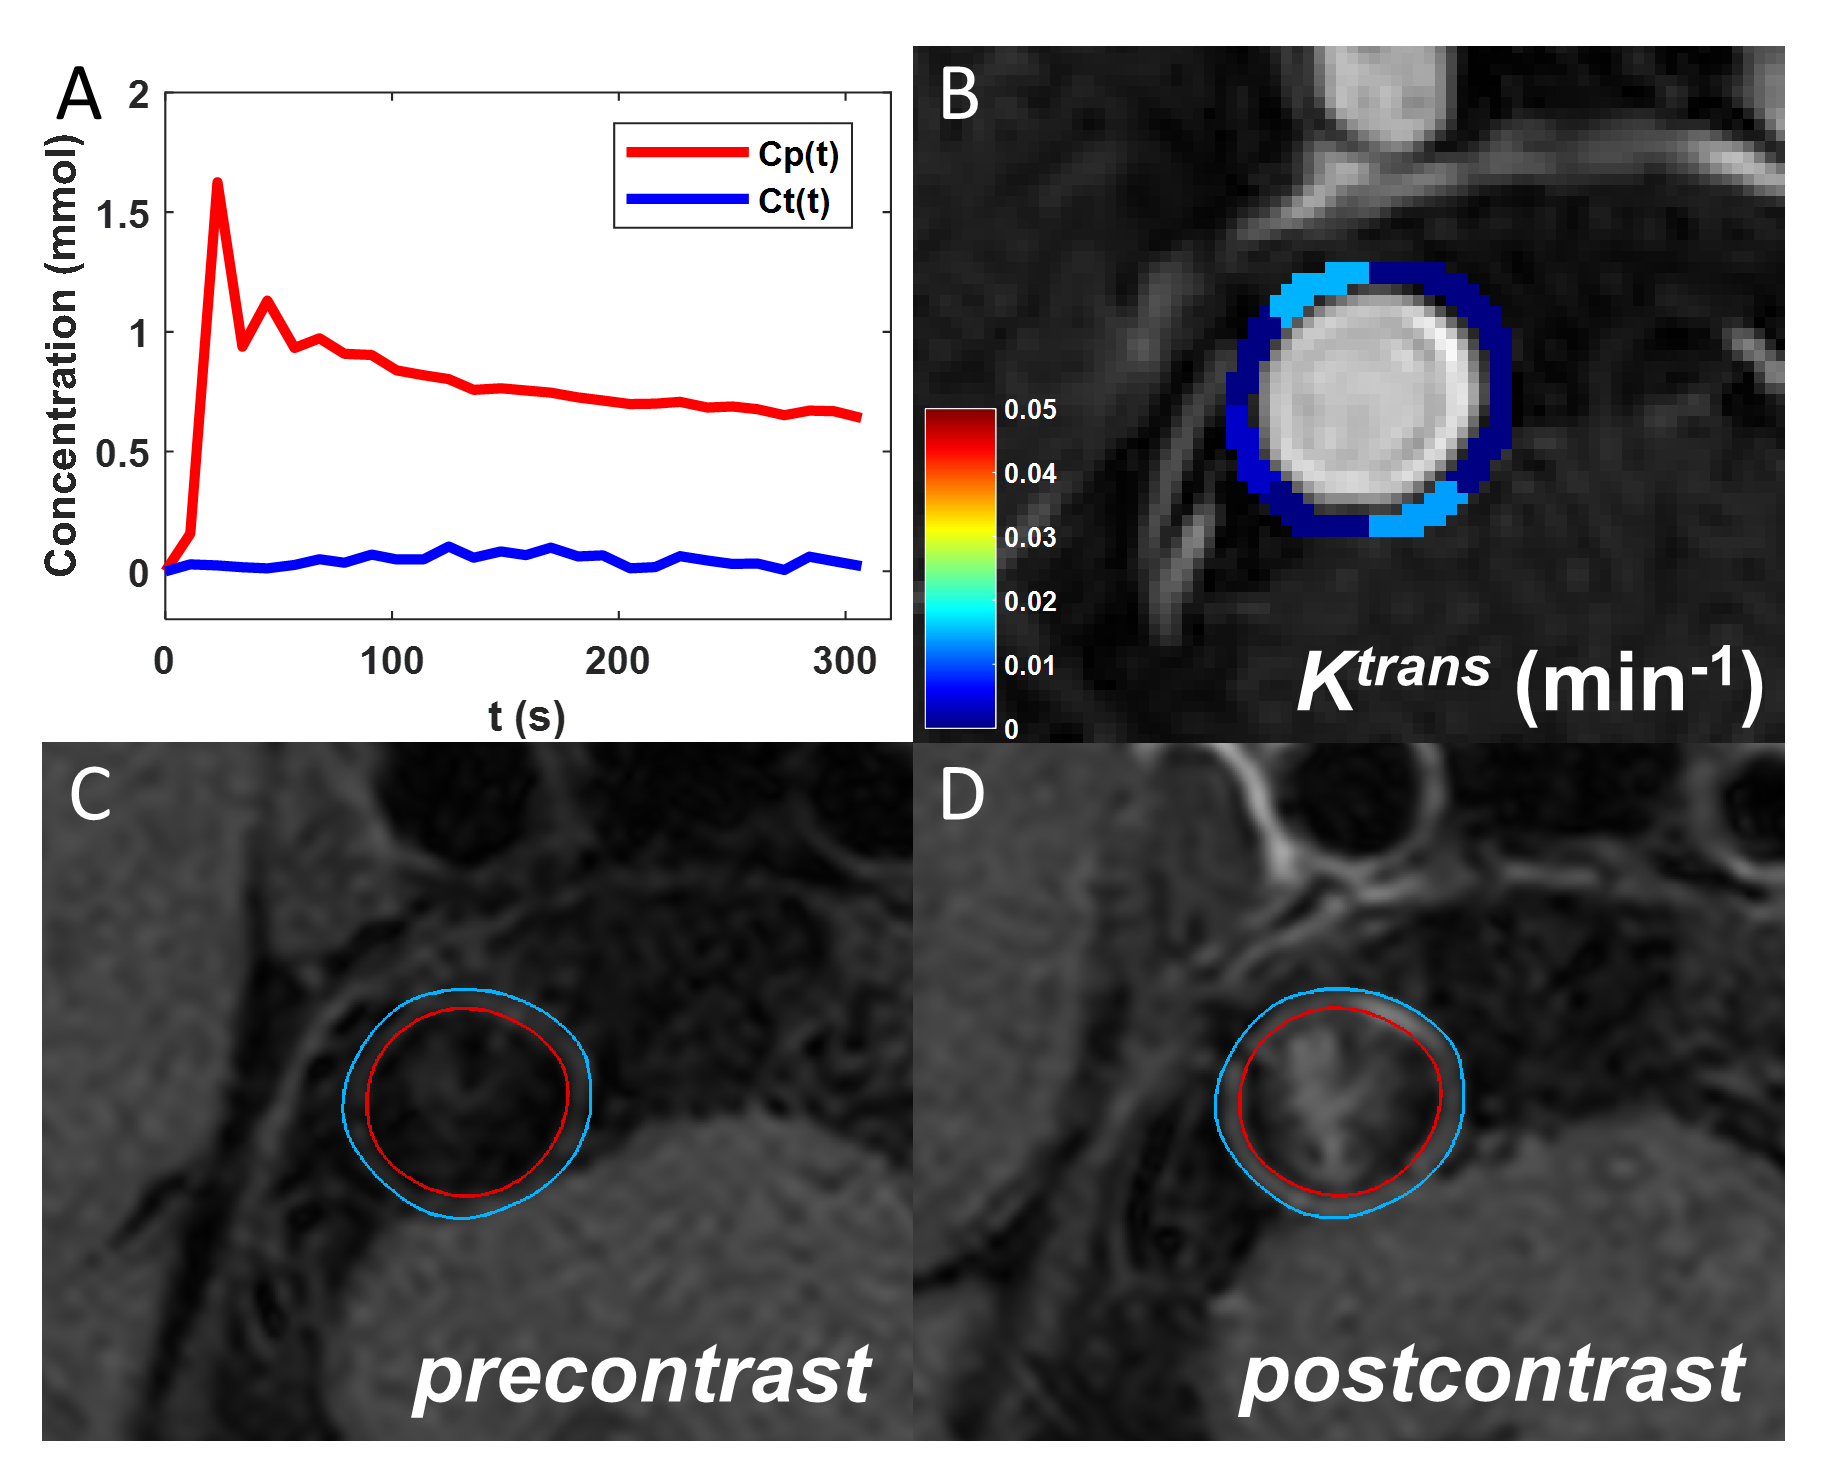
Figure 1. Measuring wall permeability by DCE-MRI and aneurysm wall enhancement by pre- and postcontrast vessel wall images. Representative contrast concentration in aneurysm and aneurysm wall (A), generated Ktrans map (B), precontrast (C) and postcontrast (D) vessel wall images.
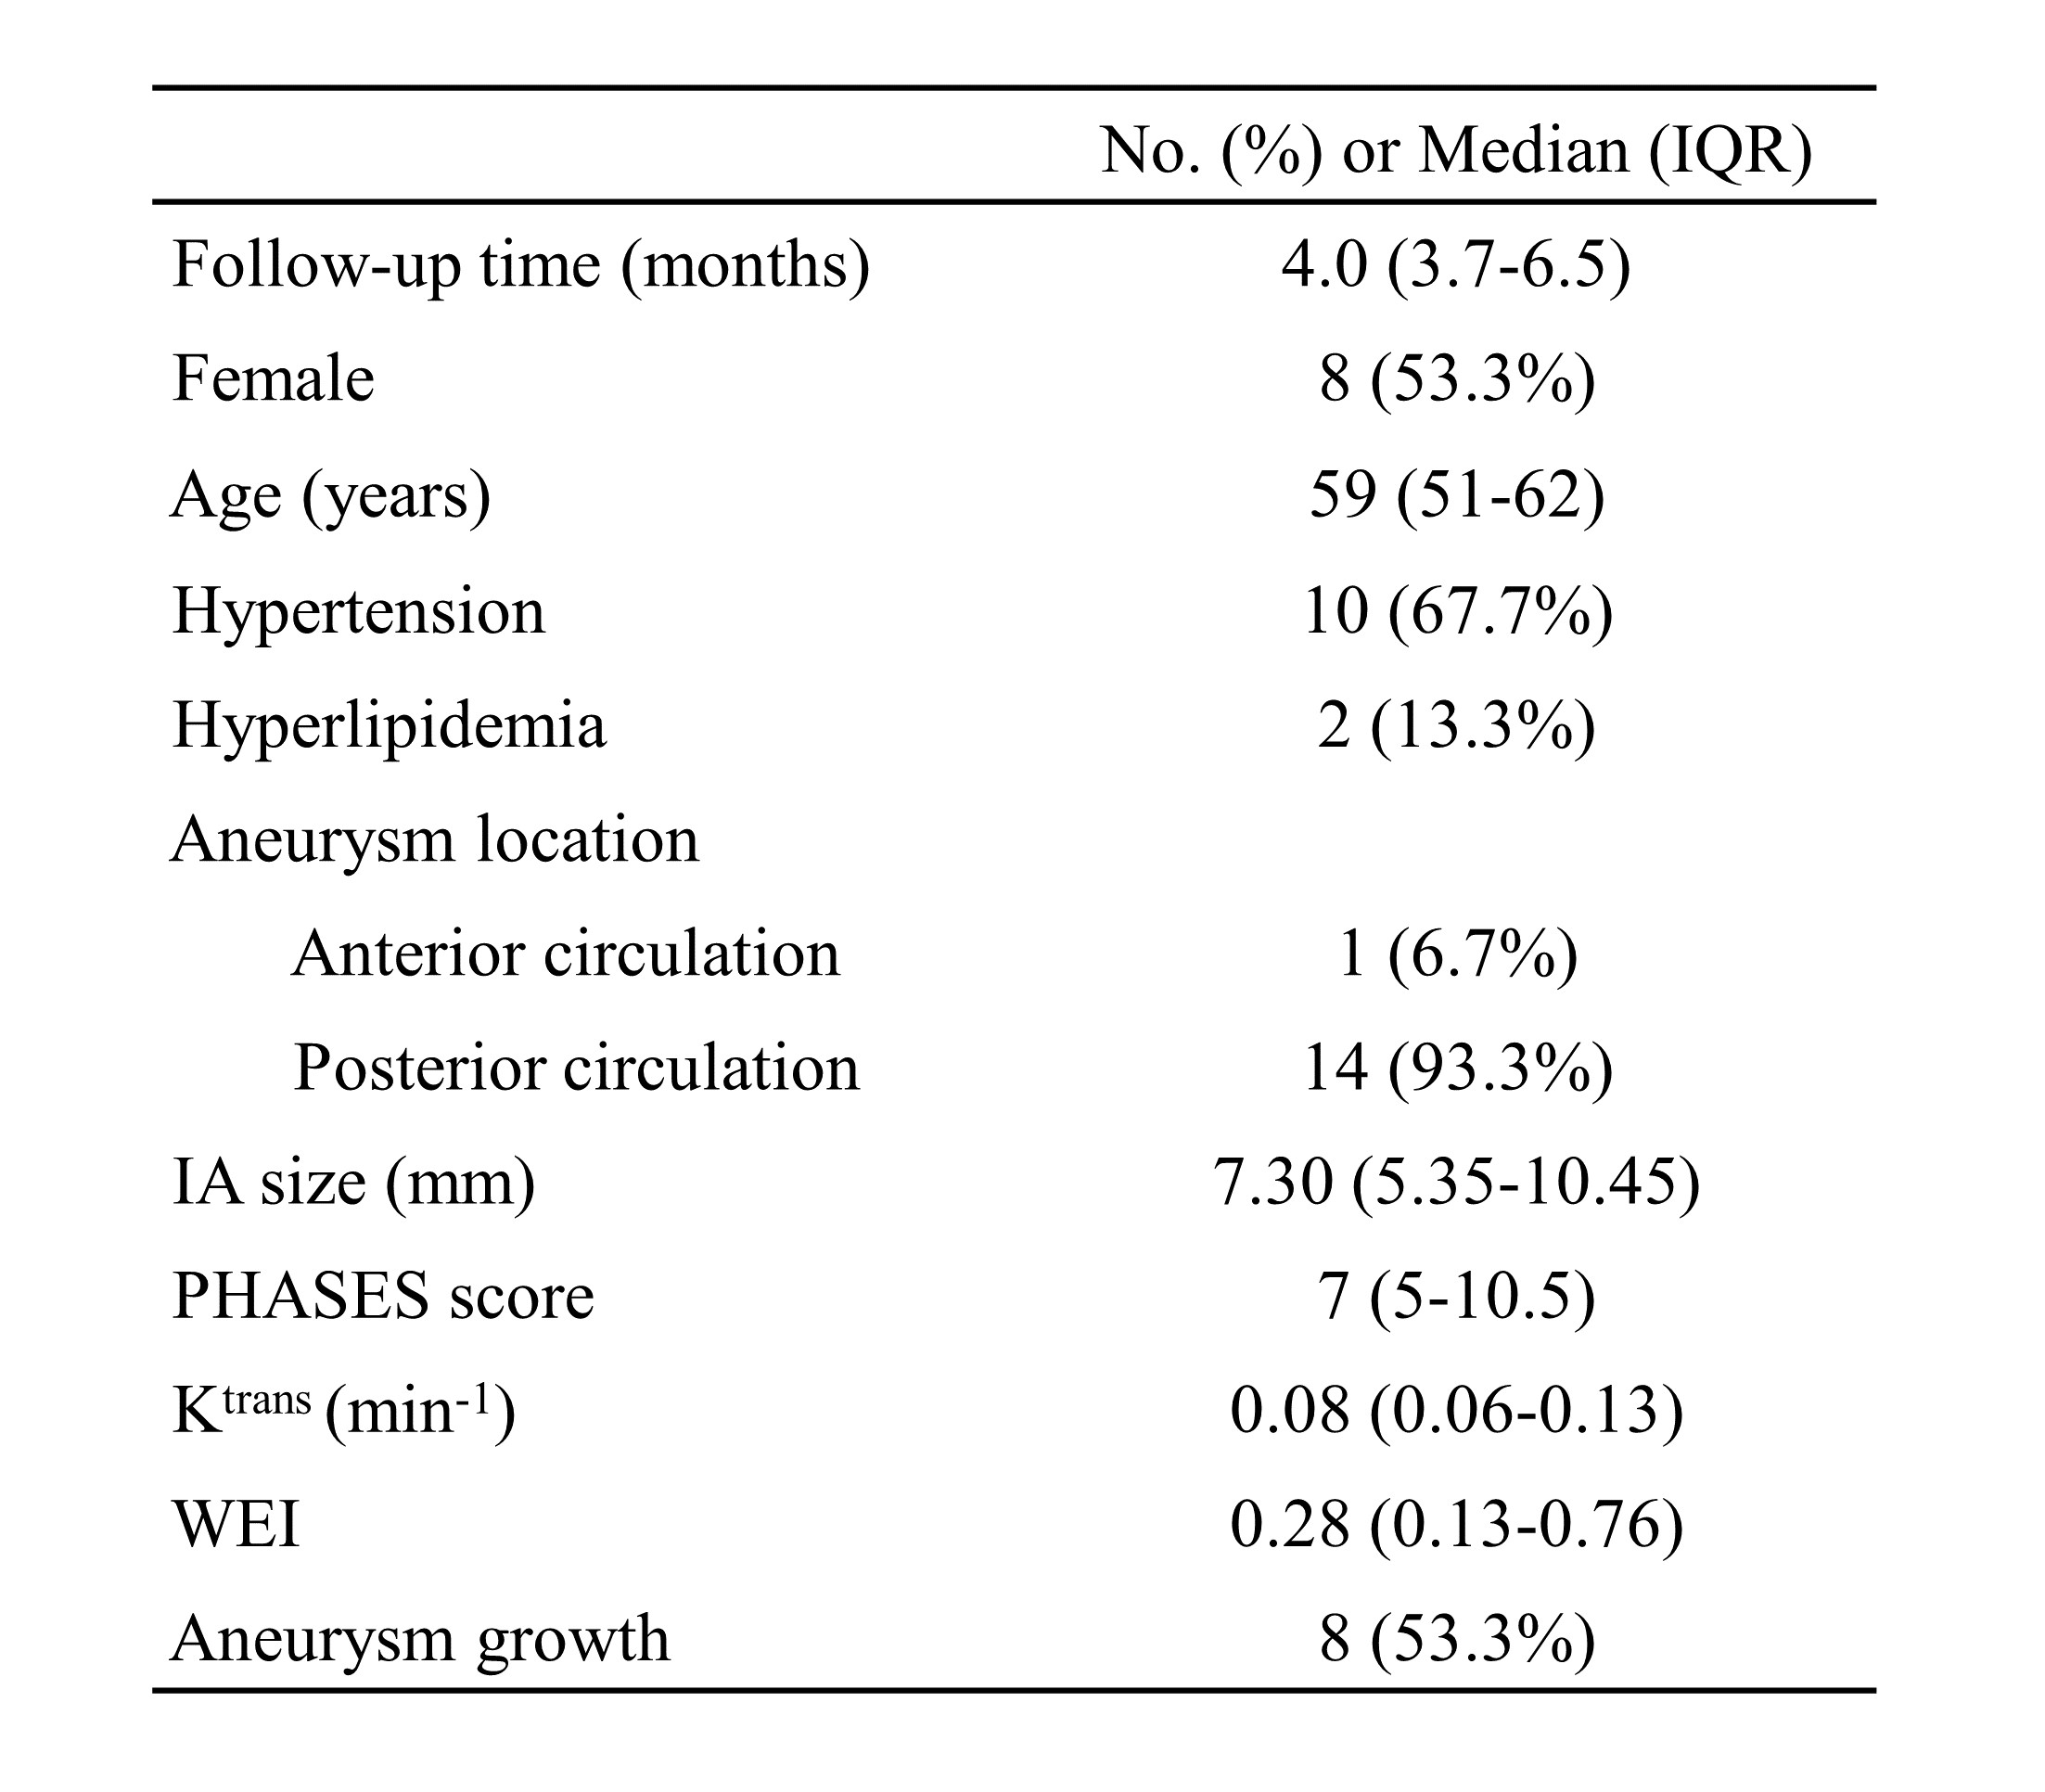
Table 1. The demography and aneurysm characteristics of the study sample (N=15). Continuous variables were presented as median with interquartile range , while categorical variables were presented as frequencies with percentages.
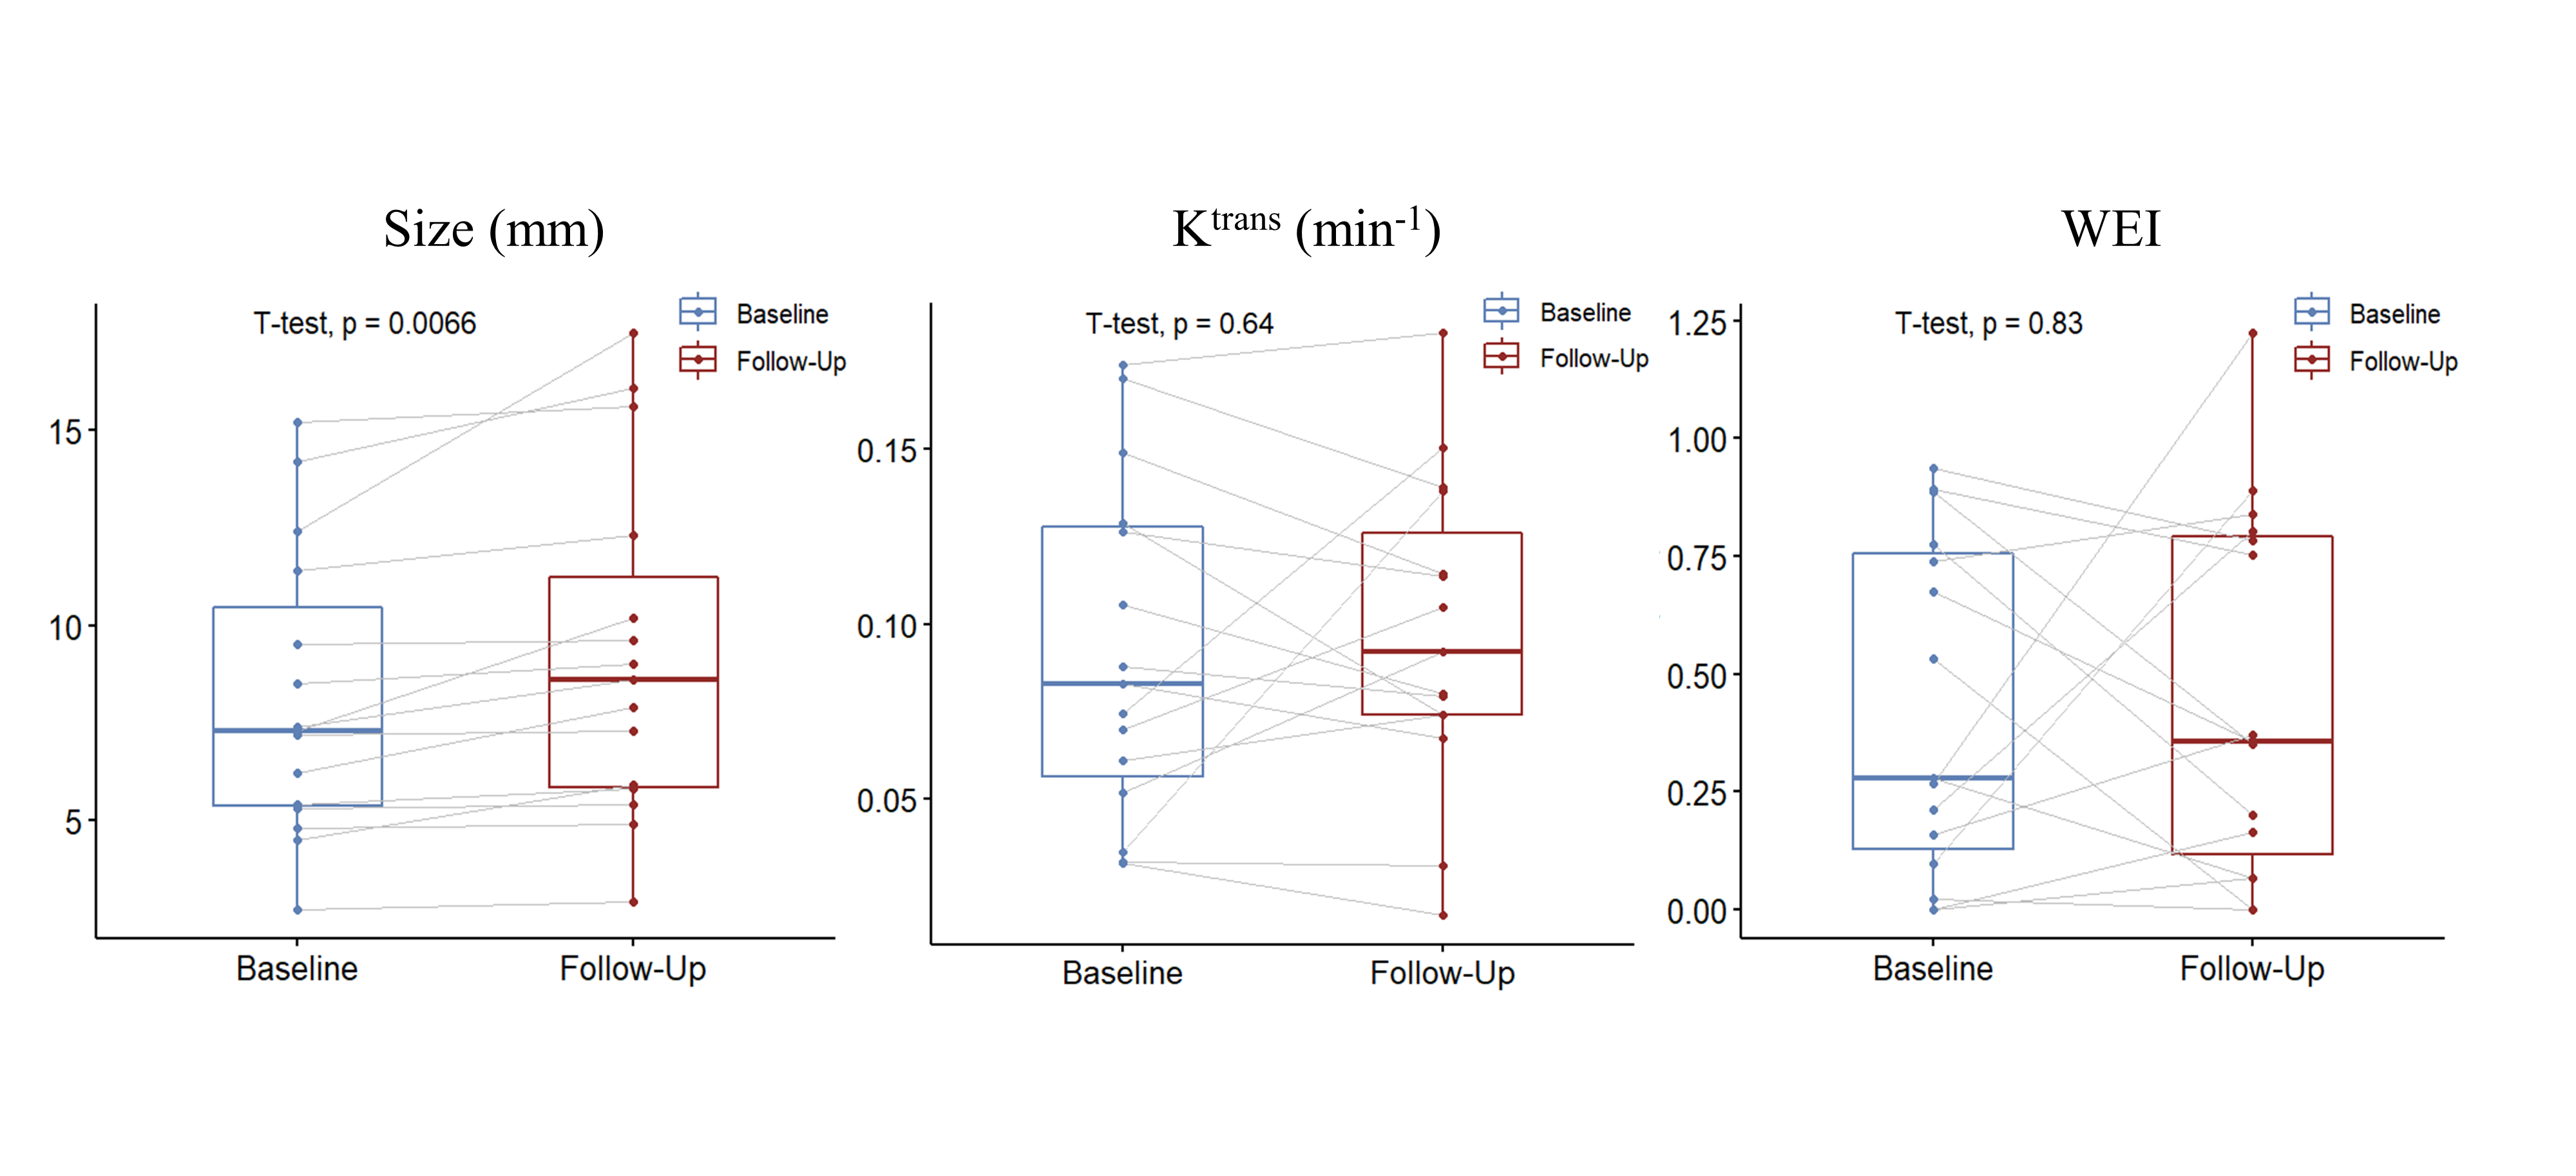
Figure 2. Comparison of size, Ktrans and WEI between baseline and follow-up. WEI, wall enhancement index; Ktrans, wall permeability. The size of aneurysm at follow-up significantly increased compared with baseline, while there was no significant change in WEI and Ktrans.
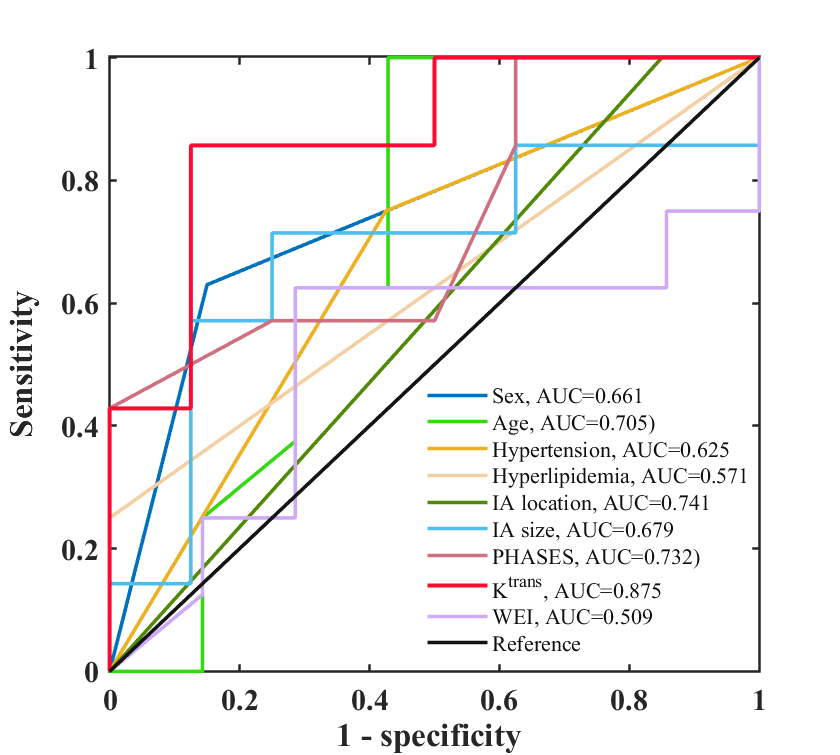
Figure 3. The receiver operating characteristics (ROC) curves and the areas under the ROC curves (AUCs) of sex, age, hypertension, hyperlipidemia, IA location, IA size, PHASES, Ktrans and WEI in predicting aneurysm growth. Ktrans demonstrated the best discrimination and achieved an AUC of 0.875.
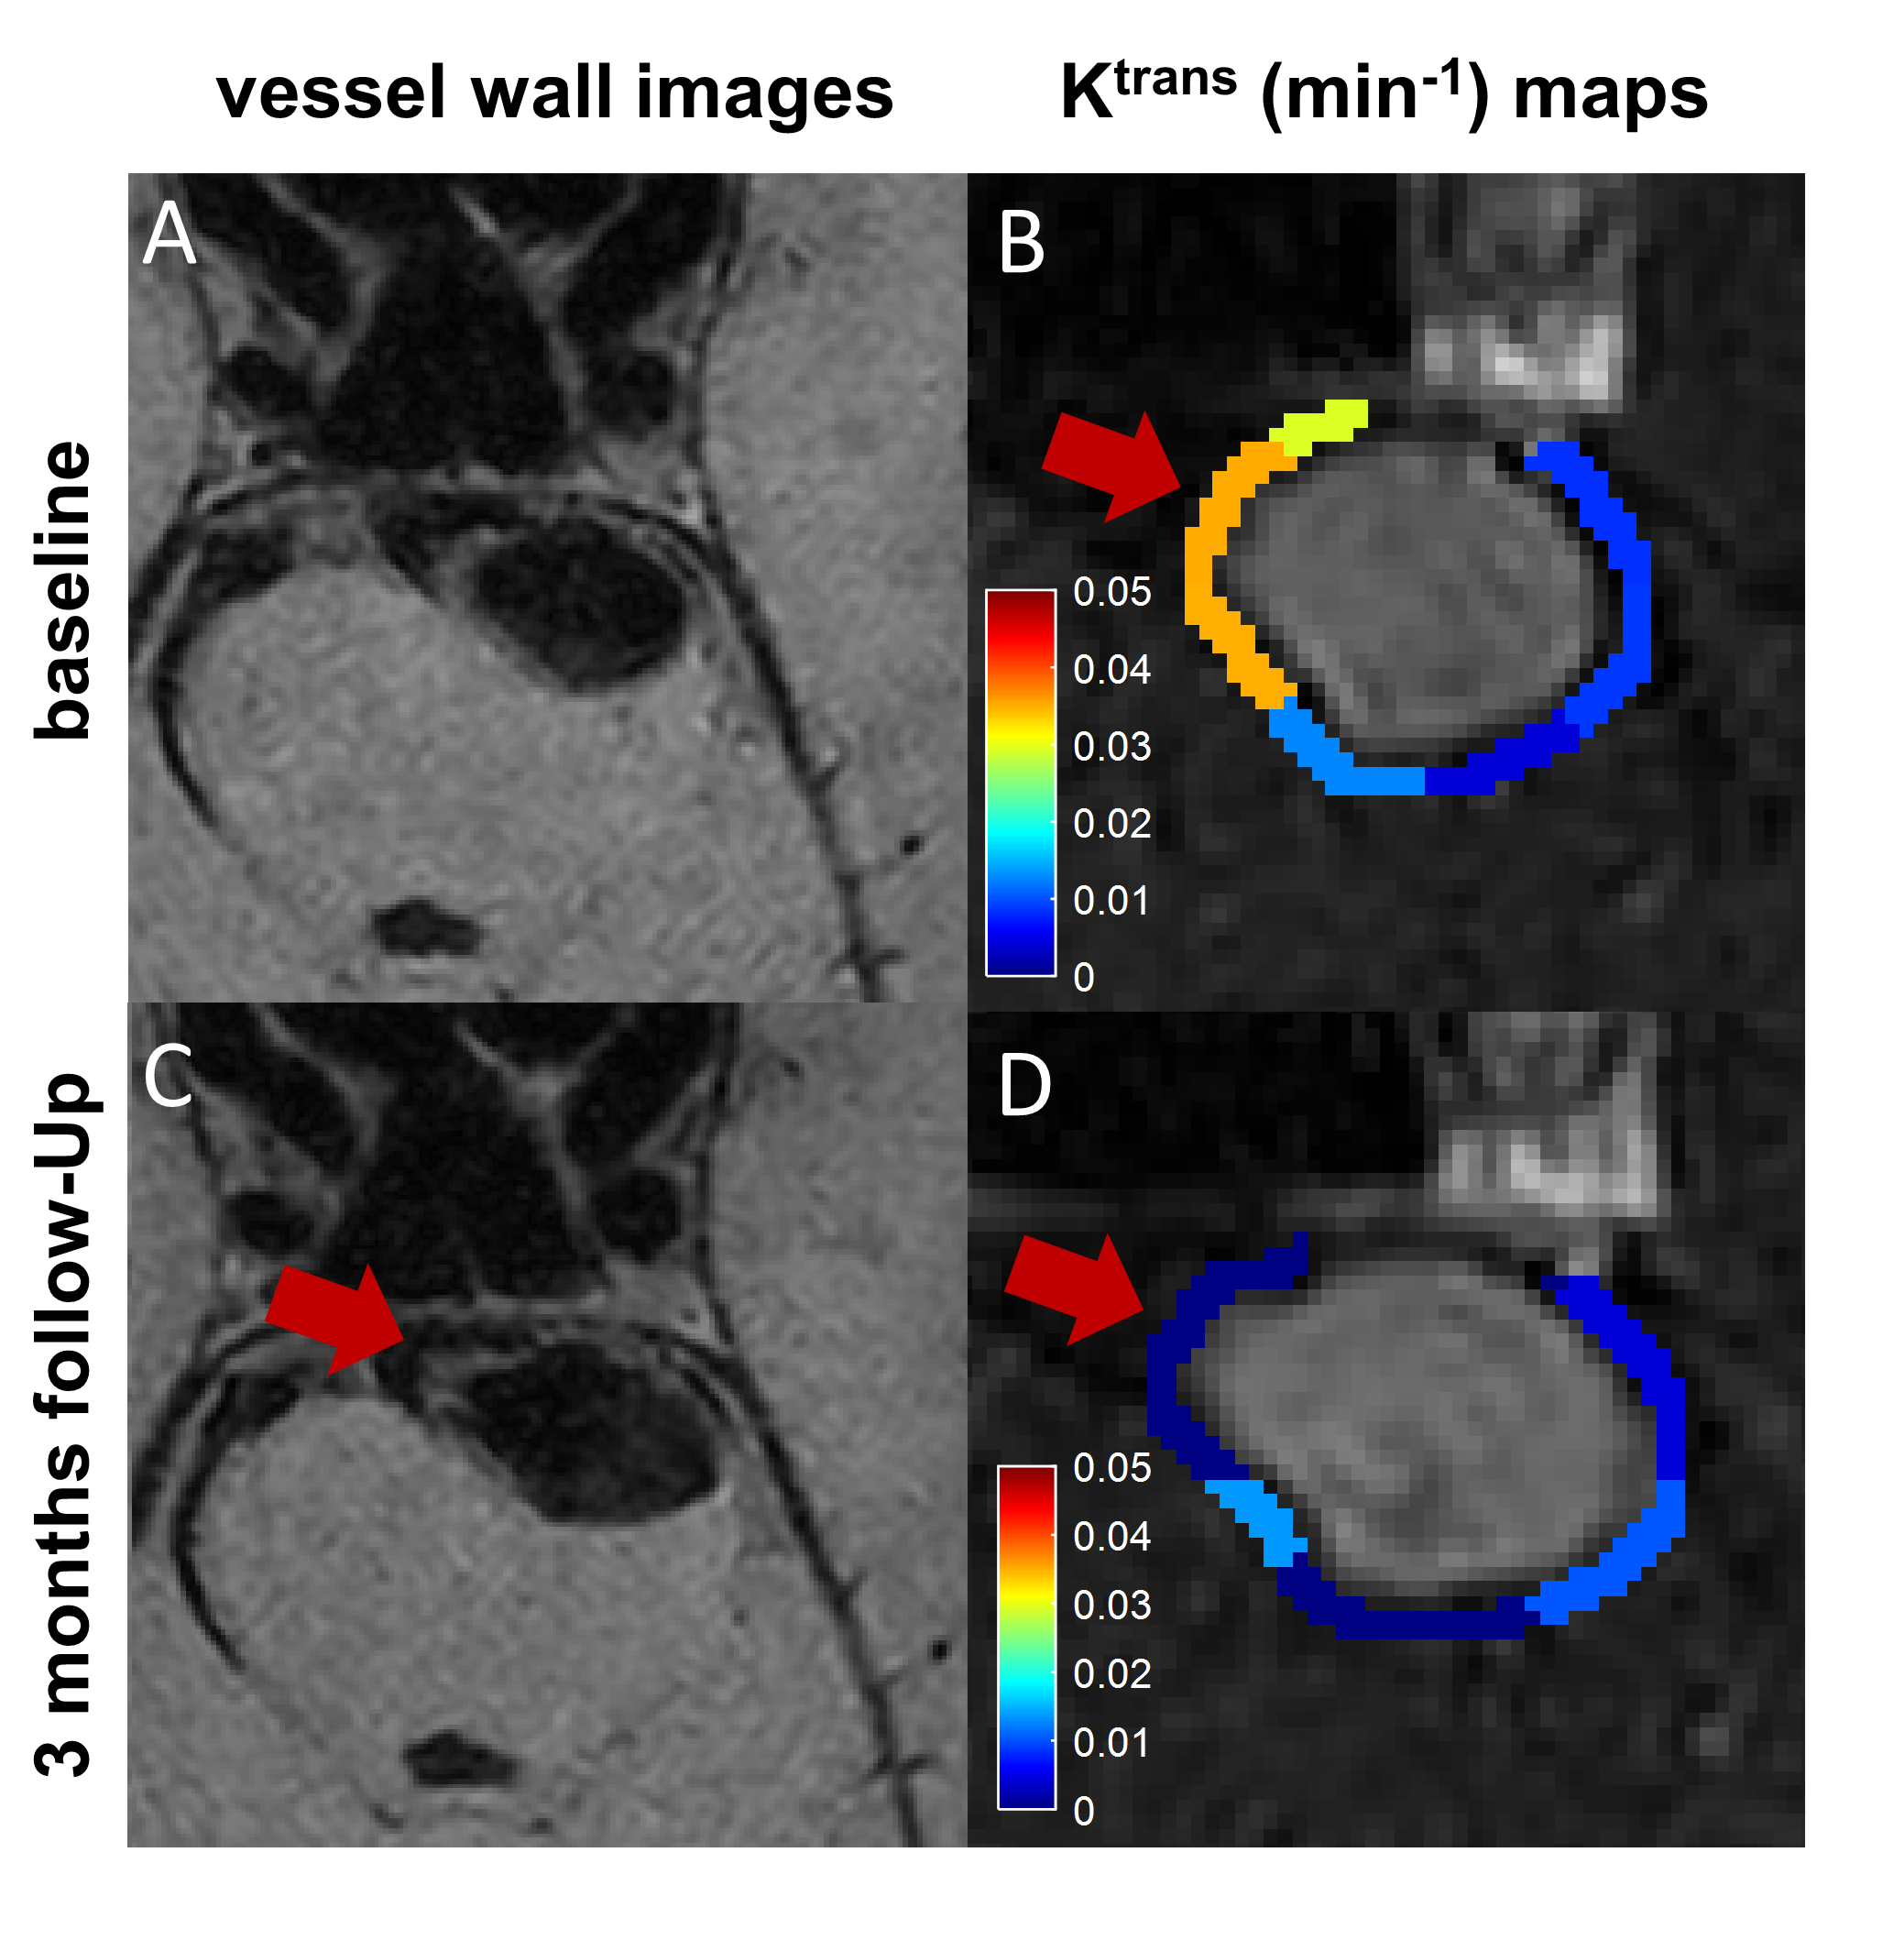
Figure 4. The evolution of one vertebrobasilar aneurysm in a 52-year-old man demonstrated that elevated Ktrans at baseline correlated with aneurysm growth. Morphologic changes during 3 months were observed on vessel wall images (A and C) and DCE–MRI (B and D); Ktrans map at baseline (B) demonstrated 1 region with high Ktrans (red arrow) —apparently correlated with the direction of aneurysm growth (C and D).