3061
Assessing cerebral perfusion: transfer function analysis of the BOLD response to hypoxia-induced changes in deoxyhemoglobin1Physiology, University of Toronto, Toronto, ON, Canada, 2Department of Anaesthesiology and Pain Management, University of Toronto, Toronto, ON, Canada, 3Joint Department of Medical Imaging and the Functional Neuroimaging Lab,, University Health Network, Toronto, ON, Canada, 4Joint Department of Medical Imaging and the Functional Neuroimaging Lab, University Health Network, Toronto, ON, Canada, 5Department of Anaesthesiology and Pain Management, University Health Network, Toronto, ON, Canada
Synopsis
Keywords: Data Analysis, Brain
We used hypoxia-induced changes in deoxyhemoglobin concentration as a susceptibility contrast agent. Transfer function analysis of the resulting changes in the BOLD signal for each voxel provided cerebral perfusion measures that indicate the distribution of the strength of the signal response to the contrast agent (gain) and the lag of the response (phase or time). We relate the gain and lag to conventional resting hemodynamic measures cerebral blood volume and mean transit time, respectively.
INTRODUCTION
Hypoxia-induced changes in deoxyhemoglobin can be used as a susceptibility contrast agent for magnetic resonance imaging 1. The resulting changes in the blood oxygen dependent (BOLD) signal can be analysed to provide voxel-wise maps of perfusion measures such as relative cerebral blood volume (rCBV) and flow (rCBF) as well as relative mean transit time (rMTT), which can be interpreted to indicate vascular health and detect the presence of compensation in response to anatomical pathologies. These measures can be calculated for each voxel using a susceptibility contrast method (DSC) which takes the temporal changes in the oxygen saturation signal as an arterial input function applied to a tracer kinetic model2. Here we explore a simpler analysis. We used transfer function analysis (TFA) of the BOLD signal for each voxel to indicate the change in the strength of the signal in response to the contrast agent (gain) and the lag of the response (phase or time). We suggest that these measures, gain and lag, correspond to conventional resting hemodynamic measures rCBV and rMTT.METHODS
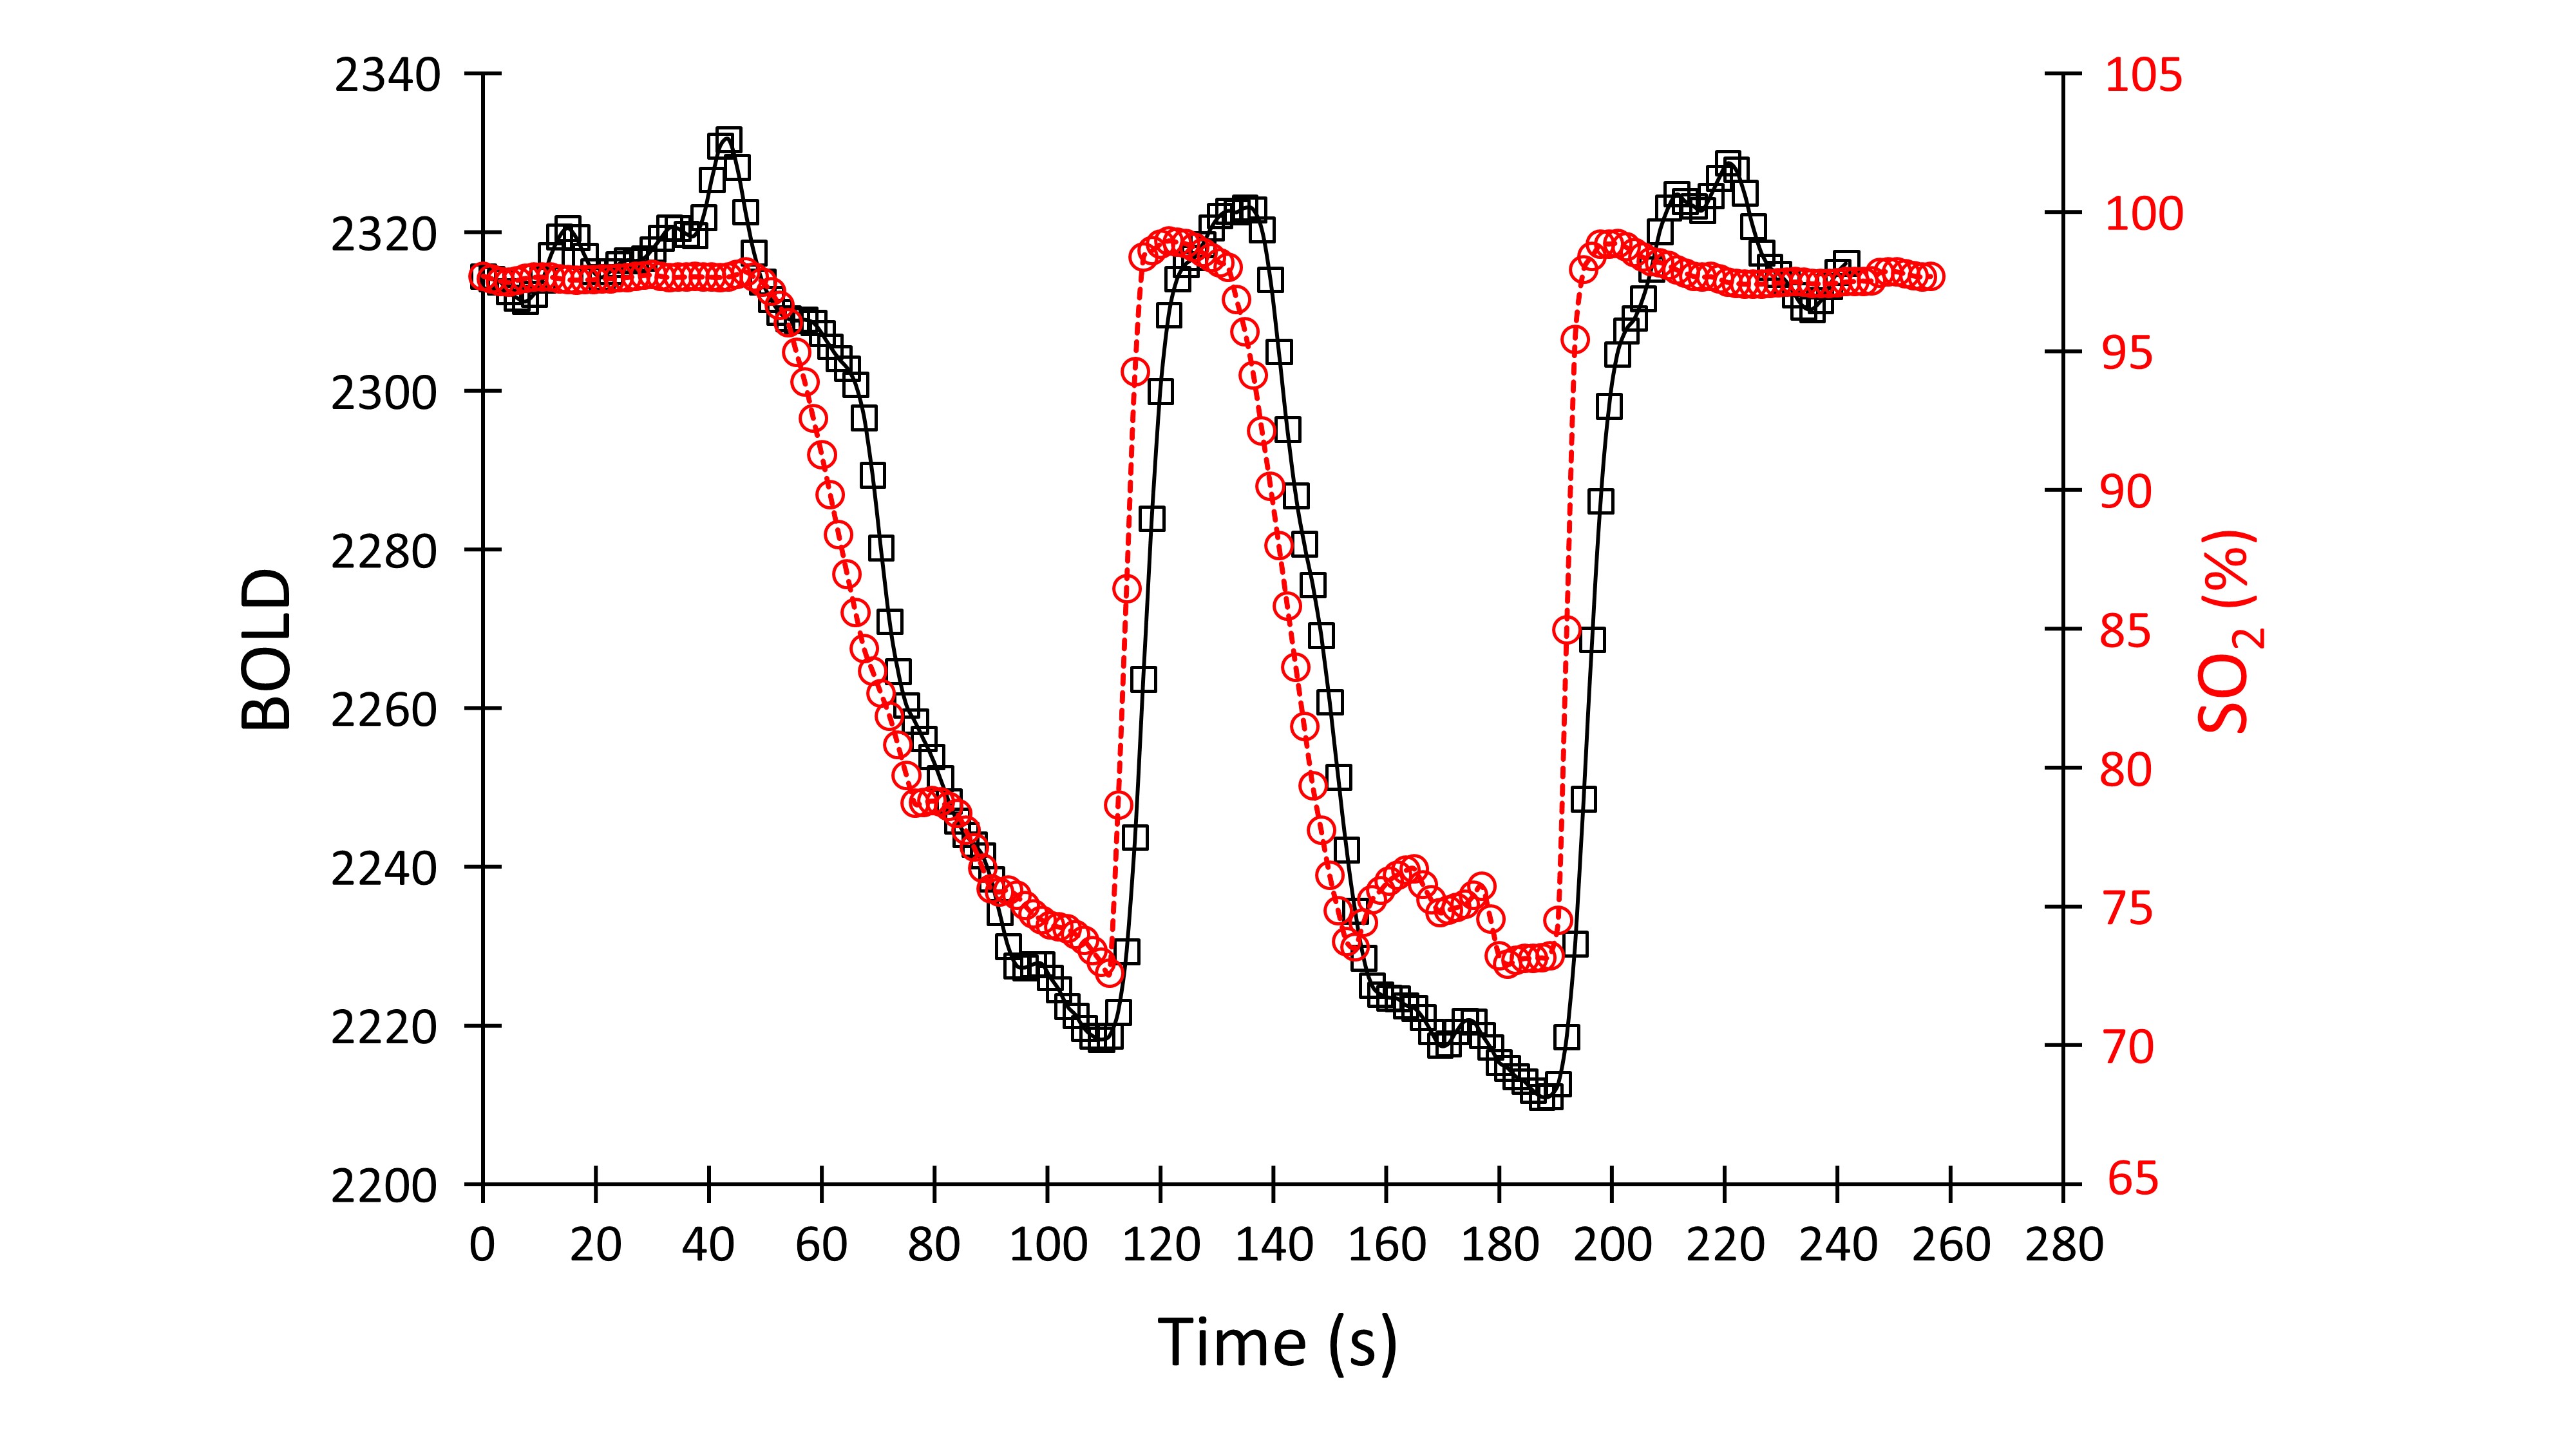
25 healthy volunteers (7F) ranging from 21 to 82 (mean (SD) 38.4 ±17.6 years, median age 30, IQR= 31.25), and an example patient with known steno-occlusive disease were imaged on a 3T MR scanner. We used a computer-controlled gas blender to control the partial pressures of end-tidal oxygen (PetO2) and carbon dioxide (PetCO2) administered via a sequential gas delivery circuit (RespirAct™, Thornhill Medical, Toronto, Canada). Both underwent a BOLD sequence and a high-resolution T1-weighted scan.The BOLD sequence was acquired during PetO2 manipulation while maintaining normocapnia during a 4 min 20 second scan which consisted of a 60 s baseline PetO2 of 95 mmHg (normoxia), a step decrease in PetO2 to 40 mmHg (hypoxia) for 60 seconds, a return to normoxia for 20 seconds, followed by a similar timed hypoxic period (Figure 1). The following BOLD sequence parameters were used: TR/TE = 1500/30 ms, flip angle = 73 deg, 29 slices, voxel size of 3 mm isotropic and matrix size of 64 x64.
The hemoglobin oxygen saturation signal was used as the AIF for the DSC analysis of the patient example. A parametrized model method of deconvolving and fitting the residue function with an exponential was used to calculate the respective relative mean transient time (rMTT) and relative cerebral blood volume (rCBV)1.
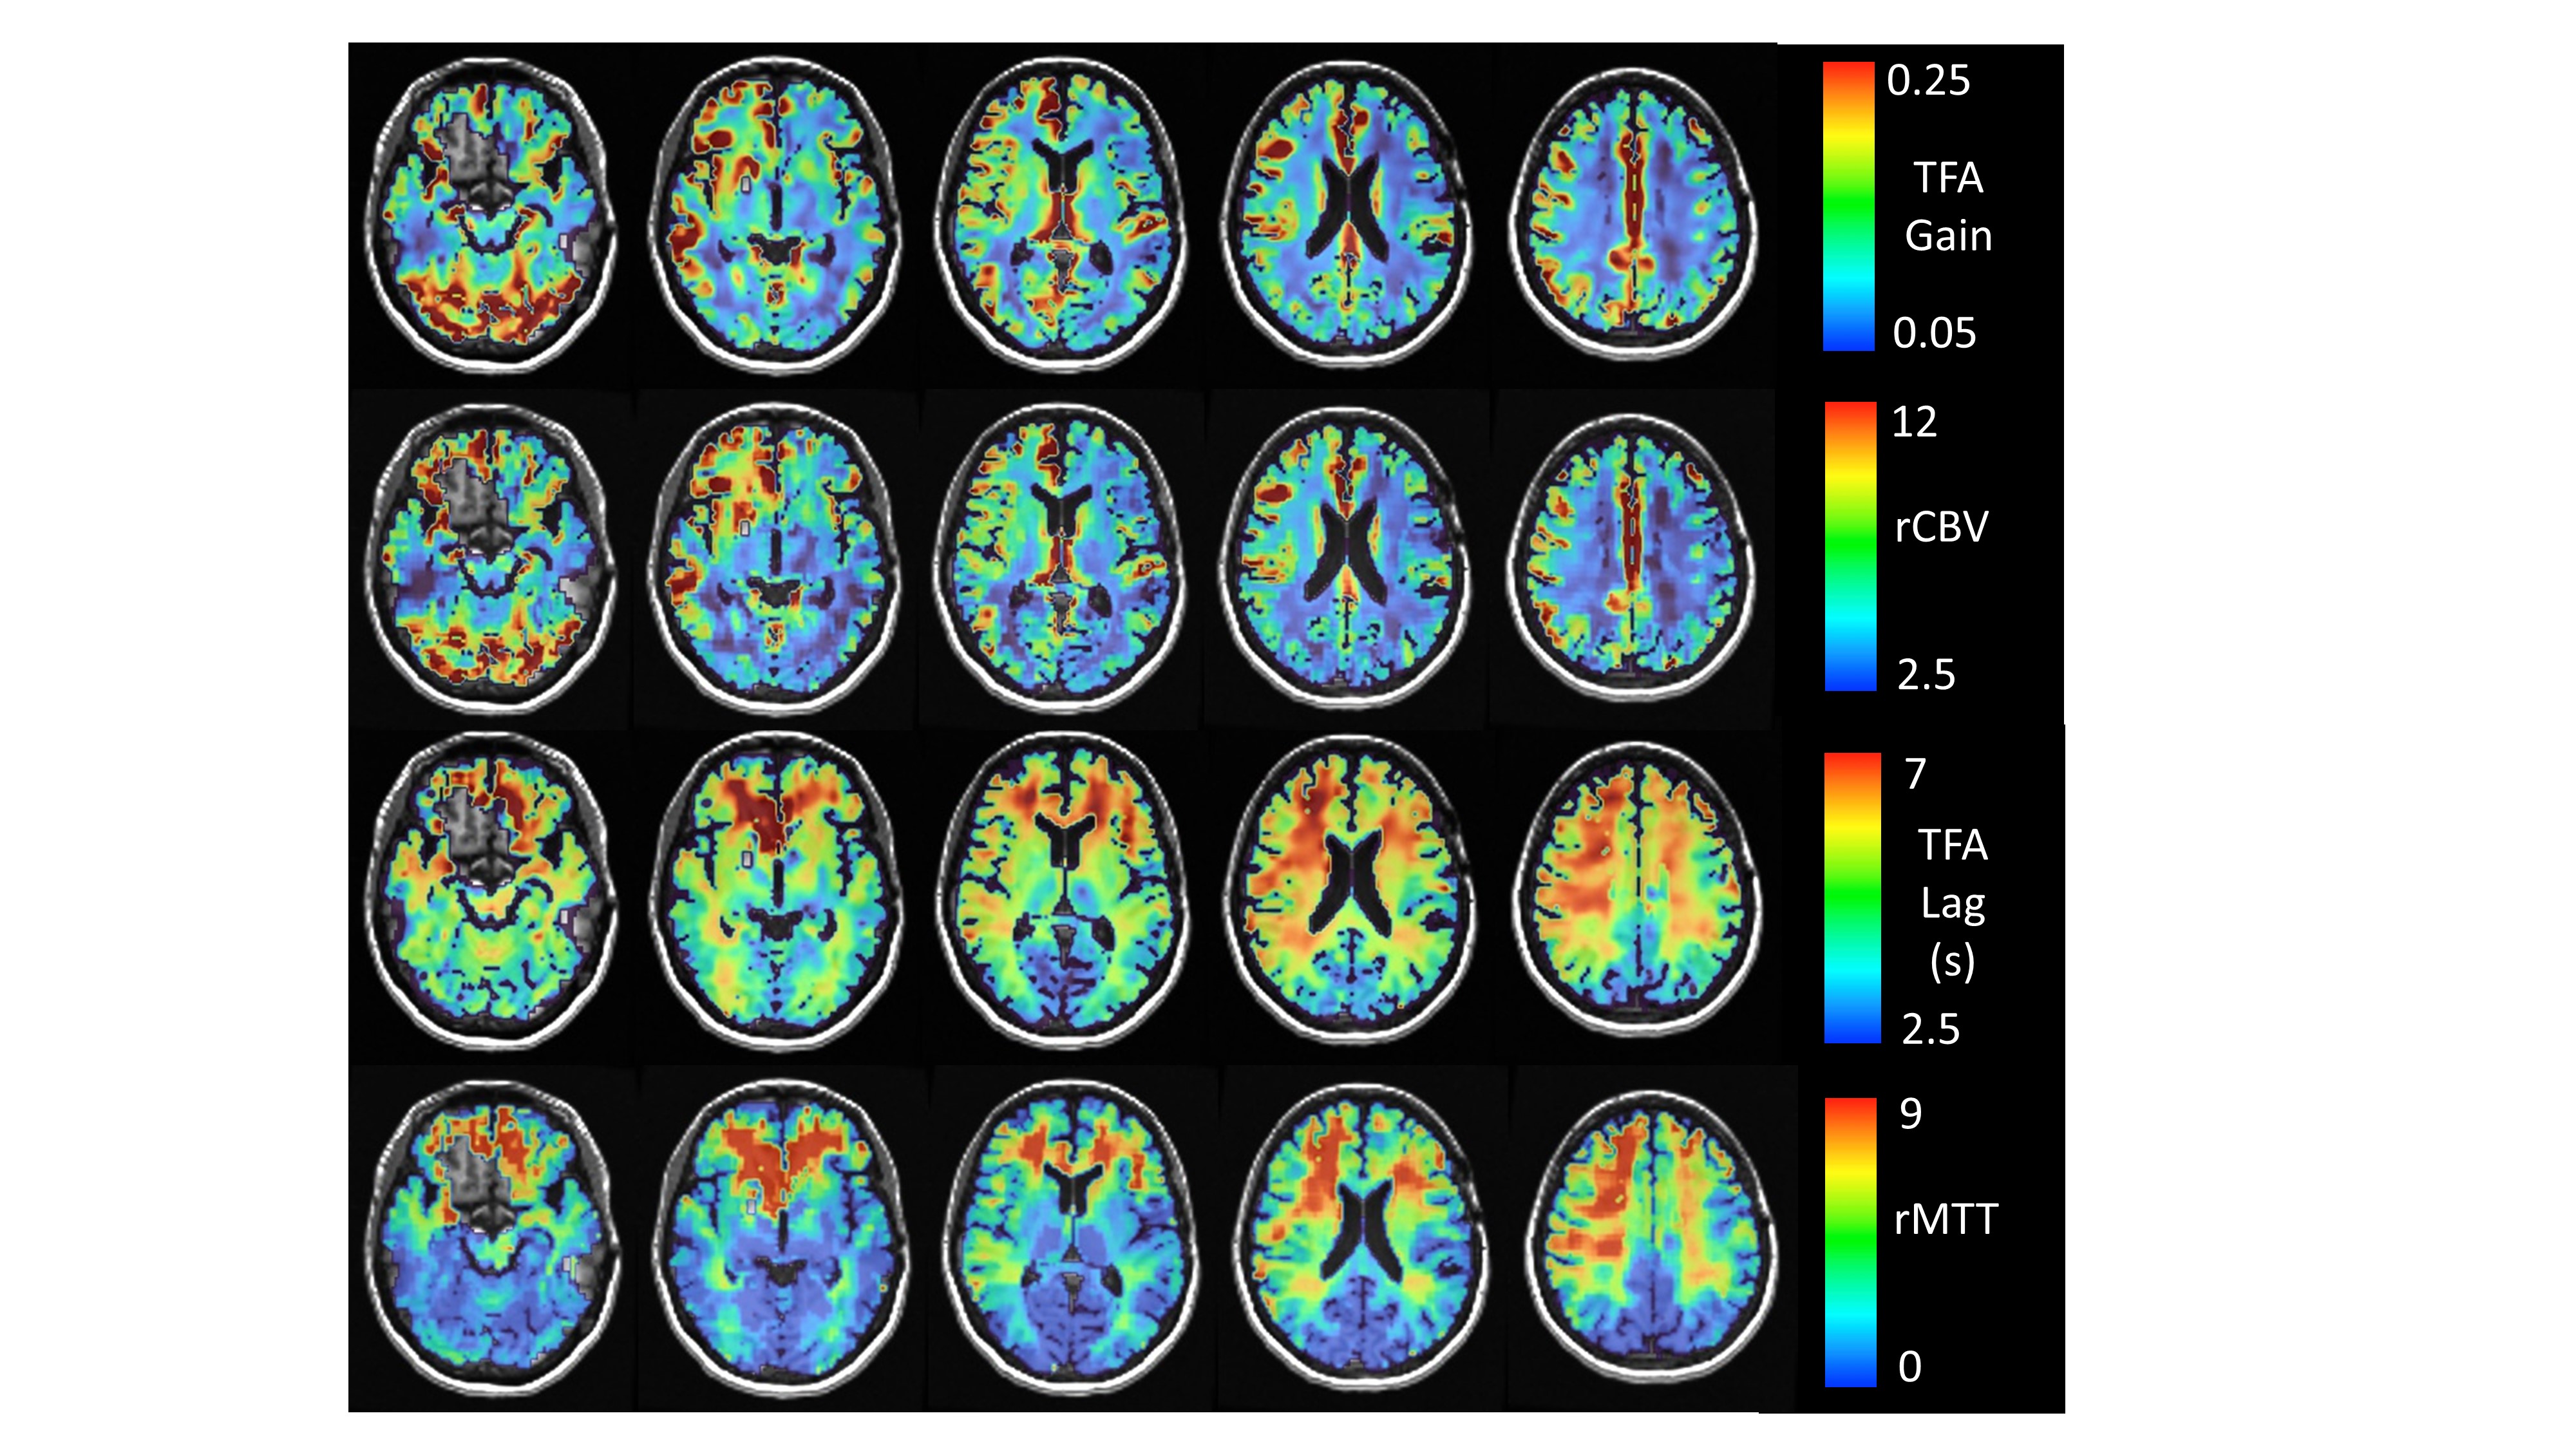
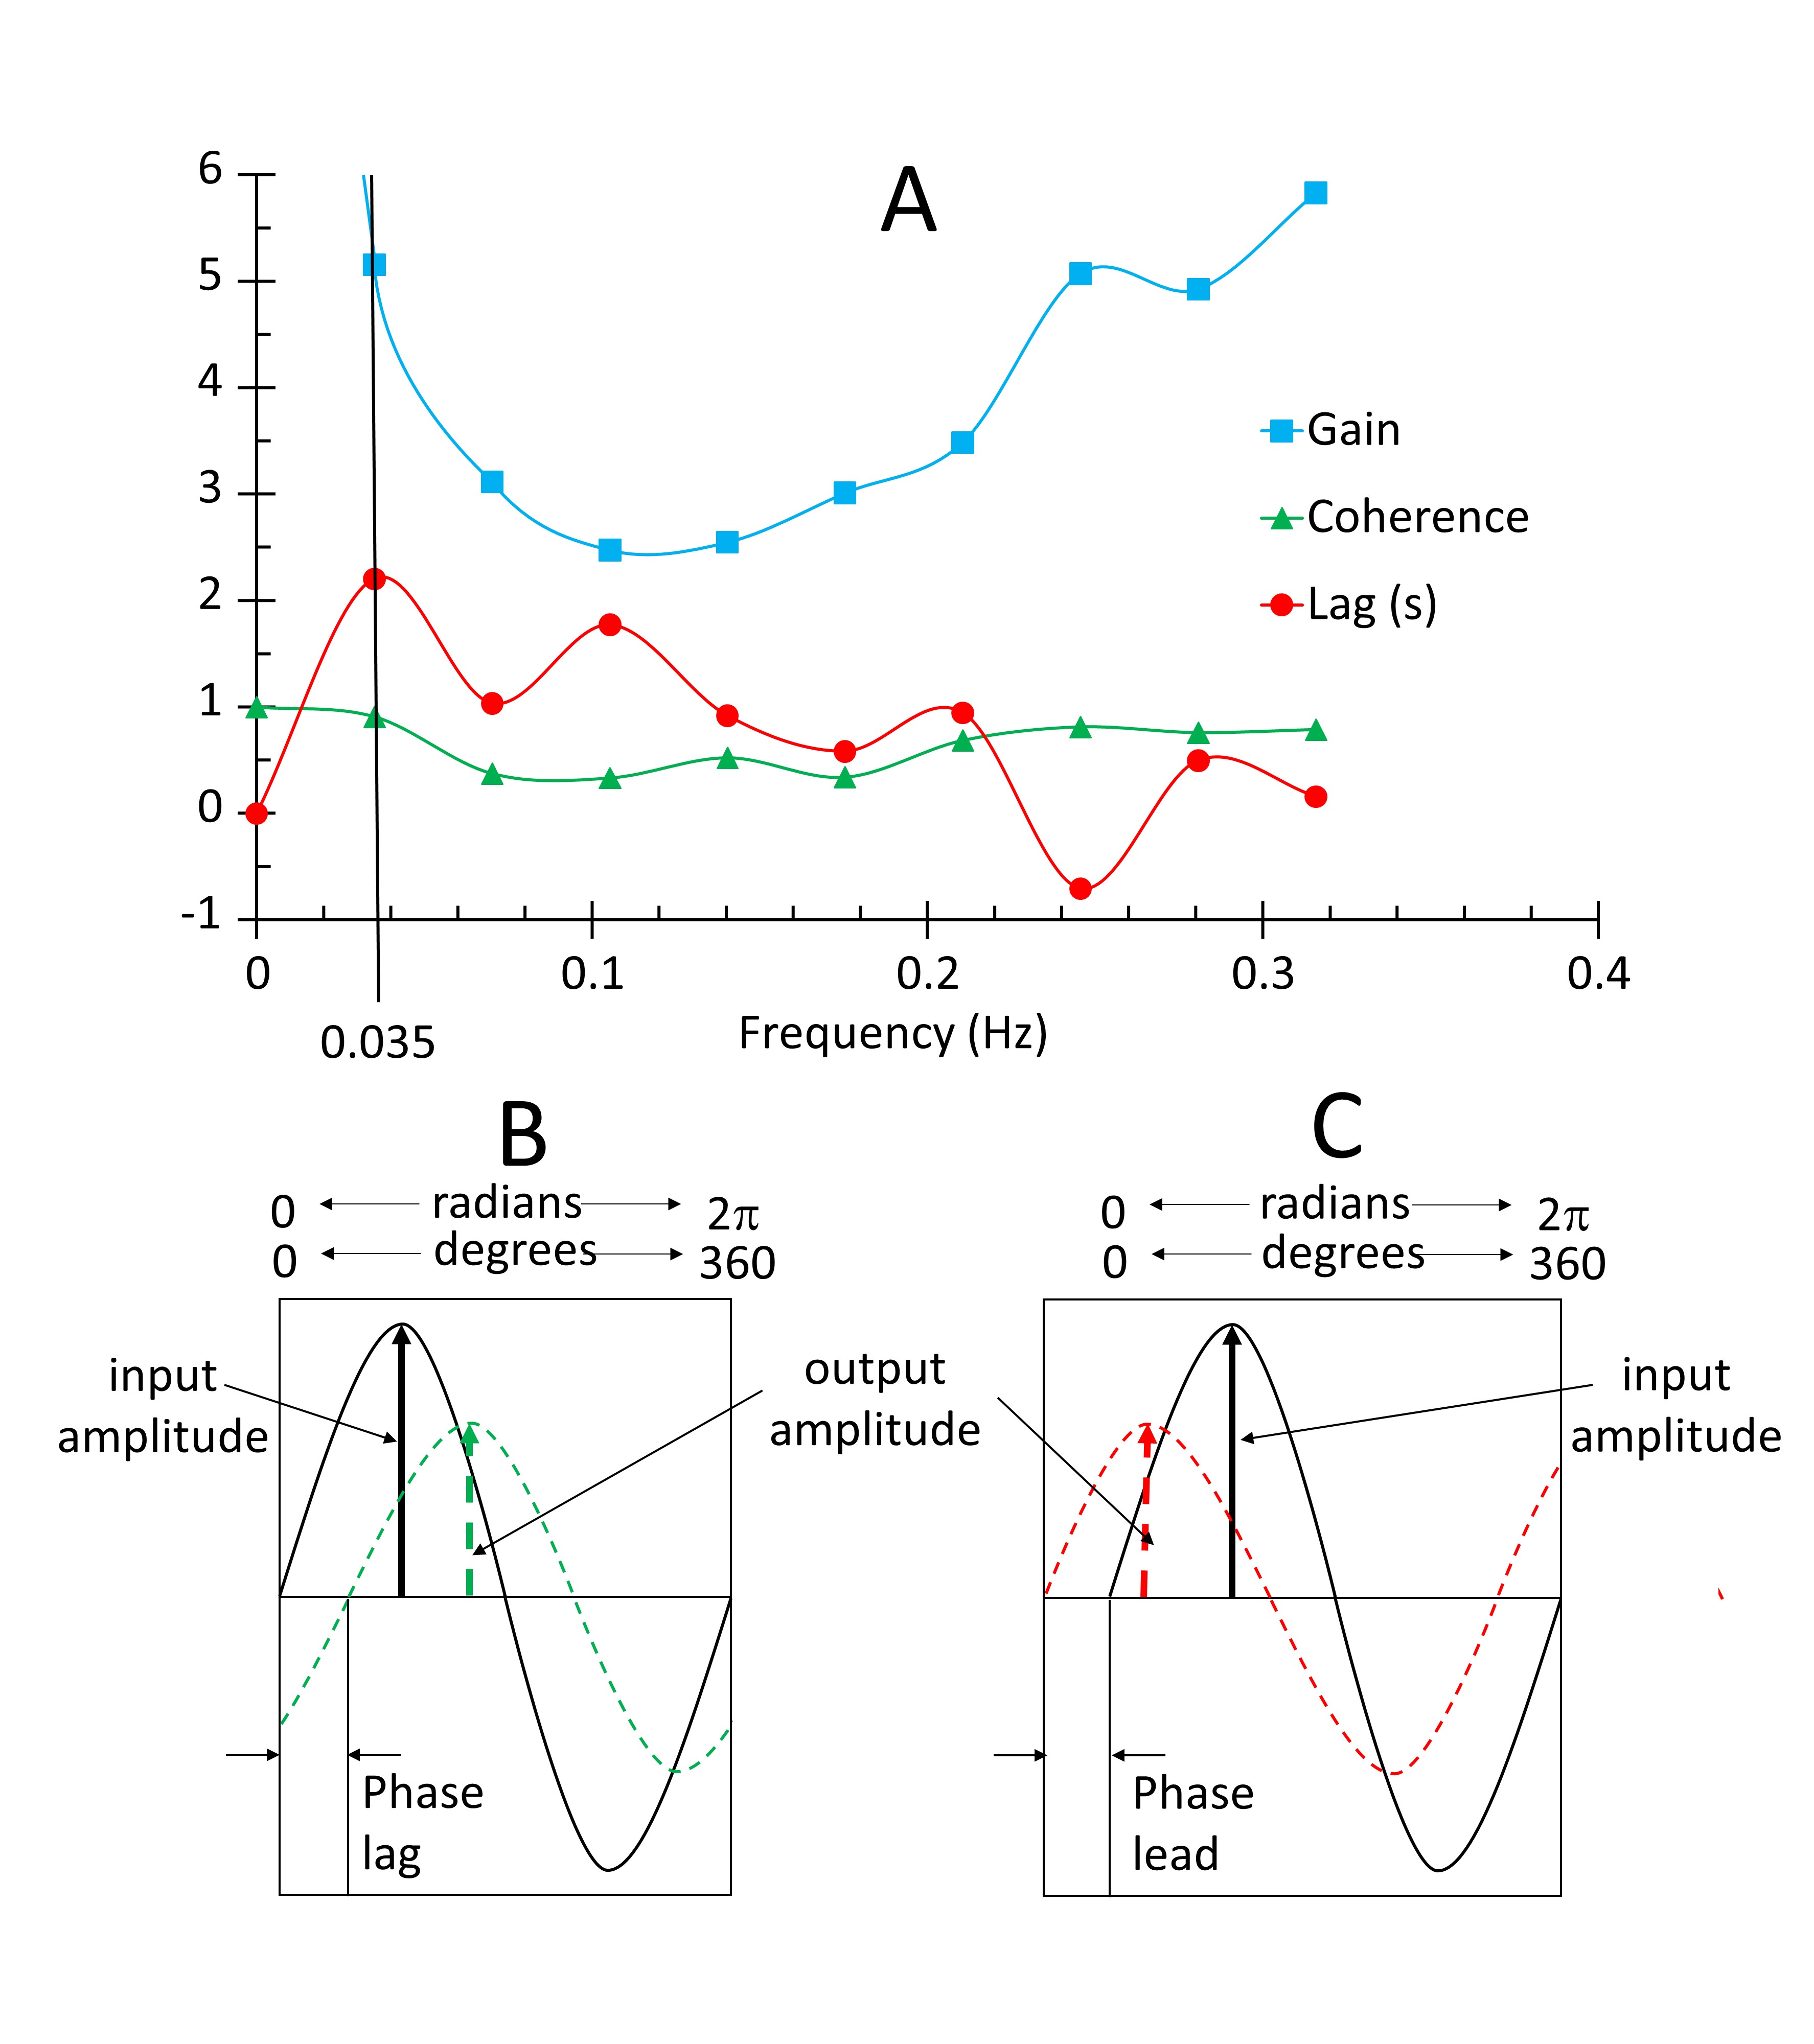
We applied TFA of the BOLD response to the pattern of hypoxia-induced changes of [dOHb] to generate voxel-wise maps of gain and phase lag in 25 healthy individuals and an example patient. Figure 2A shows the gain, lag and coherence measures for all frequencies in an example voxel. The values at the single frequency of 0.035 Hz were chosen as the measurement of gain, lag and coherence used to characterise a voxel and generate maps. This choice was made to reflect the major features of the relationship where the coherence was high, and the power of the transfer between the [dOHb] change and the BOLD response was high, avoiding higher frequency noise and zero frequency trends. Figure 2B, C illustrates the meaning of the gain and lag measures at a single frequency.
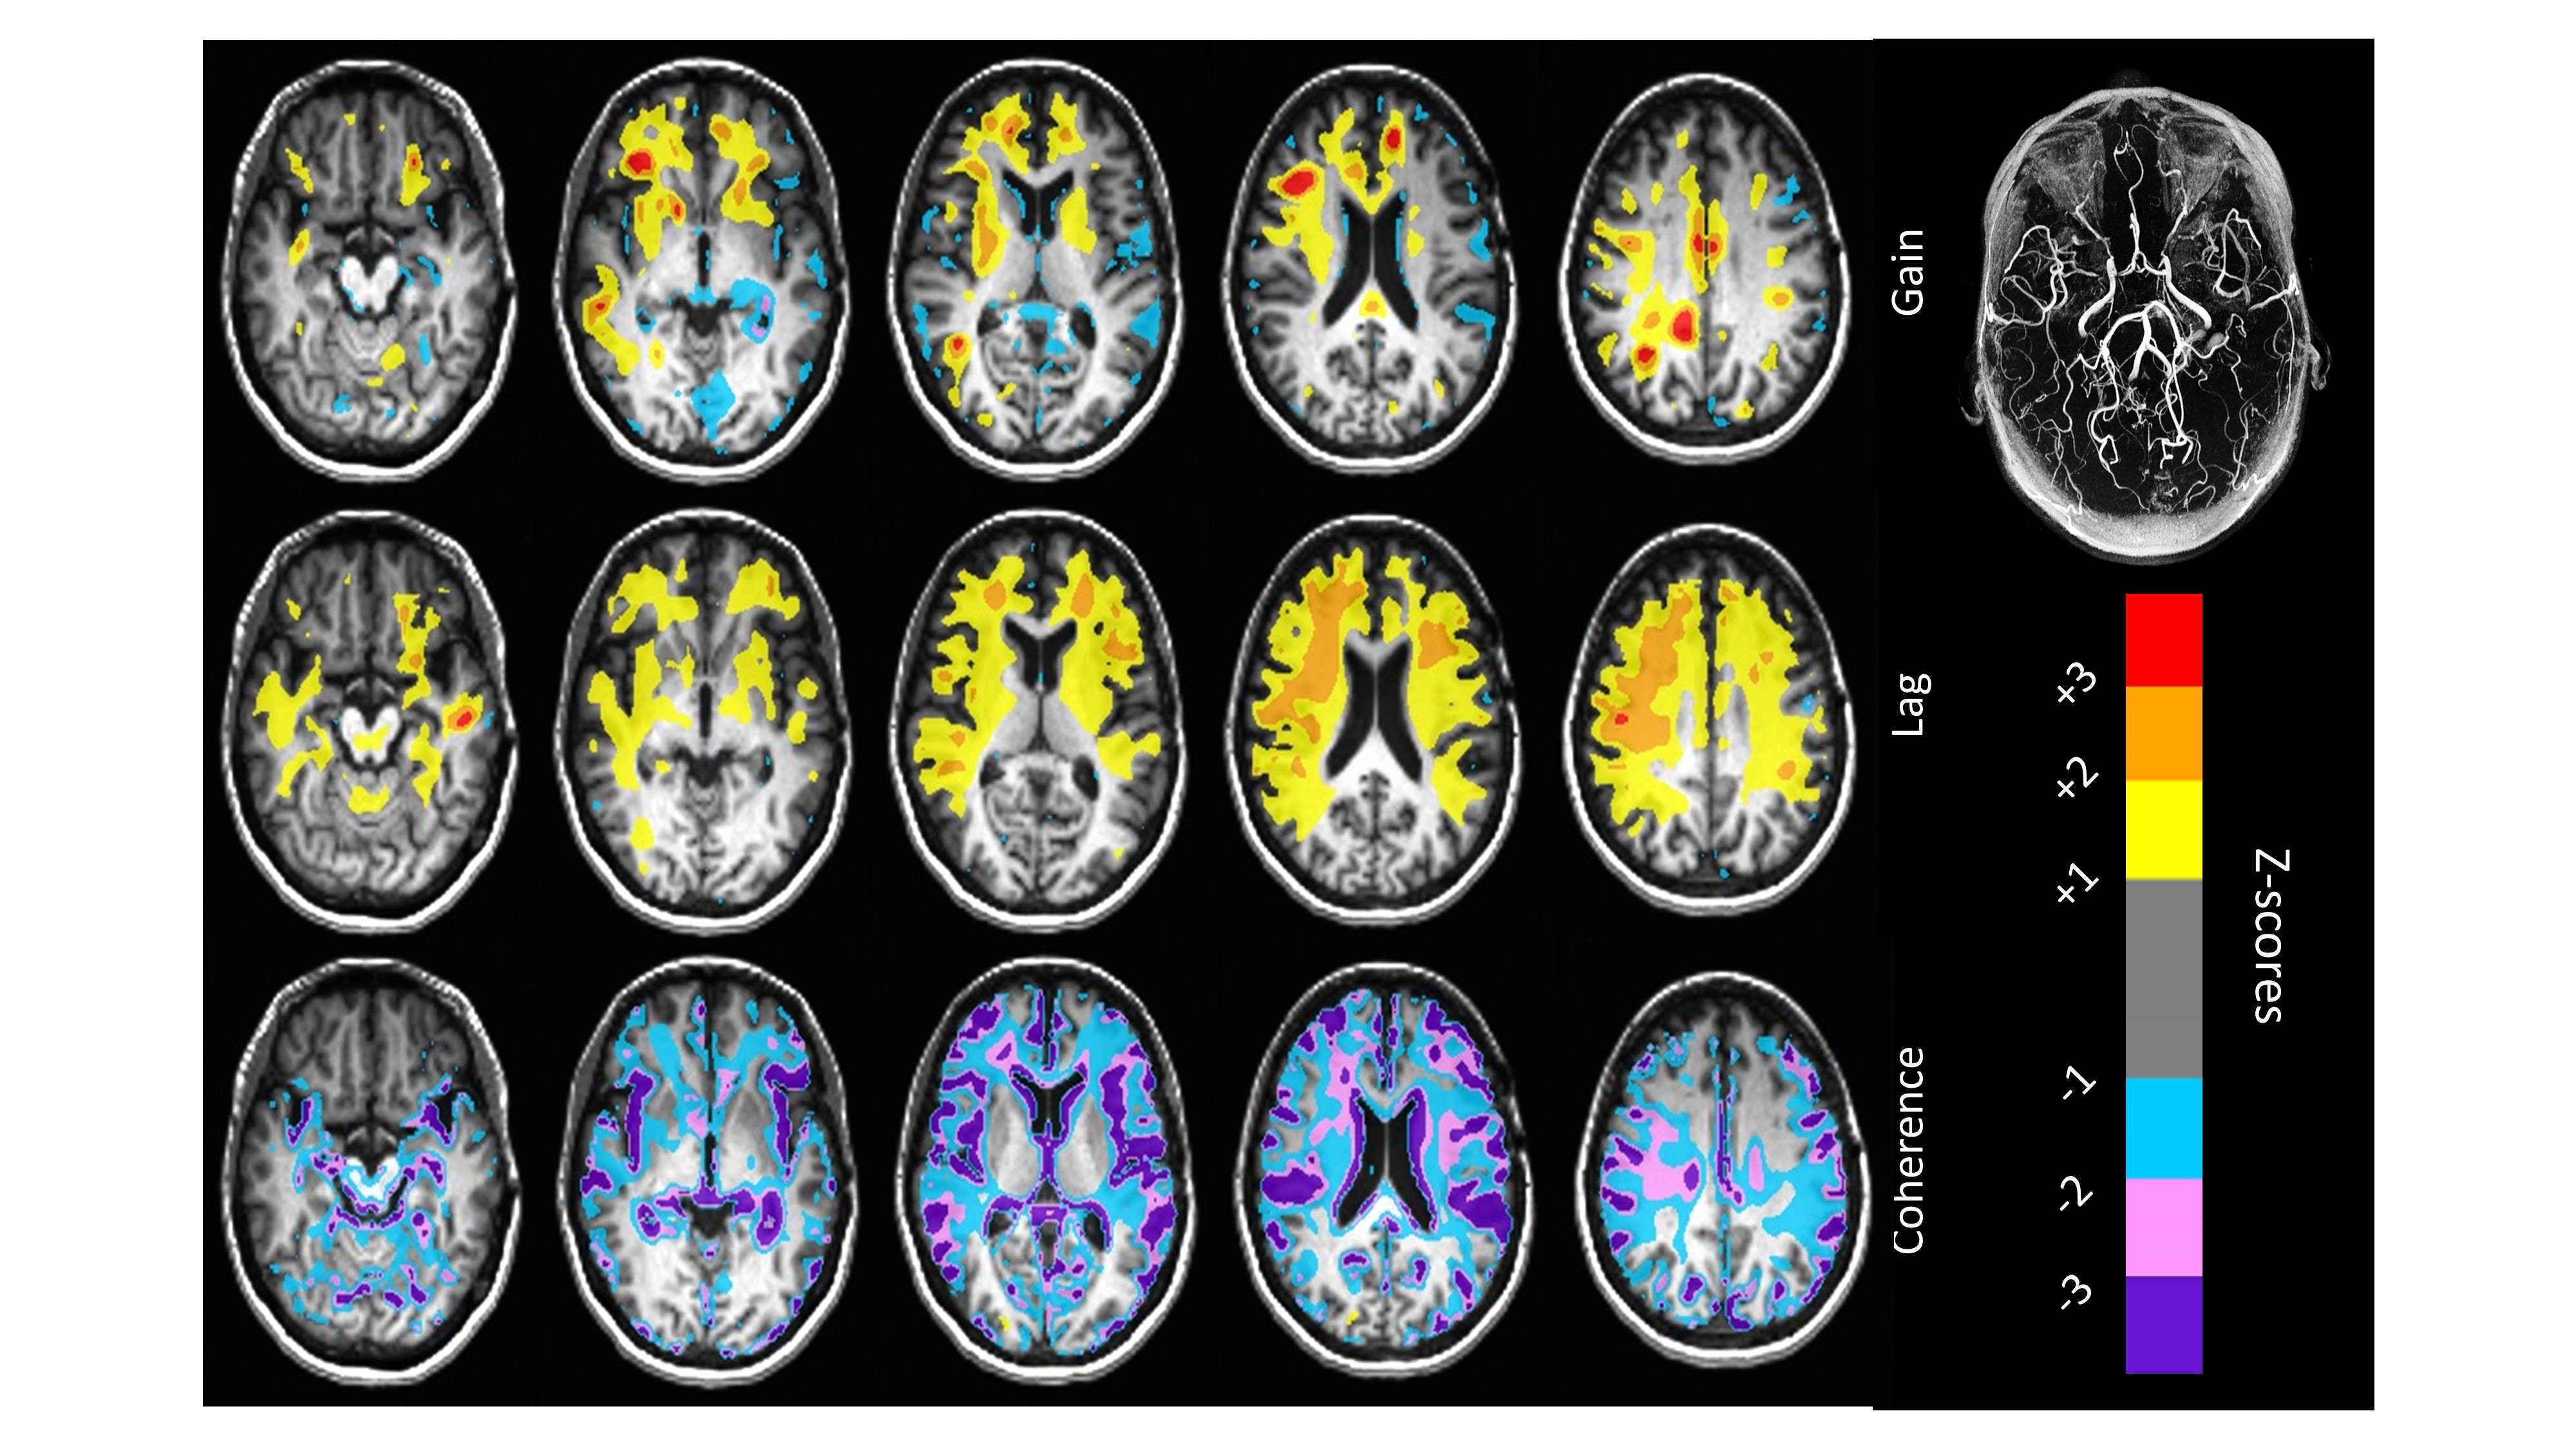
Atlas maps for the healthy cohort were constructed and the example patient’s maps were compared to the atlas maps using a z-map approach to identify areas of abnormality3. The example patient’s gain and lag maps were also compared to the rCBV and rMTT measures provided by the DSC analysis.
RESULTS
Figure 3 shows representative axial slices of the atlas TFA measures gain, lag and coherence calculated for the 25 healthy subjects. Figure 4 compares the example patient maps of the resting perfusion measures rCBV and rMTT determined from the DCS analysis with the TFA gain and lag respectively, and Figure 5 shows the example patient z-maps for TFA gain, lag and coherence. The example patient had bilateral EC-IC bypass.The spatial distribution of resting perfusion measures rCBV and rMTT appeared similar to those for gain and lag obtained using TFA respectively for the example patient. In addition, the areas of abnormality in the example patient’s z-maps for gain and lag corresponded to the known pathology of this patient.
DISCUSSION
Transfer function analysis is easily implemented, with fewer assumptions than conventional DSC tracer kinetic modelling approaches. However, it does not provide measures that directly correspond. Rather we suggest that gain reflects the magnitude of the BOLD changes, which depends on the volume of blood present in a voxel, and phase lag indicates the speed of the response which depends on the transit time of blood within a voxel. That these measures discriminated differences between regions which depend on pathology in the example patient demonstrates the possible diagnostic utility of TFA.CONCLUSION
Transfer function analysis of hypoxia-induced deoxyhemoglobin changes reflect the distribution of cerebrovascular perfusion parameters, providing an alternative to conventional DSC methods.Acknowledgements
The authors thank the MR technologists at Toronto Western Hospital and Vepeson Wijeya for experimental setup and troubleshooting. We also thank John Wood and his laboratory for his insightful comments on this methodology. This work was supported by the Holt-Hornsby and Andreae Vascular Dementia Research Unit in the Joint Department of Medical Imaging at the Toronto Western Hospital and the University Health Network.
References
1 Poublanc J, Sobczyk O, Shafi R, Sayin ES, Schulman J, Duffin J, Uludag K, Wood JC, Vu C, Dharmakumar R, et al. Perfusion MRI using endogenous deoxyhemoglobin as a contrast agent: Preliminary data. Magnetic Resonance in Medicine. 2021;86:3012-3021. doi: https://doi.org/10.1002/mrm.28974
2. McGehee BE, Pollock JM, Maldjian JA. Brain perfusion imaging: How does it work and what should I use? J Magn Reson Imaging. 2012;36:1257-1272. doi: 10.1002/jmri.23645
3. Sobczyk O, Battisti-Charbonney A, Poublanc J, Crawley AP, Sam K, Fierstra J, Mandell DM, Mikulis DJ, Duffin J, Fisher JA. Assessing cerebrovascular reactivity abnormality by comparison to a reference atlas. J Cereb Blood Flow Metab. 2015;35:213-220. doi: 10.1038/jcbfm.2014.184
Figures
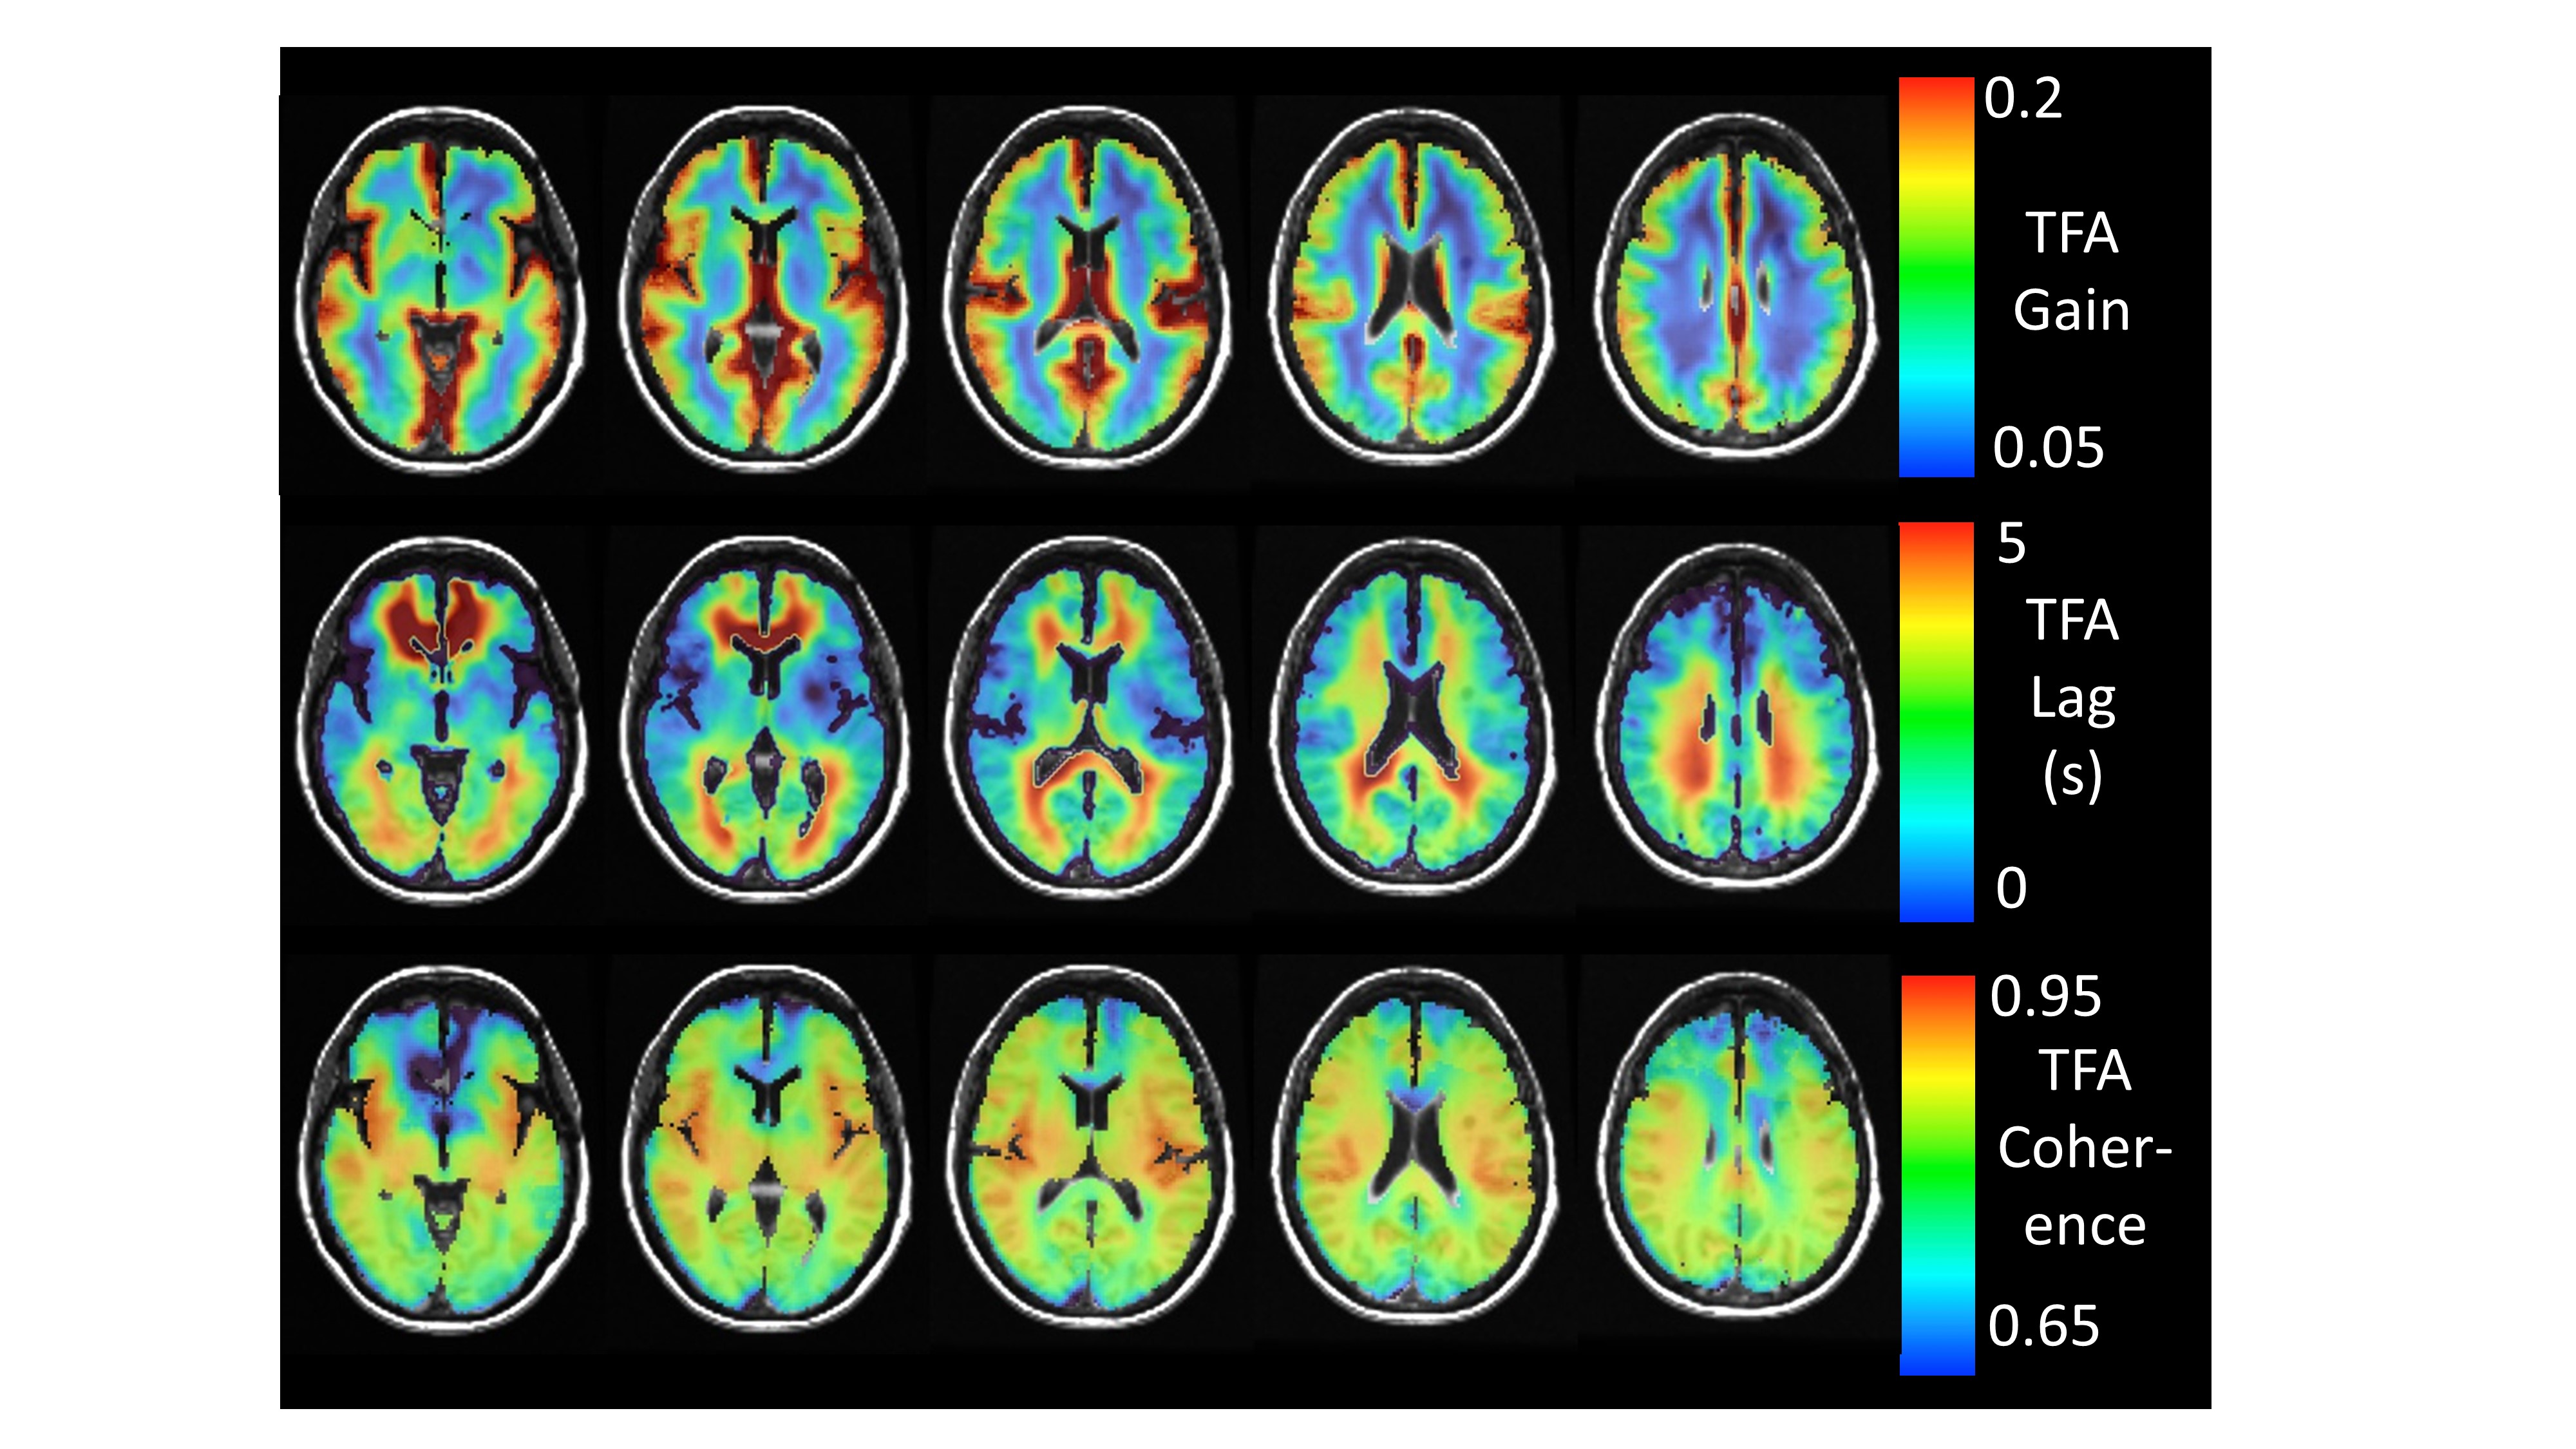
Representative axial slices of the healthy subject’s atlas TFA measures gain, lag and coherence.