3058
A python-based post-processing toolkit for rodent perfusion MRI1State Key Laboratory of Brain and Cognitive Science, Institute of Biophysics, Chinese Academy of Sciences, Beijing, China, 2University of Chinese Academy of Sciences, Beijing, China, 3Institute of Artificial Intelligence, Hefei Comprehensive National Science Center, Hefei, China
Synopsis
Keywords: Software Tools, Software Tools
We developed a python-based post-processing toolkit for rodent perfusion MRI with an easy-to-use graphical user interface (GUI). Until now, this toolkit provides interfaces for the post-processing of dynamic susceptibility contrast (DSC) MRI and flow-sensitive alternating inversion recovery (FAIR) pulsed arterial spin labeling (pASL). For each modality, the toolkit has function modules including image viewer, display of time series data, ROI tools, and visualization of quantitative parameter maps. This toolkit is open source and welcomes added features. It will benefit preclinical studies using perfusion MRI.Introduction
Magnetic resonance perfusion imaging encompasses multiple modalities of imaging techniques. They can be used to assess the perfusion of the brain and other organs in a variety of ways. The quantification of physiology parameters is one of the crucial steps for the application of perfusion MRI data. However, the diversity of perfusion MRI requires abundant knowledge of MR physics in the post-processing of perfusion data. Open-source post-processing tools are particularly scarce in preclinical studies, which hinders the application of perfusion MRI. In this work, we present a post-processing toolkit designed for preclinical perfusion MRI, which integrates the workflow of dynamic susceptibility contrast (DSC) and flow-sensitive alternating inversion recovery (FAIR) pulsed arterial spin labeling (pASL) into a one-stop graphical user interface.Methods
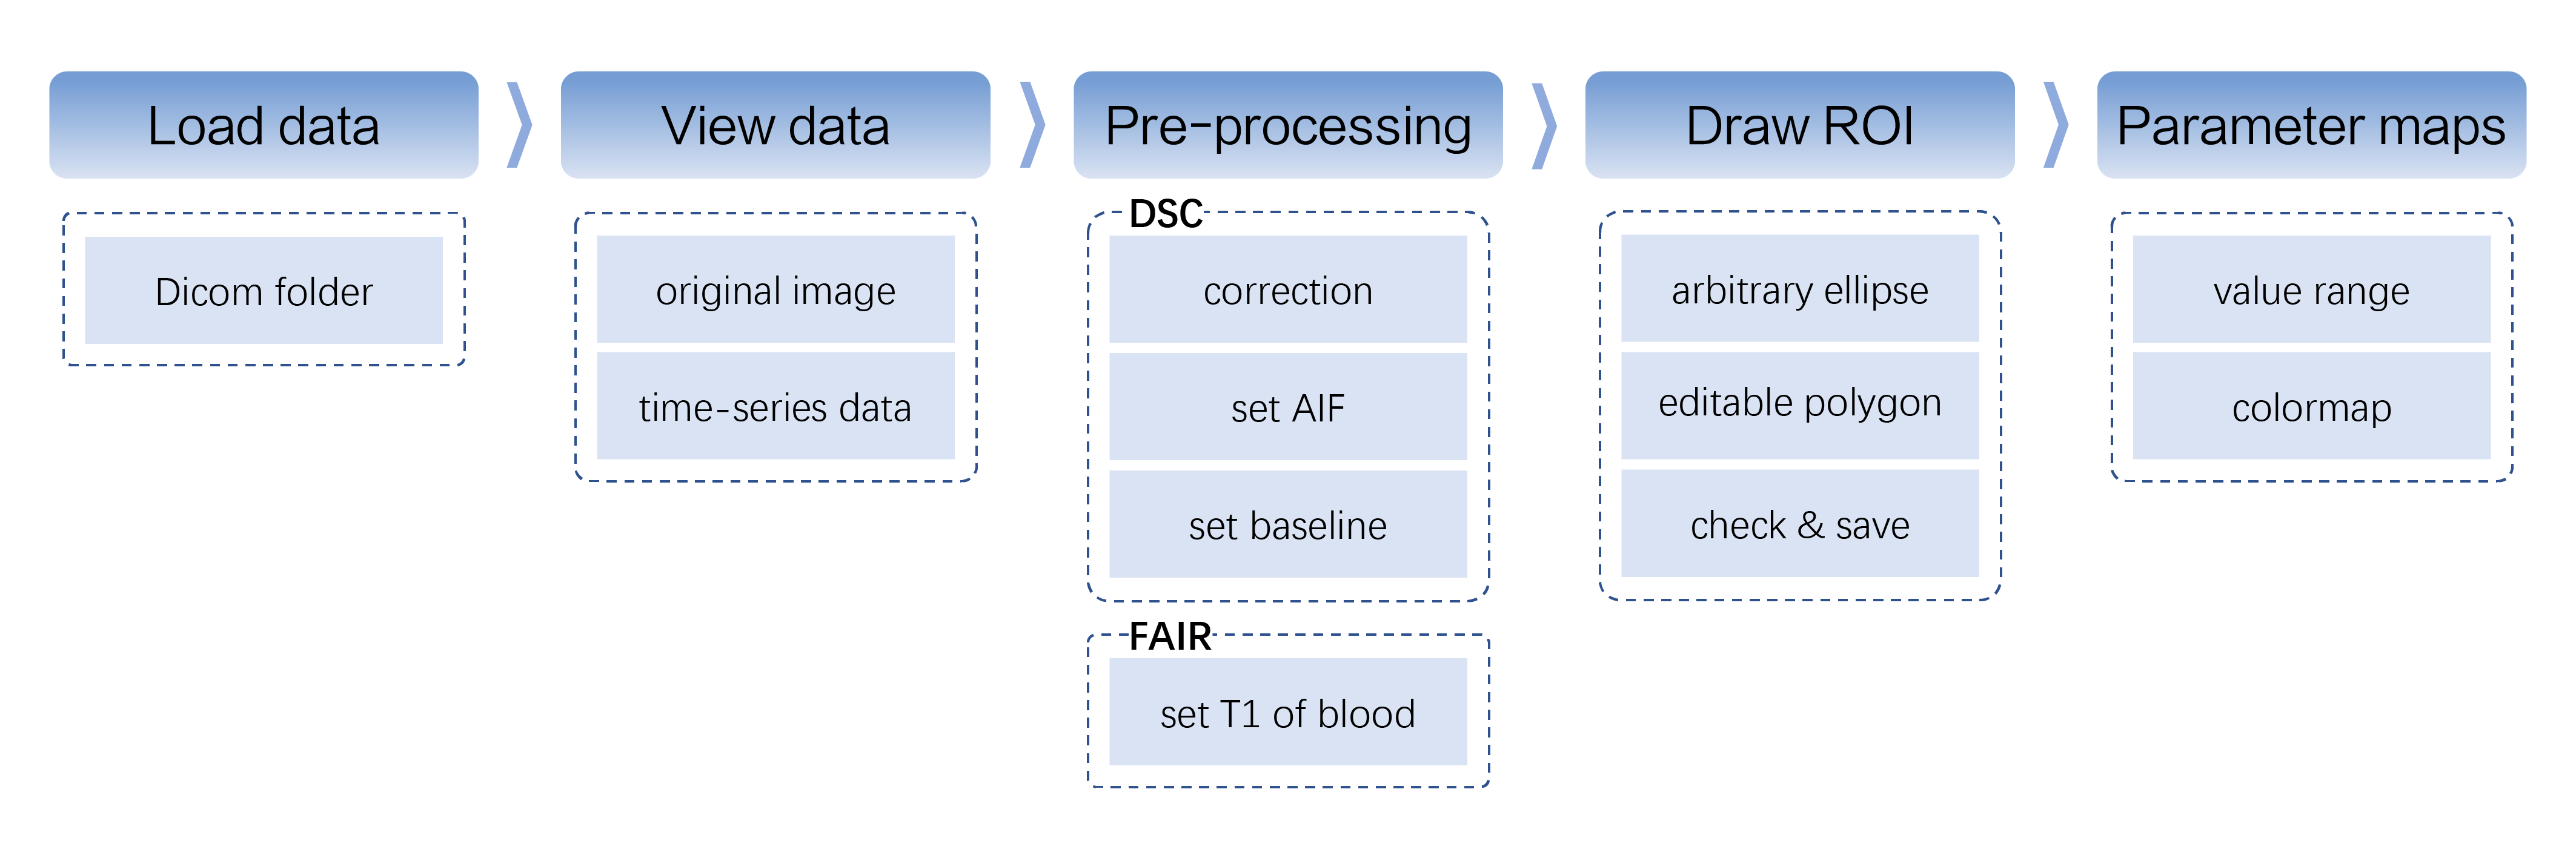
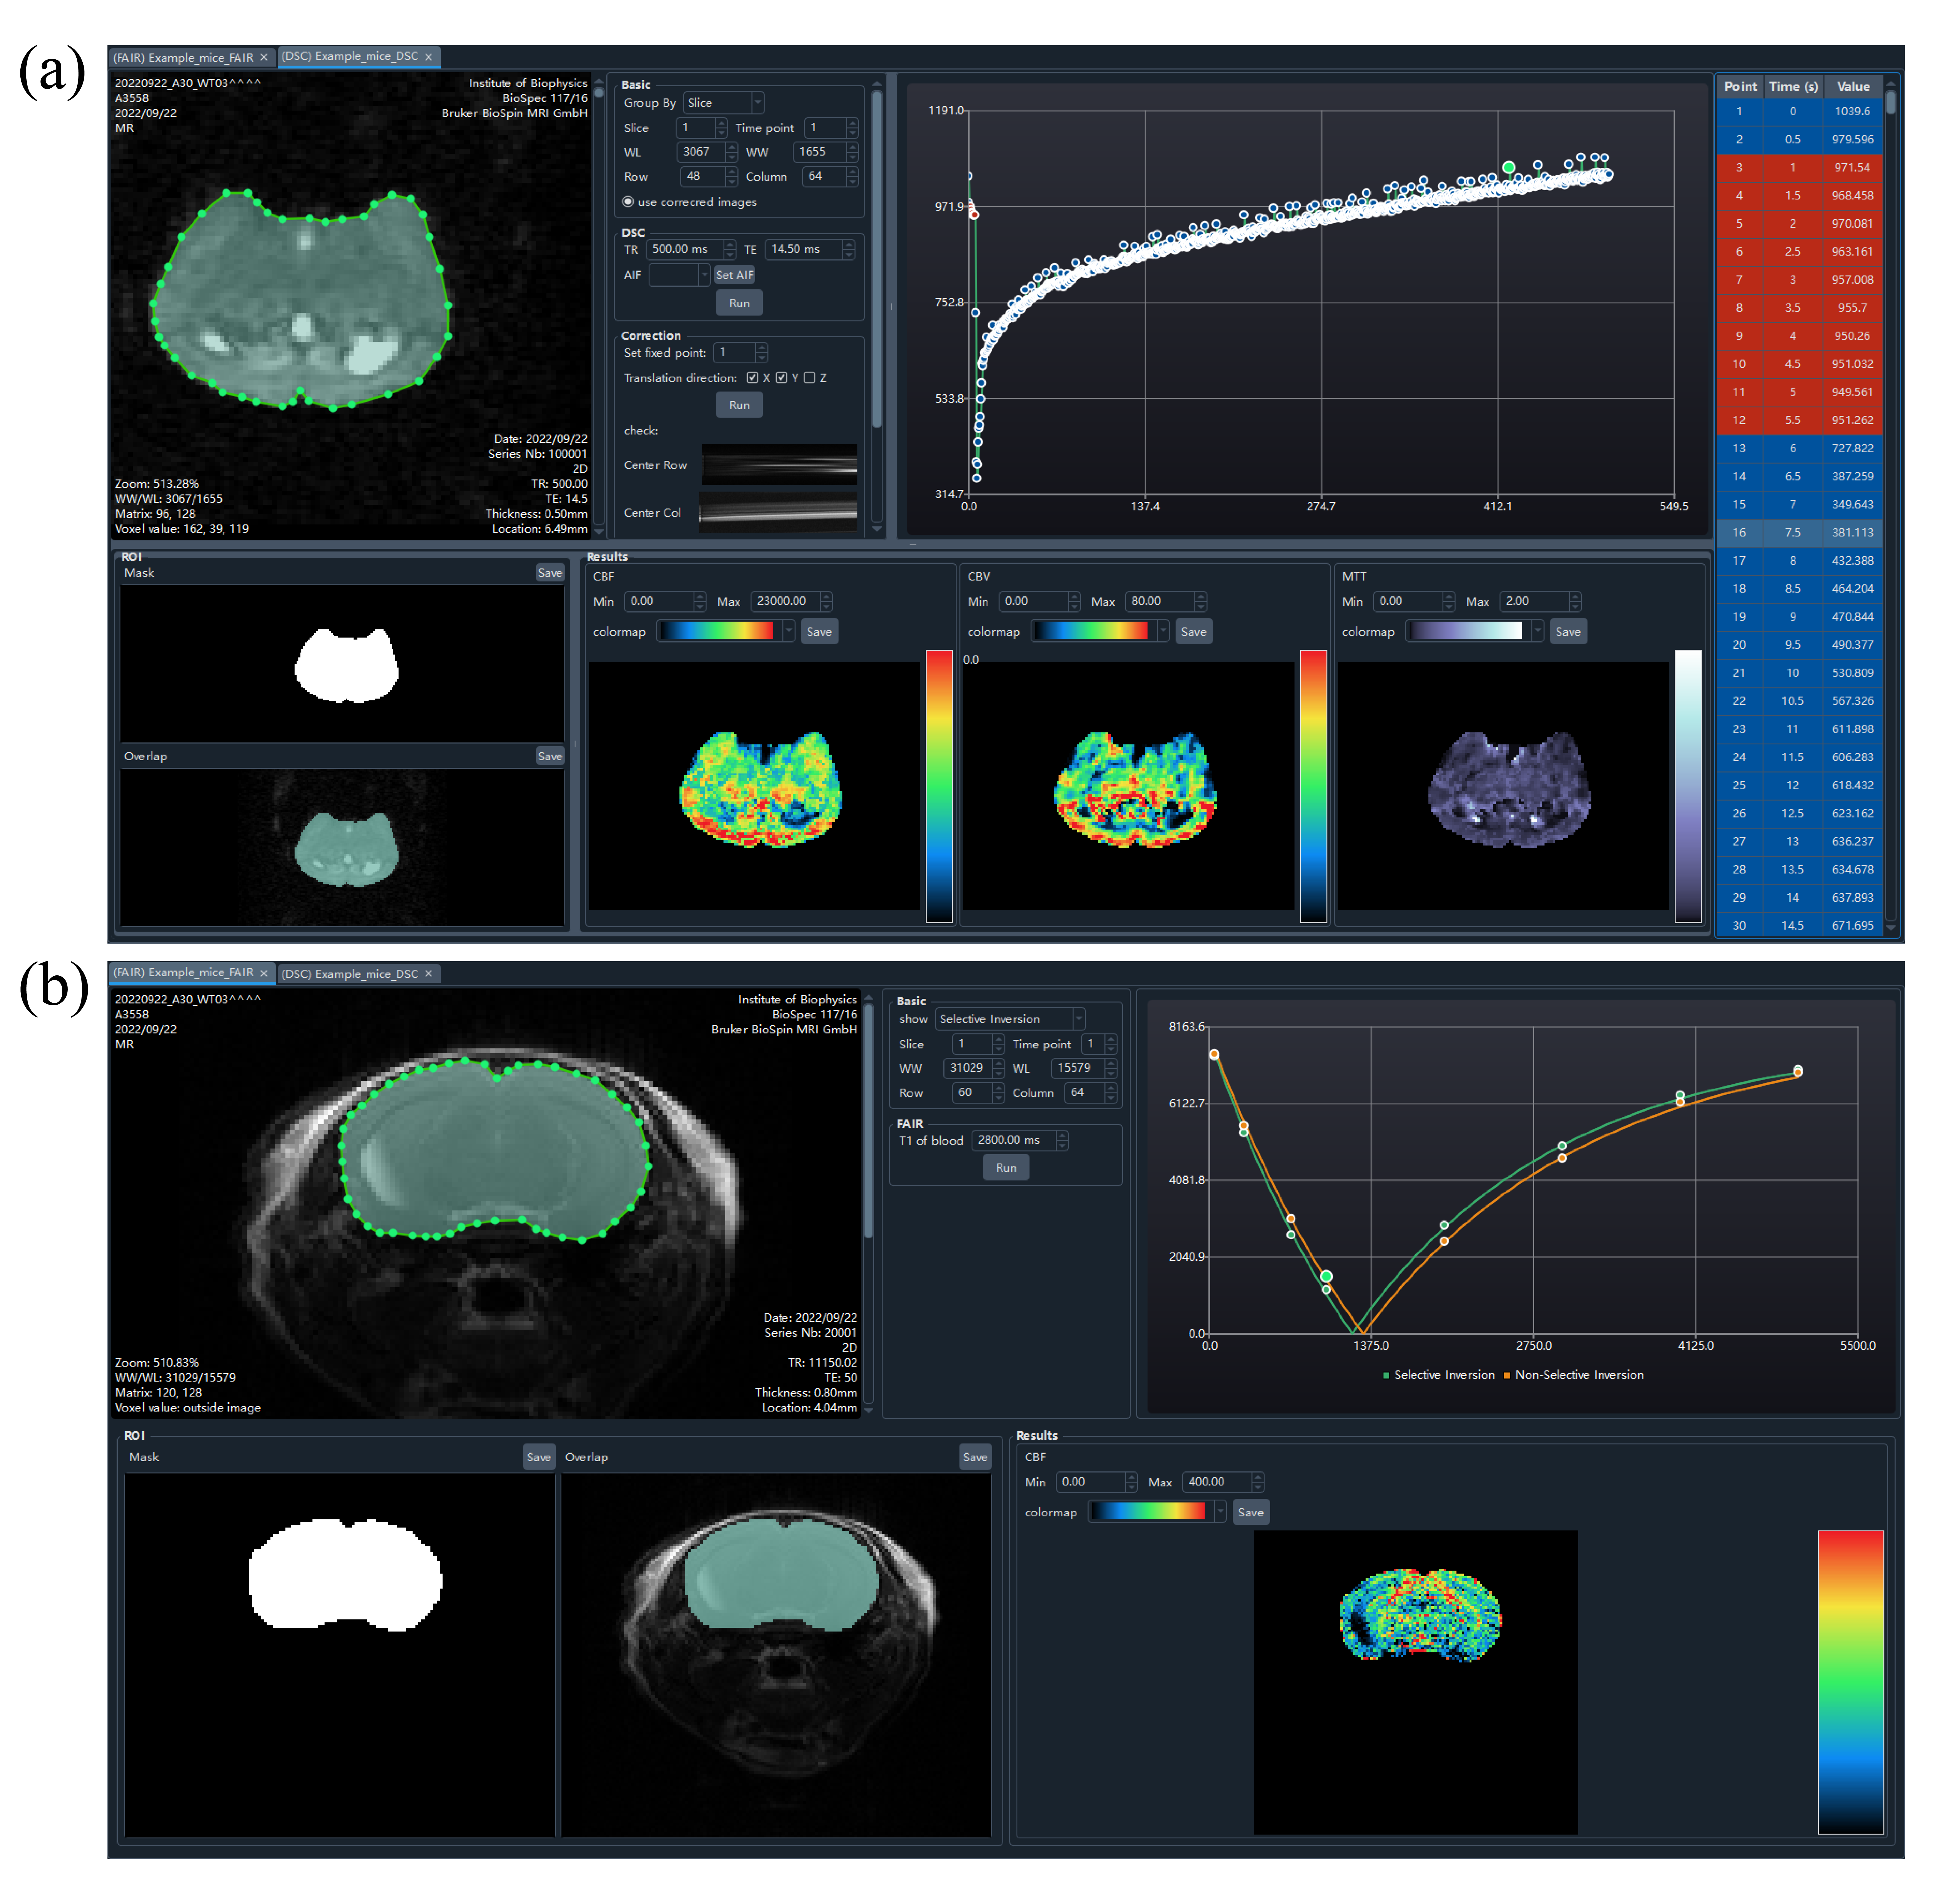
The toolkit was developed in Python 3.10 and could run without the requirement of any additional environment. All the processing scripts were integrated into the corresponding user interface built with PySide6 (https://wiki.qt.io/Qt_for_Python). It ensured that the toolkit can be deployed on multiple operating systems.The user can select a target folder to enter the DSC or FAIR post-processing pipeline, which was illustrated in Figure 1. For DSC post-processing, the workflow of OSIPI (https://osipi.org/task-force-2-3/) was adopted. For FAIR post-processing, custom scripts were built in reference to previous preclinical studies. After the post-processing, the quantitative parameter maps of the selected ROI were visualized and saved with selectable colormaps and customized value ranges, as shown in Figure 2. All source codes of our toolkit are available on GitHub (https://github.com/BennyZhang-Codes/PerfusionToolkitForRodent).
Workflow
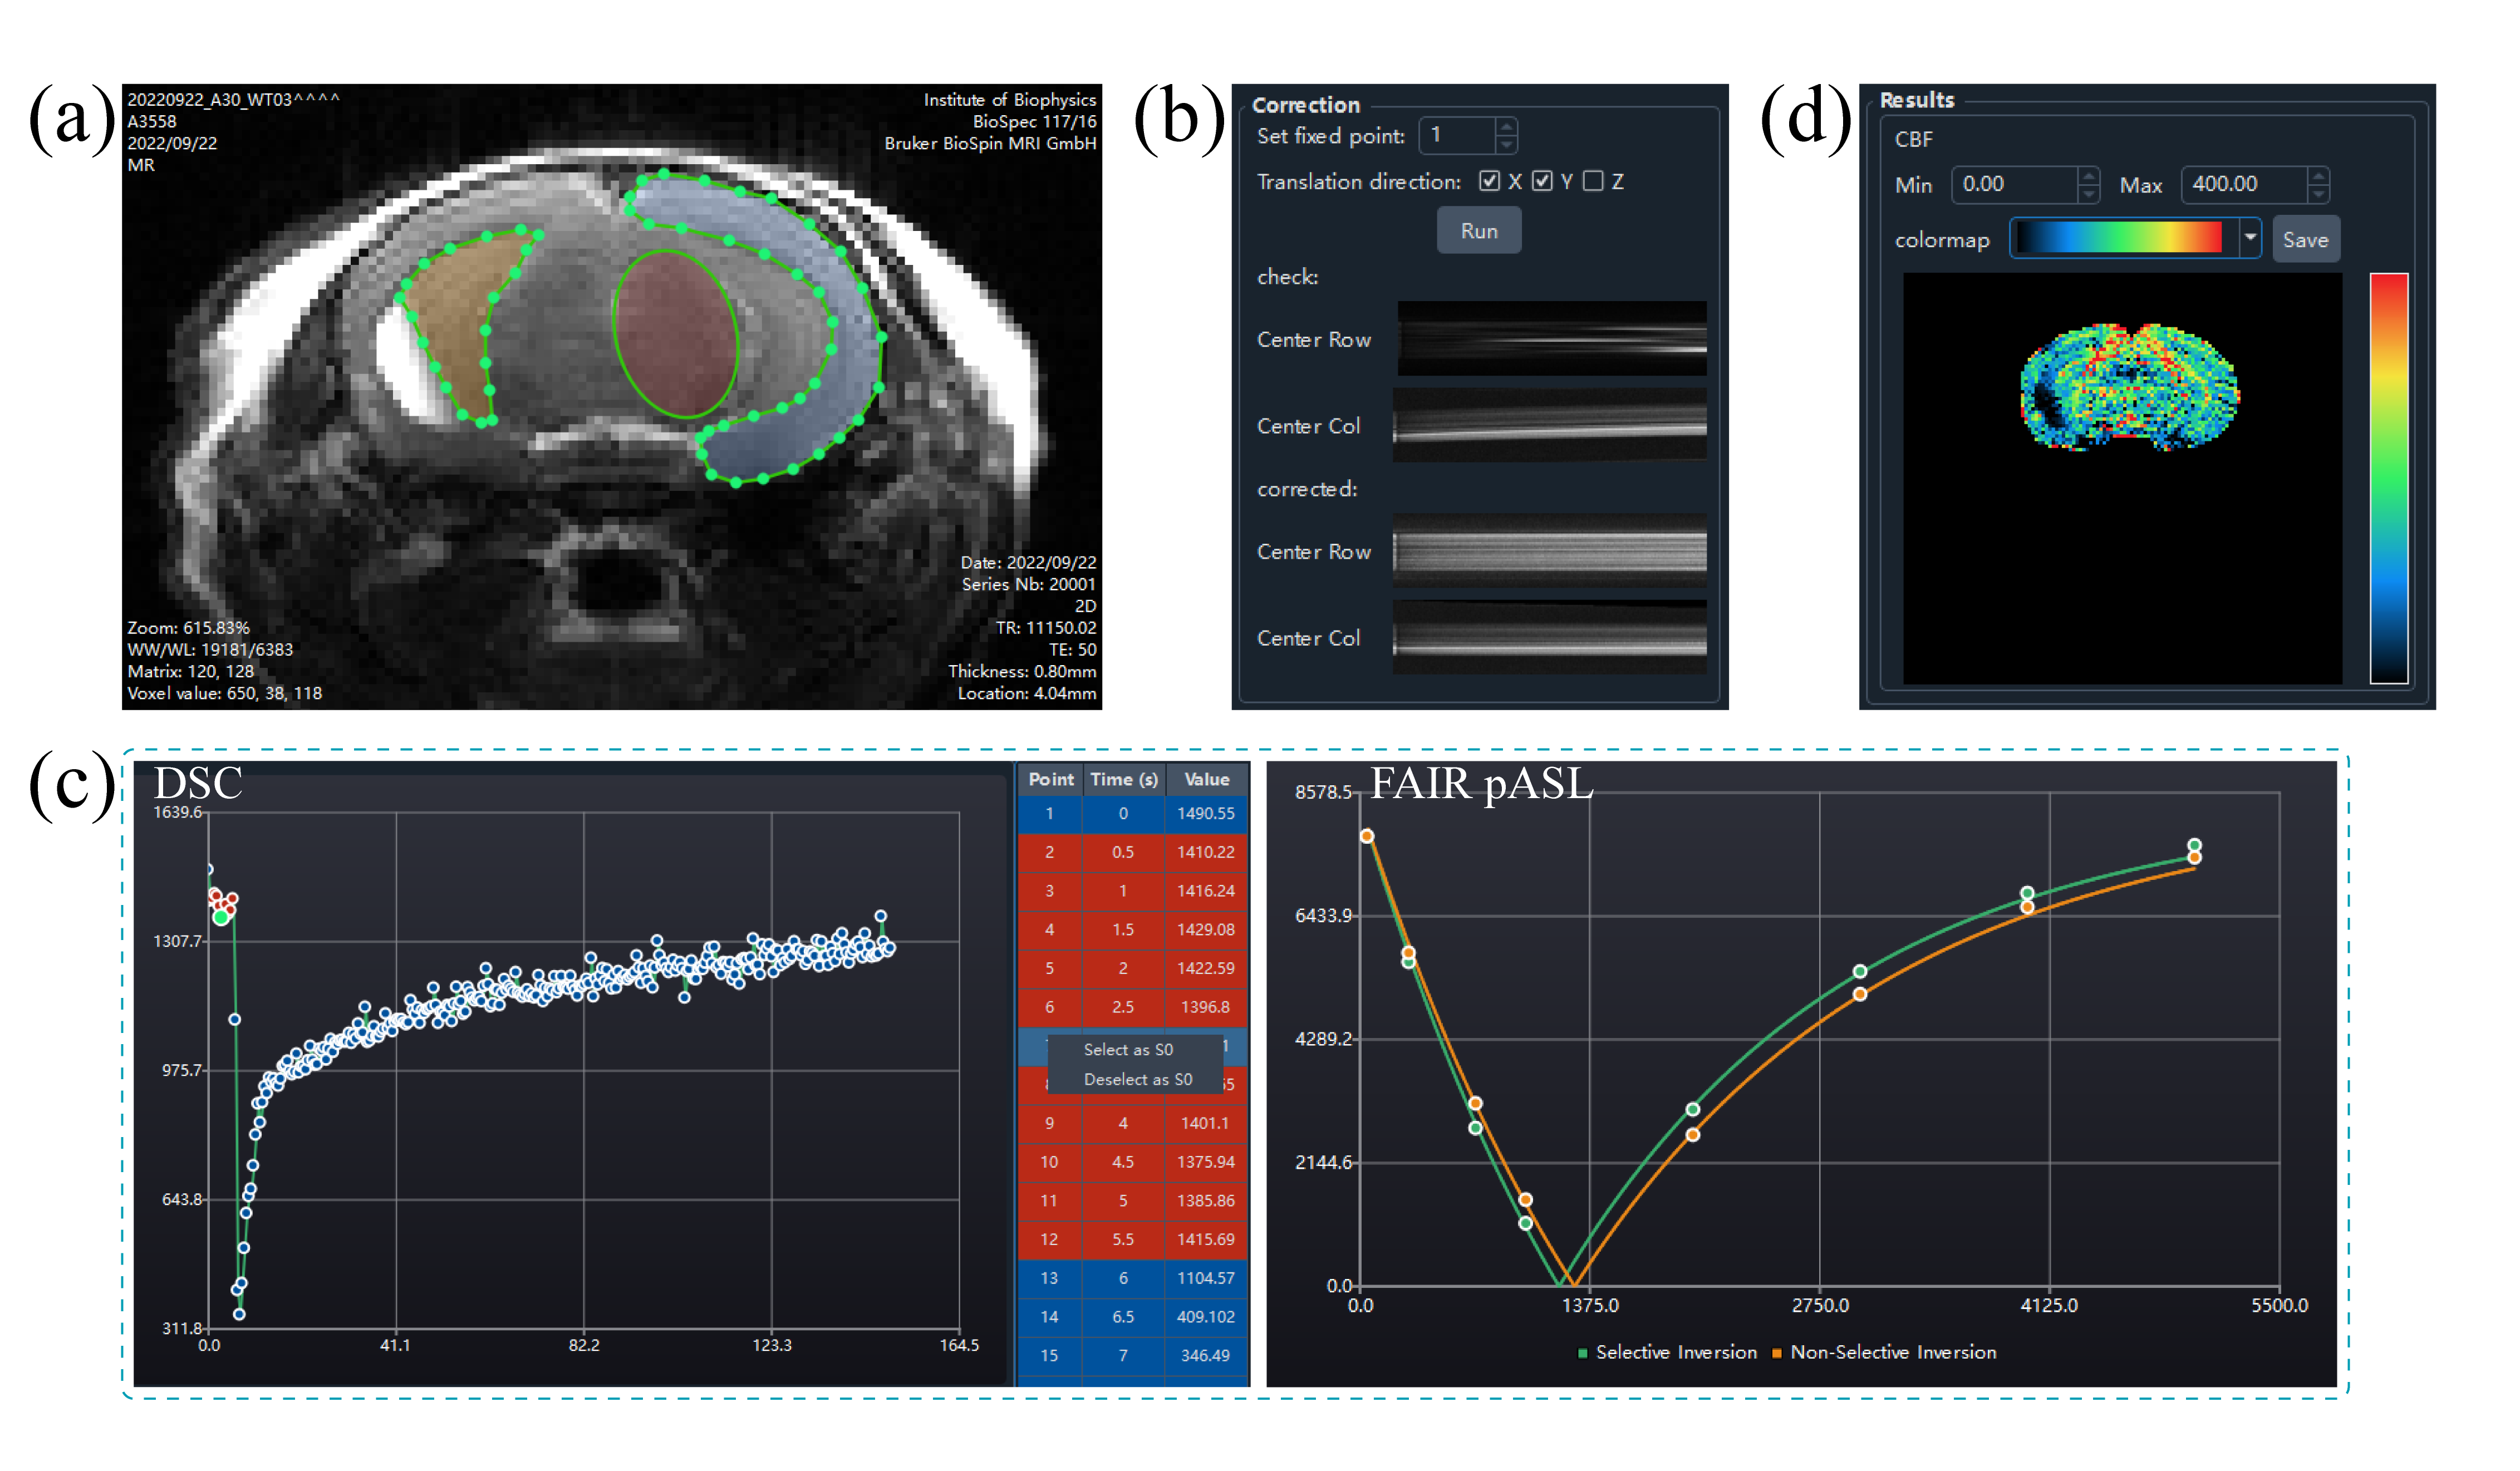
Imaging viewerBoth the DSC and FAIR post-processing interfaces embedded an image viewer (Figure 3a) with adjustable window width/level and scalable display size. The user can browse images among time series or labeling conditions. The drawing of regions of interest (ROI) was also done in the image viewer. In addition, the DSC data could be grouped by slice location or time point, which allows images to be viewed in different dimensions.
Time-series correction
In most preclinical scanners, the field drift during the long-term echo planar imaging (EPI) caused the displacement of the imaging object. The translational registration was therefore essential in the processing of DSC data, as shown in Figure 3b. The center lines of the original data and the corrected data (if corrected) were concatenated along the time and presented in the “Correction” area, which was convenient for a user to check the stability of DSC data along the time dimension.
ROI tool
After loading the images, the user can select a point or draw an ROI interactively. For both DSC and FAIR, as long as an ROI was drawn or a point was selected, the chart and the table (DSC only) would display the time-series data of the point or the ROI (regional average), as shown in Figure 3c. In addition, the toolkit would generate the corresponding mask and overlapped image automatically, which were presented in the “ROI” area. Only voxels inside the mask would be included in the calculation.
Calculation
For DSC, the interval time between two adjacent acquisitions and the echo time (TE) were read from the DICOM headers. The arterial input function (AIF) was obtained by scaling a preclinical AIF model1 to the concentration time curve of a manually defined ROI or voxel of arterial flow. The user could adjust the arterial ROI or voxel to inspect the profile of the corresponding concentration time curve and identify the sharpest concentration curve as the target artery. Then, the residual function was calculated by singular value decomposition and Tikhonov regularization with the optimal regularization parameter obtained by L-curve criterion2.
For FAIR pASL, the cerebral blood flow (CBF) was obtained by fitting the inversion-recovery function and magnetization difference model3. The T1 of blood was determined by specific measurements at different field strengths4,5.
Discussion & Conclusion
We developed a user-friendly toolkit in Python for analyzing rodent perfusion MRI, which is compatible with multiple operating systems. The toolkit organizes function modules including the image viewer, the ROI tools, the interactive viewports for time-series data, and quantitative parameter maps into an easy-to-use interface. So far, it allows the user to display and process DSC and FAIR data. For the post-processing of DSC data, it is crucial to select a proper AIF. The toolkit determines the AIF in an interactive way. Future work will provide more flexible solutions (fully automatic or semi-automatic methods) for the accurate estimation of AIF and improve the robustness in preclinical usage. Until now, only DSC and FAIR interfaces are developed. The pipelines for the post-processing of other perfusion methods need to be added, such as dynamic contrast enhancement (DCE) and continuous ASL.Acknowledgements
This study has received funding from the National Natural Science Foundation of China (82271985, 82001804, 8191101305), the Ministry of Science and Technology of China (2022ZD0211901, 2019YFA0707103), and the Natural Science Foundation of Beijing Municipality (7191003).References
1. McGrath DM, Bradley DP, Tessier JL, Lacey T, Taylor CJ, Parker GJ. Comparison of model-based arterial input functions for dynamic contrast-enhanced MRI in tumor bearing rats. Magnetic Resonance in Medicine. 2009; 61(5):1173-1184.
2. Sourbron S, Dujardin M, Makkat S, Luypaert R. Pixel-by-pixel deconvolution of bolus-tracking data: optimization and implementation. Physics in Medicine & Biology, 2007;52(2):429-47.
3. Kober F, Duhamel G, Cozzone PJ. Experimental comparison of four FAIR arterial spin labeling techniques for quantification of mouse cerebral blood flow at 4.7 T. NMR Biomed. 2008;21(8): 781-792.
4. Dobre MC, Ugurbil K, Marjanska M. Determination of blood longitudinal relaxation time (T1) at high magnetic field strengths. Magn. Reson. Imaging. 2007;25(5):733-5.
5. Lin AL, Qin Q, Zhao X, Duong TQ. Blood longitudinal (T1) and transverse (T2) relaxation time constants at 11.7 Tesla. Magn. Reson. Mater. Physics, Biol. Med. 2012;25(3):245–249.
Figures