3057
Cortical Blood Perfusion during Preclinical Migraine at 21.1 T using FAIR-PASL1National High Magnetic Field Laboratory, Florida State University, Tallahassee, FL, United States, 2Chemical & Biomedical Engineering, FAMU-FSU College of Engineering, Tallahassee, FL, United States
Synopsis
Keywords: Neurodegeneration, Arterial spin labelling, Migraine, FAIR-EPI
Migraine is a neurological disorder with neurovascular implications. Blood flow changes based on brain's activity and needs, so excessive neural activation during migraine is likely to make significant alterations to cortical blood perfusion. Therefore, cortical blood perfusion was measured using FAIR-PASL to monitor the progression in preclinical migraine in female Sprague-Dawley rats. Parameters for inversion RF pulse shape and slice thickness were optimized to achieve more robust fits for monitoring cortical blood perfusion during preclinical migraine.Introduction
Migraine, initially thought to be a neurovascular disorder, is a common neurological disorder especially among women. Migraine has dramatic ionic and metabolic dysregulation, including a distinct vasodilation component. Cerebral blood perfusion in the parenchyma may be altered due to the excessive neuronal activation requiring additional nutrients1,2. There are many discrepancies in the results of previous studies with some reporting hypoperfusion while others report inconclusive results. This study aims to evaluate cortical perfusion during the progression of migraine in a preclinical female model at 21.1 T. We also optimized for increased signal and detectability for perfusion at this high field strength and coil configuration.Methods
Animals: Female Sprague-Dawley rats were assigned to a migraine group (n=3) and a control group (n=2). The migraine group was administered 10 mg/kg nitroglycerin (NTG) while the control group was administered saline, both via an intraperitoneal line so that pre- (baseline) and post-injection scans could be acquired in situ while resident in the magnet. Rats were maintained at 2-3% isoflurane during scanning.MRI: MRI data were acquired using the 900-MHz, 21.1-T MRI scanner at the National High Magnetic Field Laboratory in Tallahassee, FL. Perfusion was measured using a flow-sensitive alternating inversion recovery (FAIR), pulsed arterial spin labeling (PASL) technique with a single-shot EPI readout. A single, 1-mm slice was placed in the midbrain, by the caudal lateral ventricles. The initial data was acquired at TE/TR = 16/6600 ms, and 0.2x0.2-mm in-plane resolution. The initial FAIR setup included the following eight inversion times: 100, 500, 1000, 1600, 2000, 3500, 5000 and 6500 ms. A selective inversion slice thickness of 8 mm was positioned symmetrically over the slice. Calculated inversion pulses were used initially. Three baseline scans were acquired for each animal, and scans were acquired every 10 min for 3 h post-injection. Subsequent optimization utilized a constant recovery of TRec = 8 s, which minimized saturation effects, and reduced resolution of 0.32x0.32-mm in-plane to increase the signal-to-noise ratio. The FAIR encoding was adapted to seven inversion times (200, 600, 1000, 1600, 2500, 4000 and 6600 ms) and the selective inversion slice was reduced to 5 mm.
Due to the suspected underestimation of perfusion by a numerically derived (calculated) inversion pulse, three-lobe sinc (migraine, n=1 and control, n=1) and sech (control, n=1) pulses also were investigated. Three baseline scans were acquired for each animal, and scans were acquired every 10 min for 2 h post-injection.
Processing: Images were segmented based on the first, high signal image (first inversion time). A segmentation of the cortical region was done using MATLAB’s Image Segmentation application. A simple inversion recovery fit was implemented based on the sum of ROI intensities to extract an approximated equilibrium magnetization (M0) and T1. The ΔM/M0 versus inversion time was fitted to a one-compartment kinetic model, where ΔM was the difference between the selective and non-selective inversion data3. A 3-parameter fit was applied to the baseline data of six animals for the initial scans to extract an average temporal bolus length (τ) and arrival time (δ) value. A 1-parameter fit was applied to refit baseline scans and fit the time series scans, using the average τ and δ. Percent changes were calculated to monitor the cerebral blood flow (CBF) changes during the progression of preclinical migraine.
Results & Discussion
FAIR-EPI data in the axial direction was anatomically accurate and robust against geometric distortions, even at ultra-high field (Figure 1). However, the initial setup yielded an average CBF baseline value of 50 mL/100g/min, which is much lower than published literature values for the Sprague Dawley rats (150-500 mL/100g/min)4. This discrepancy is likely because the data did not seem to provide reproducible trends and thus the model was ill-fitting (Figure 2). It would be expected that CBF would increase during preclinical migraine compared to controls; however, no trend could be established with the initial setup.For subsequent scans, we aimed to increase signal and perfusion detection. Indeed, detectability was increased and reproducible trends were established (Figures 3 and 4). Model fitting was significantly improved, yielding average CBF in the range of published values.
Initial migraine progression data was acquired with the updated scan parameters, as shown in Figure 5. Figure 5 shows that both migraine rat and control rats had an initial increase compared to baseline following administration of either saline or NTG, followed by a steady decline in cortical perfusion. The migraine (NTG) rat seemed to have a less pronounced relative cerebral blood flow change that persisted over the post-injection time course compared to the saline control.
Conclusions
Optimization of the perfusion setup allowed for greater cortical blood perfusion detection. These optimization steps included changing inversion pulse types, reducing resolution, reducing inversion slice thickness, and changing the repetition time of TR = 6.6 s to a constant recovery of TRec = 8 s.Following this optimization, more robust measurements of perfusion were acquired, which allowed the monitoring of preclinical migraine progression. Based on current evidence, we expect to see modified elevated cortical blood perfusion response in the migraine group compared to the control saline group.
Acknowledgements
All work has been done in accordance with the Florida State University Animal Care and Use Committees. This work was supported by the US NIH (R01-NS072497) and the US National High Magnetic Field Laboratory, which is supported by the National Science Foundation (DMR-1644779) and the State of Florida. Thanks to Drs. Charith Perera and Jack Wells from University College London for their assistance with data processing and discussions about FAIR perfusion implementation.
References
1. Abad N, Rosenberg JT, Hike DC, Harrington MG, Grant SC. Dynamic Sodium Imaging at Ultra-High Field Reveals Progression in a Preclinical Migraine Model. Pain. 2018;159(10):2058-2065. doi:10.1097/j.pain.0000000000001307
2. Abad N, Rosenberg JT, Roussel T, Grice DC, Harrington MG, Grant SC. Metabolic Assessment of a Migraine Model using Relaxation-Enhanced 1H Spectroscopy at Ultra-High Field. Magn Reson Med. 2018;79(3):1266-1275. doi:10.1002/mrm.26811
3. Alsop DC, Detre JA. Reduced Transit-Time Sensitivity in Noninvasive Magnetic Resonance Imaging of Human Cerebral Blood Flow. J Cereb Blood Flow Metab. 1996;16(6):1236-1249. doi:10.1097/00004647-199611000-00019
4.Hendrich KS, Kochanek PM, Williams DS, Schiding JK, Marion DW, Ho C. Early perfusion after controlled cortical impact in rats: Quantification by arterial spin-labeled MRI and the influence of spin-lattice relaxation time heterogeneity. Magn Reson Med. 1999;42(4):673-681. doi:10.1002/(SICI)1522-2594(199910)42:4<673::AID-MRM8>3.0.CO;2-B
Figures
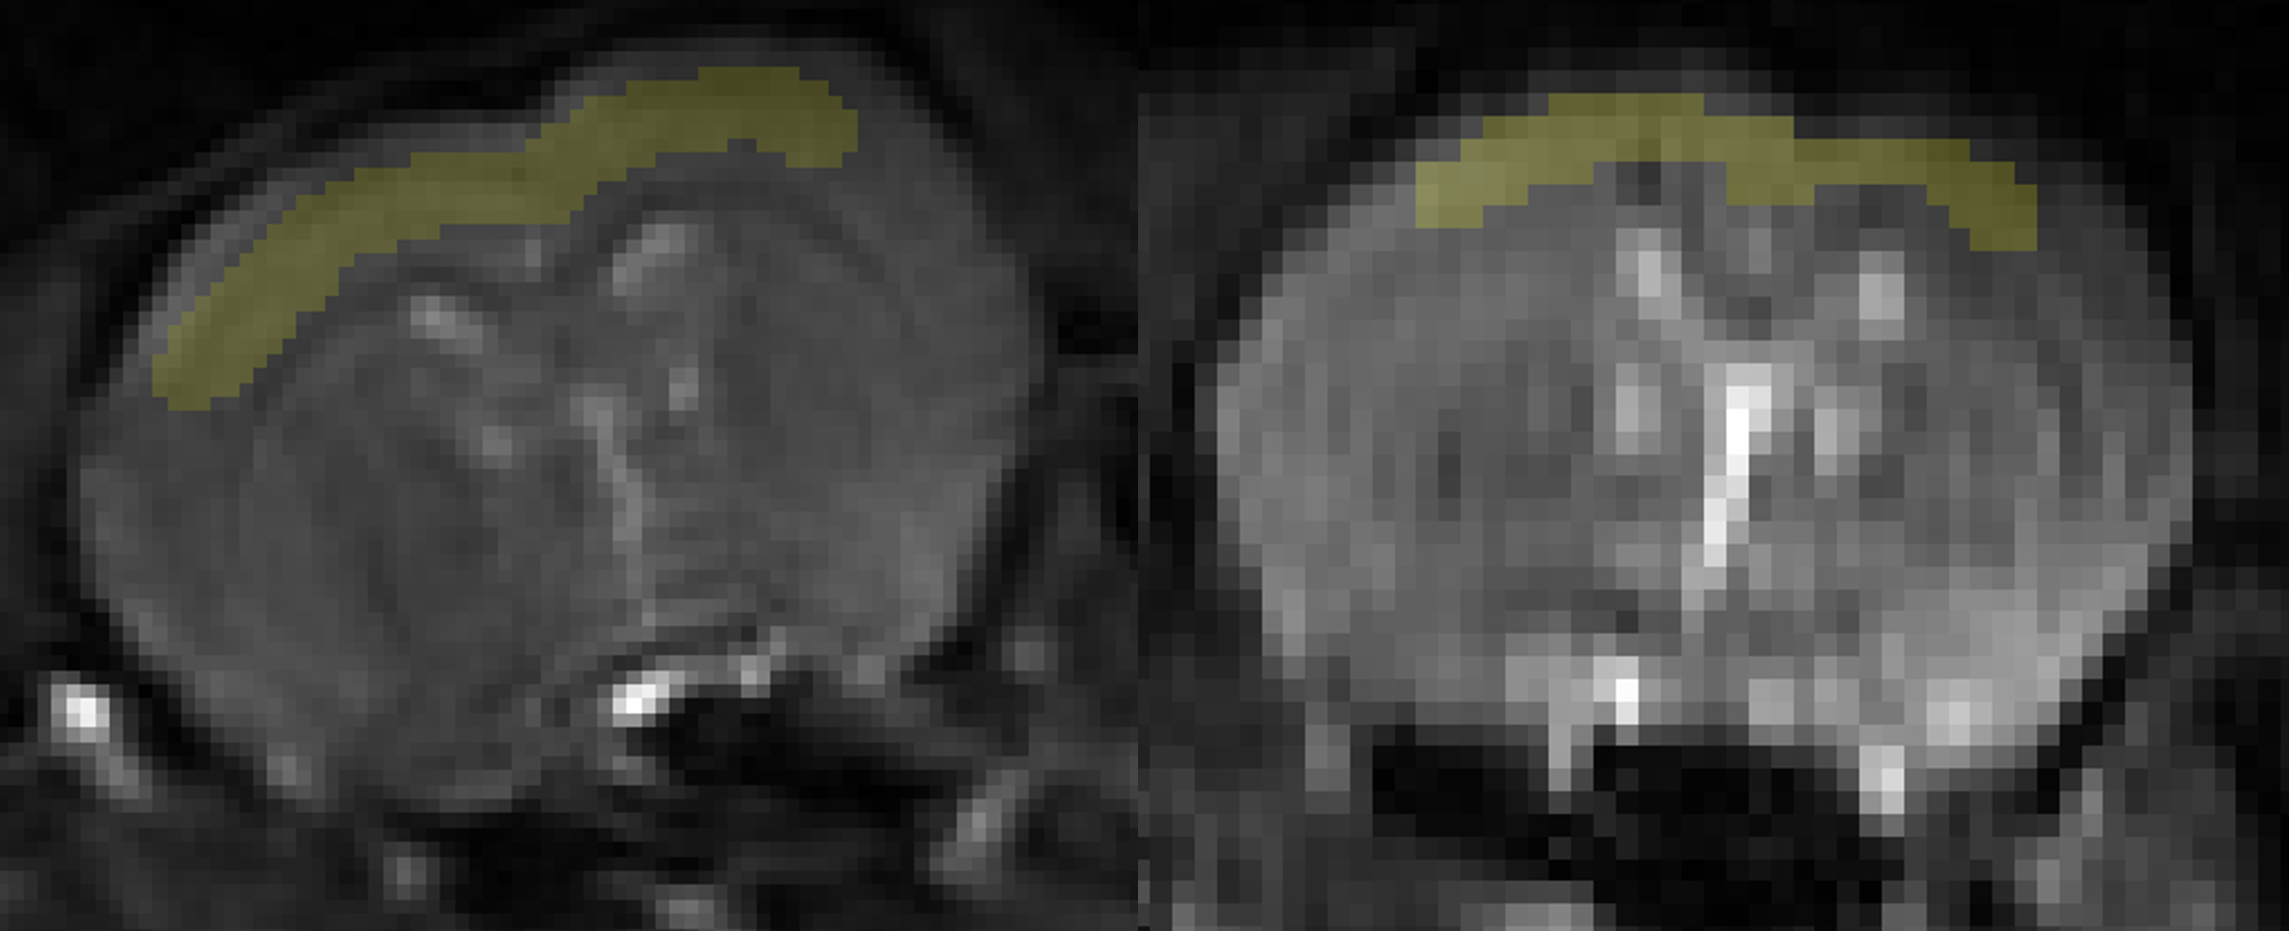
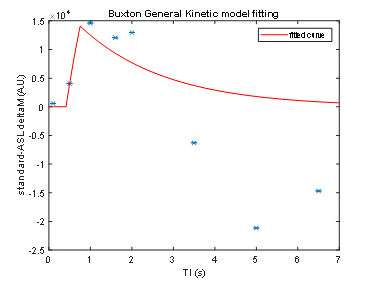
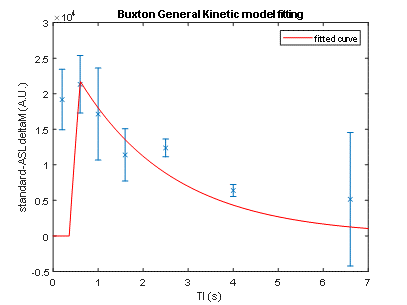
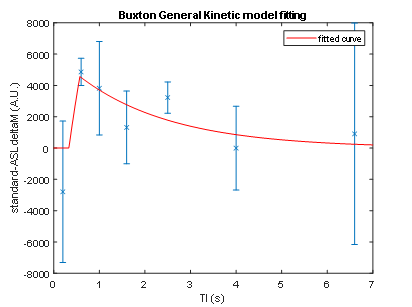
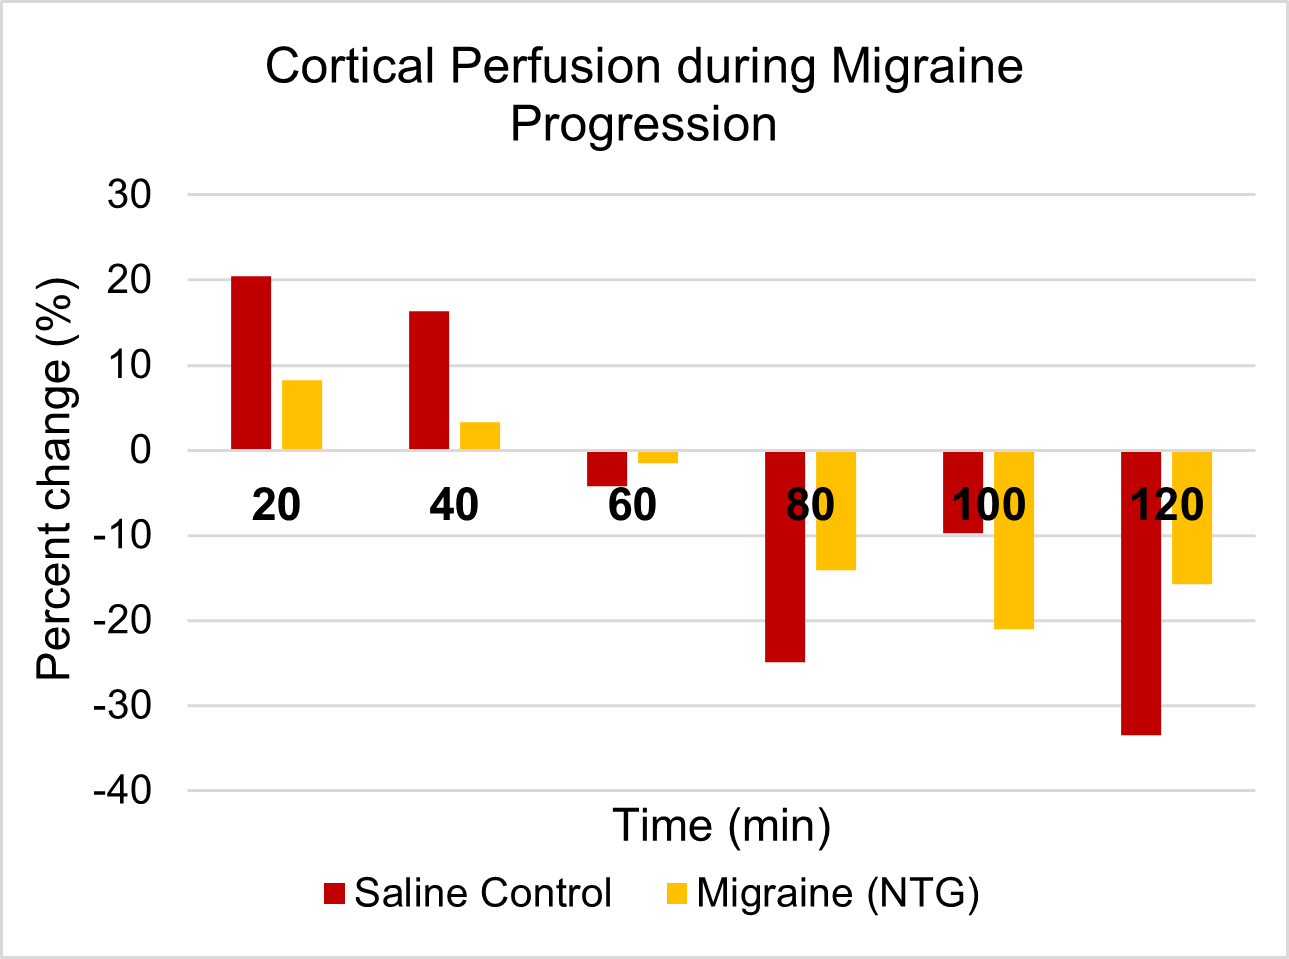
Figure 5: Percent change of relative cortical blood perfusion during migraine progression using a sinc3 inversion pulse.