3056
Multi-shell DTI diffusion MRI Based Graph Theory Measures for Prediction of Cognitive Impairment in the Alzheimer’s Disease Connectome Project1Department of Radiology, University of Wisconsin-Madison, Madison, WI, United States, 2Waisman Center, University of Wisconsin-Madison, Madison, WI, United States, 3Department of Neurology, University of Wisconsin-Madison, Madison, WI, United States, 4Department of Medical Physics, University of Wisconsin-Madison, Madison, WI, United States, 5Medical College of Wisconsin, Milwaukee, WI, United States, 6Department of Medicine, University of Wisconsin-Madison, Madison, WI, United States
Synopsis
Keywords: Alzheimer's Disease, Brain Connectivity
The prevalence of Alzheimer’s Dementia (AD) is on the rise, with an estimated economic burden to the US rivaling that of diabetes. Graph theory (GT) offers topological measures that can be used to detect connectivity changes due to aging and AD related processes. We aim to investigate the utility of GT measures based on multi-shell diffusion MRI (ms-dMRI) in discriminating aging individuals with cognitive impairment (CI) from healthy controls, and to find any intrinsic differences within the cognitively impaired subjects by clustering on the GT measures.Purpose
To assess the utility of GT measures as a clinical tool in assessing CI, both in distinguishing CI from healthy controls and in identifying differences within the CI group.Methods
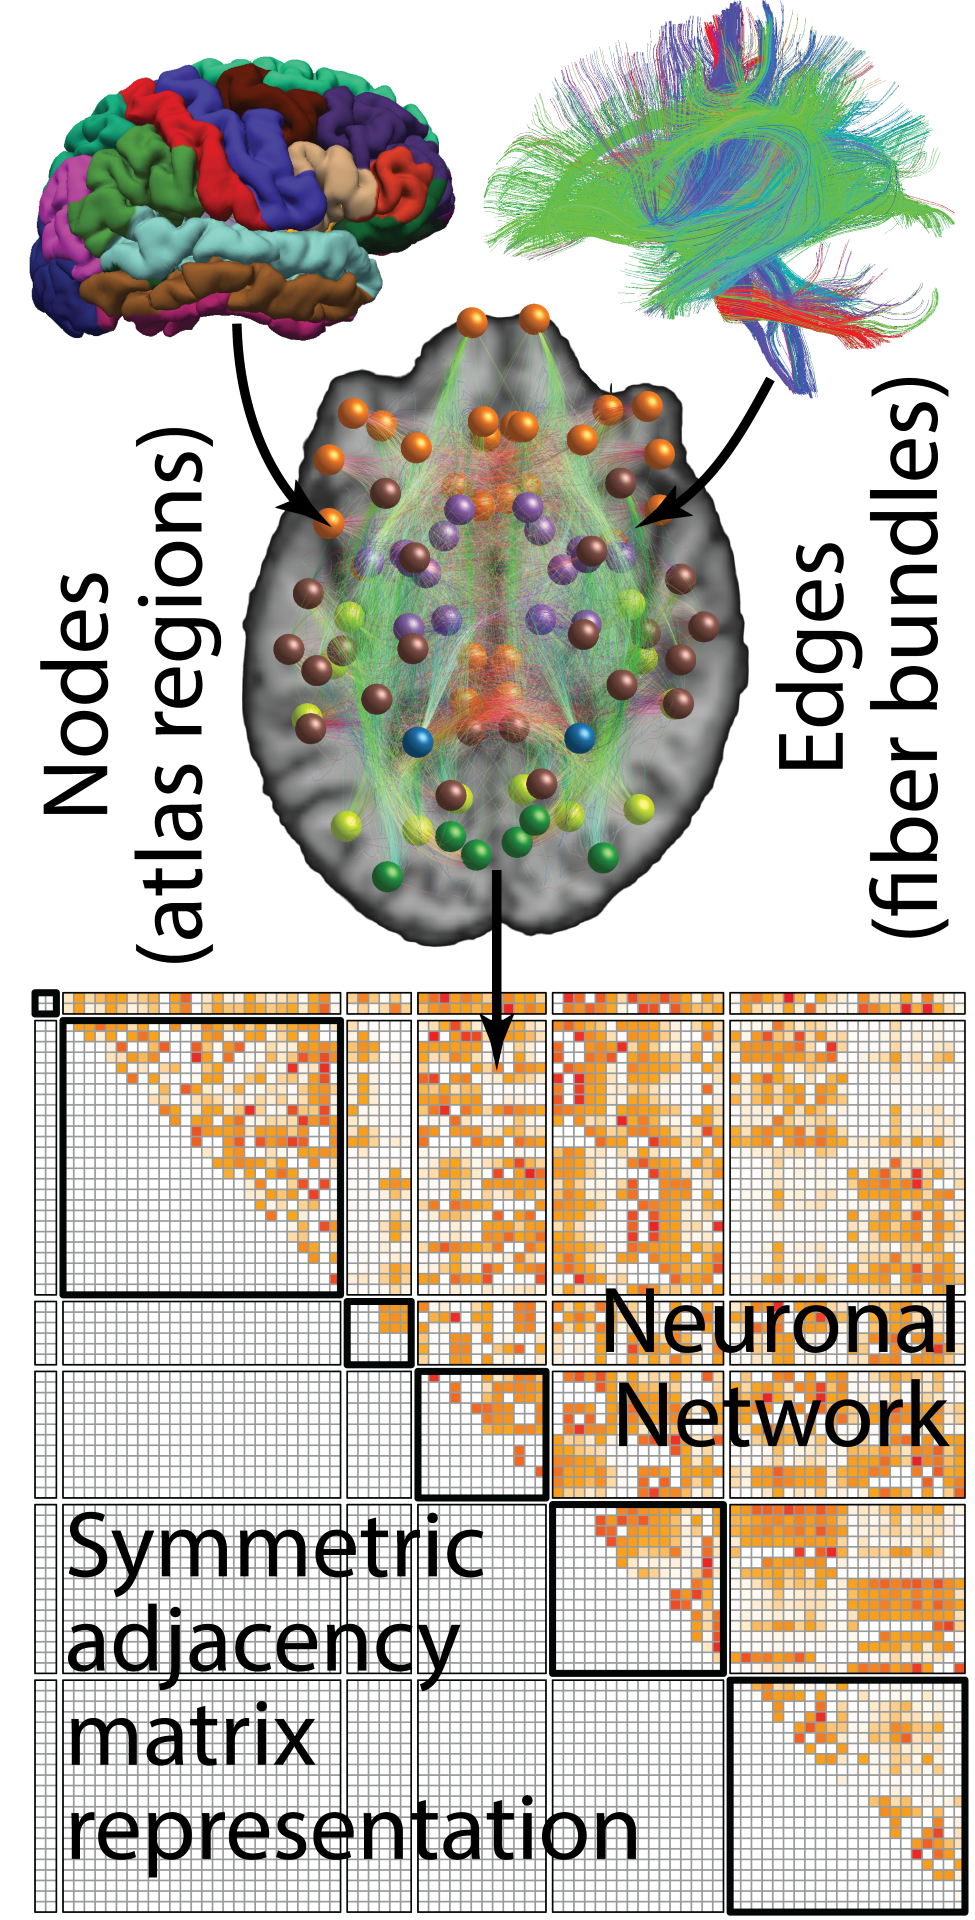
22 (mean age 74.8 years, 13 female) AD, 30 (mean age 72.0 years, 9 female) mild cognitive impairment (MCI), and 69 control (mean age 67.0 years, 43 female) participants (total n=121) with ms-dMRI were analyzed. Brain connectivity networks using the fiber bundle capacity (FBC) measure1 were extracted from the data using DESIGNER2 image processing guidelines using tools implemented in FSL3, ANTS4, and MRtrix35 (overview panel in Fig. 1). The following GT measures were derived from the FBC based weighted graphs using igraph R package6: average degree, strength, betweenness, clustering coefficient, global efficiency, and modularity. These were used as factors in a support vector machine (SVM) analysis to discriminate between CI and healthy controls, and in a k-means clustering algorithm, with Silhouette method7 for selecting k, to find intrinsic structural phenotypes within the CI group.Results
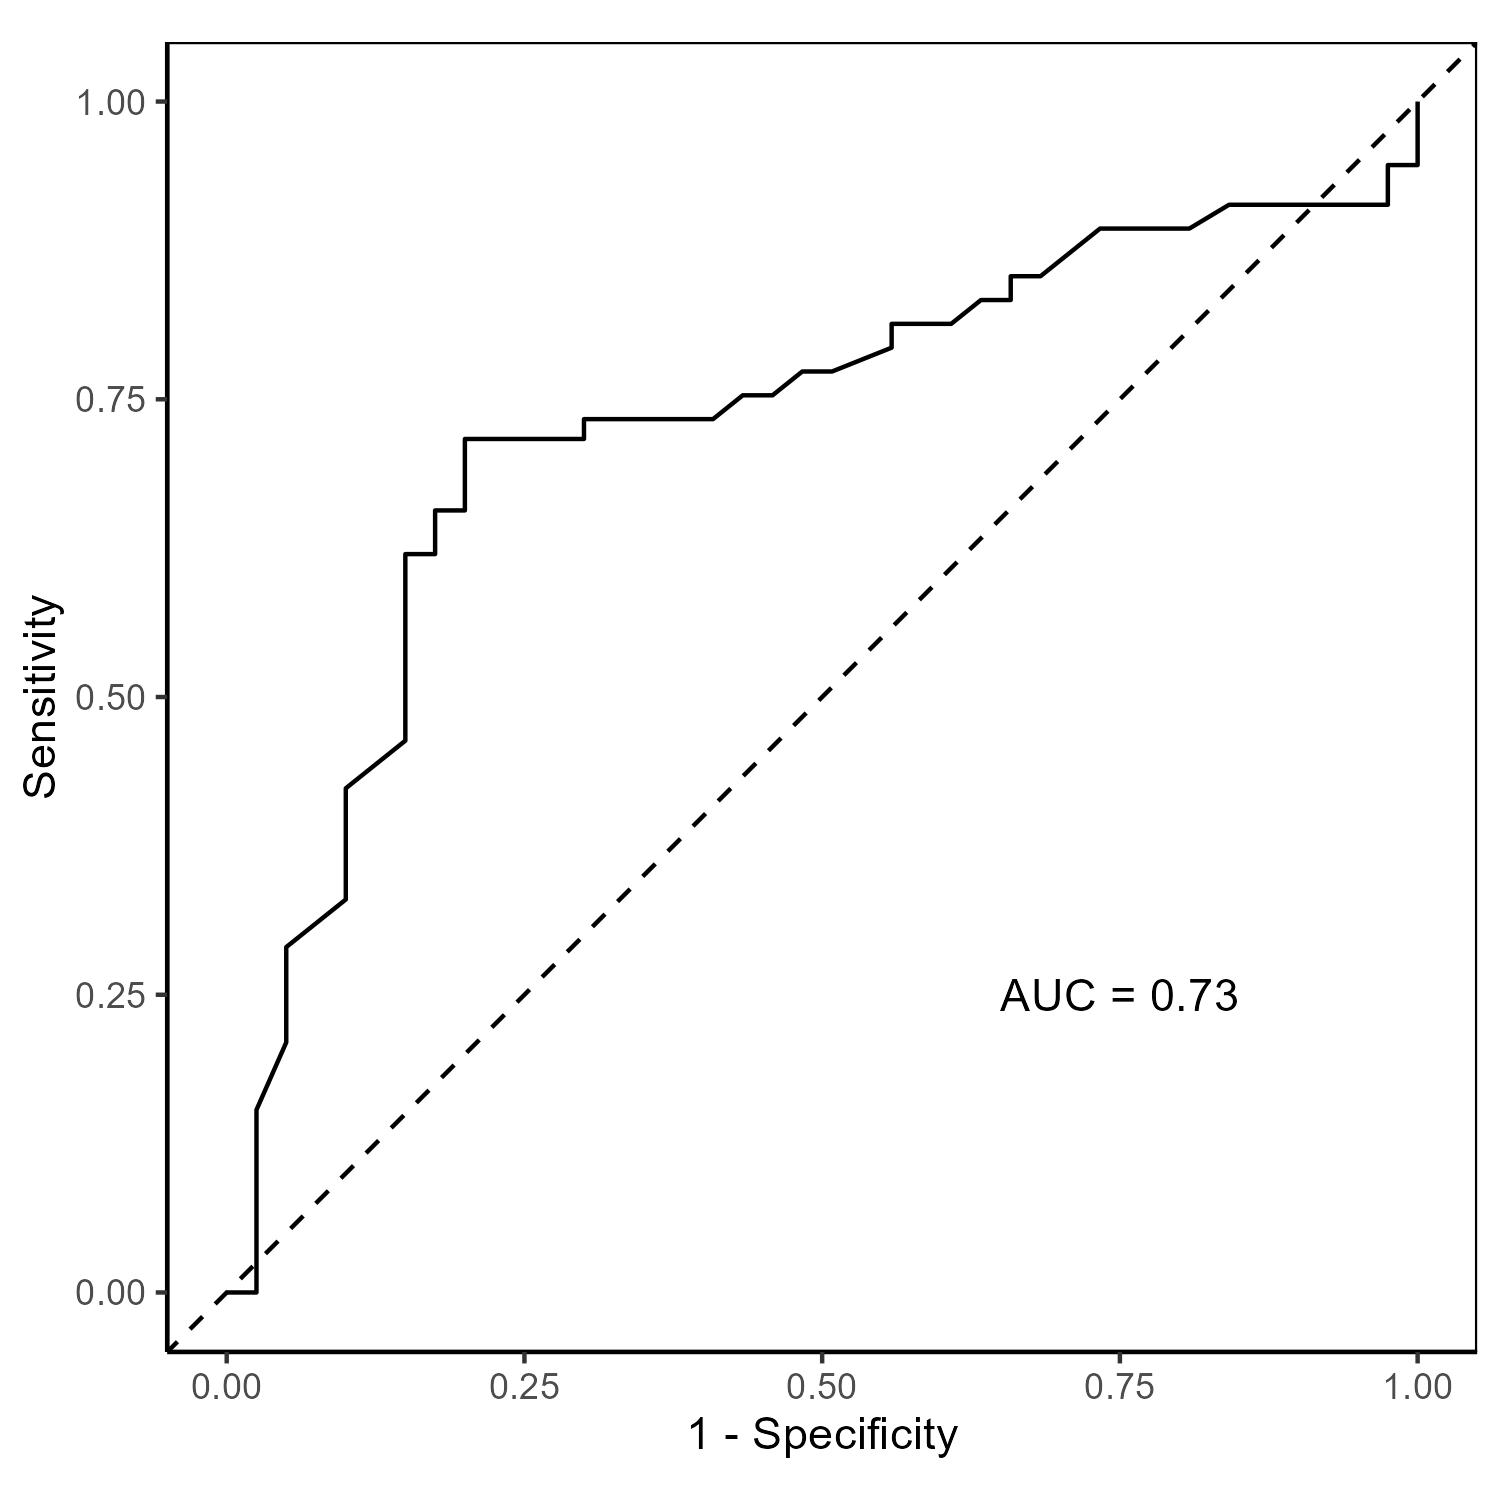
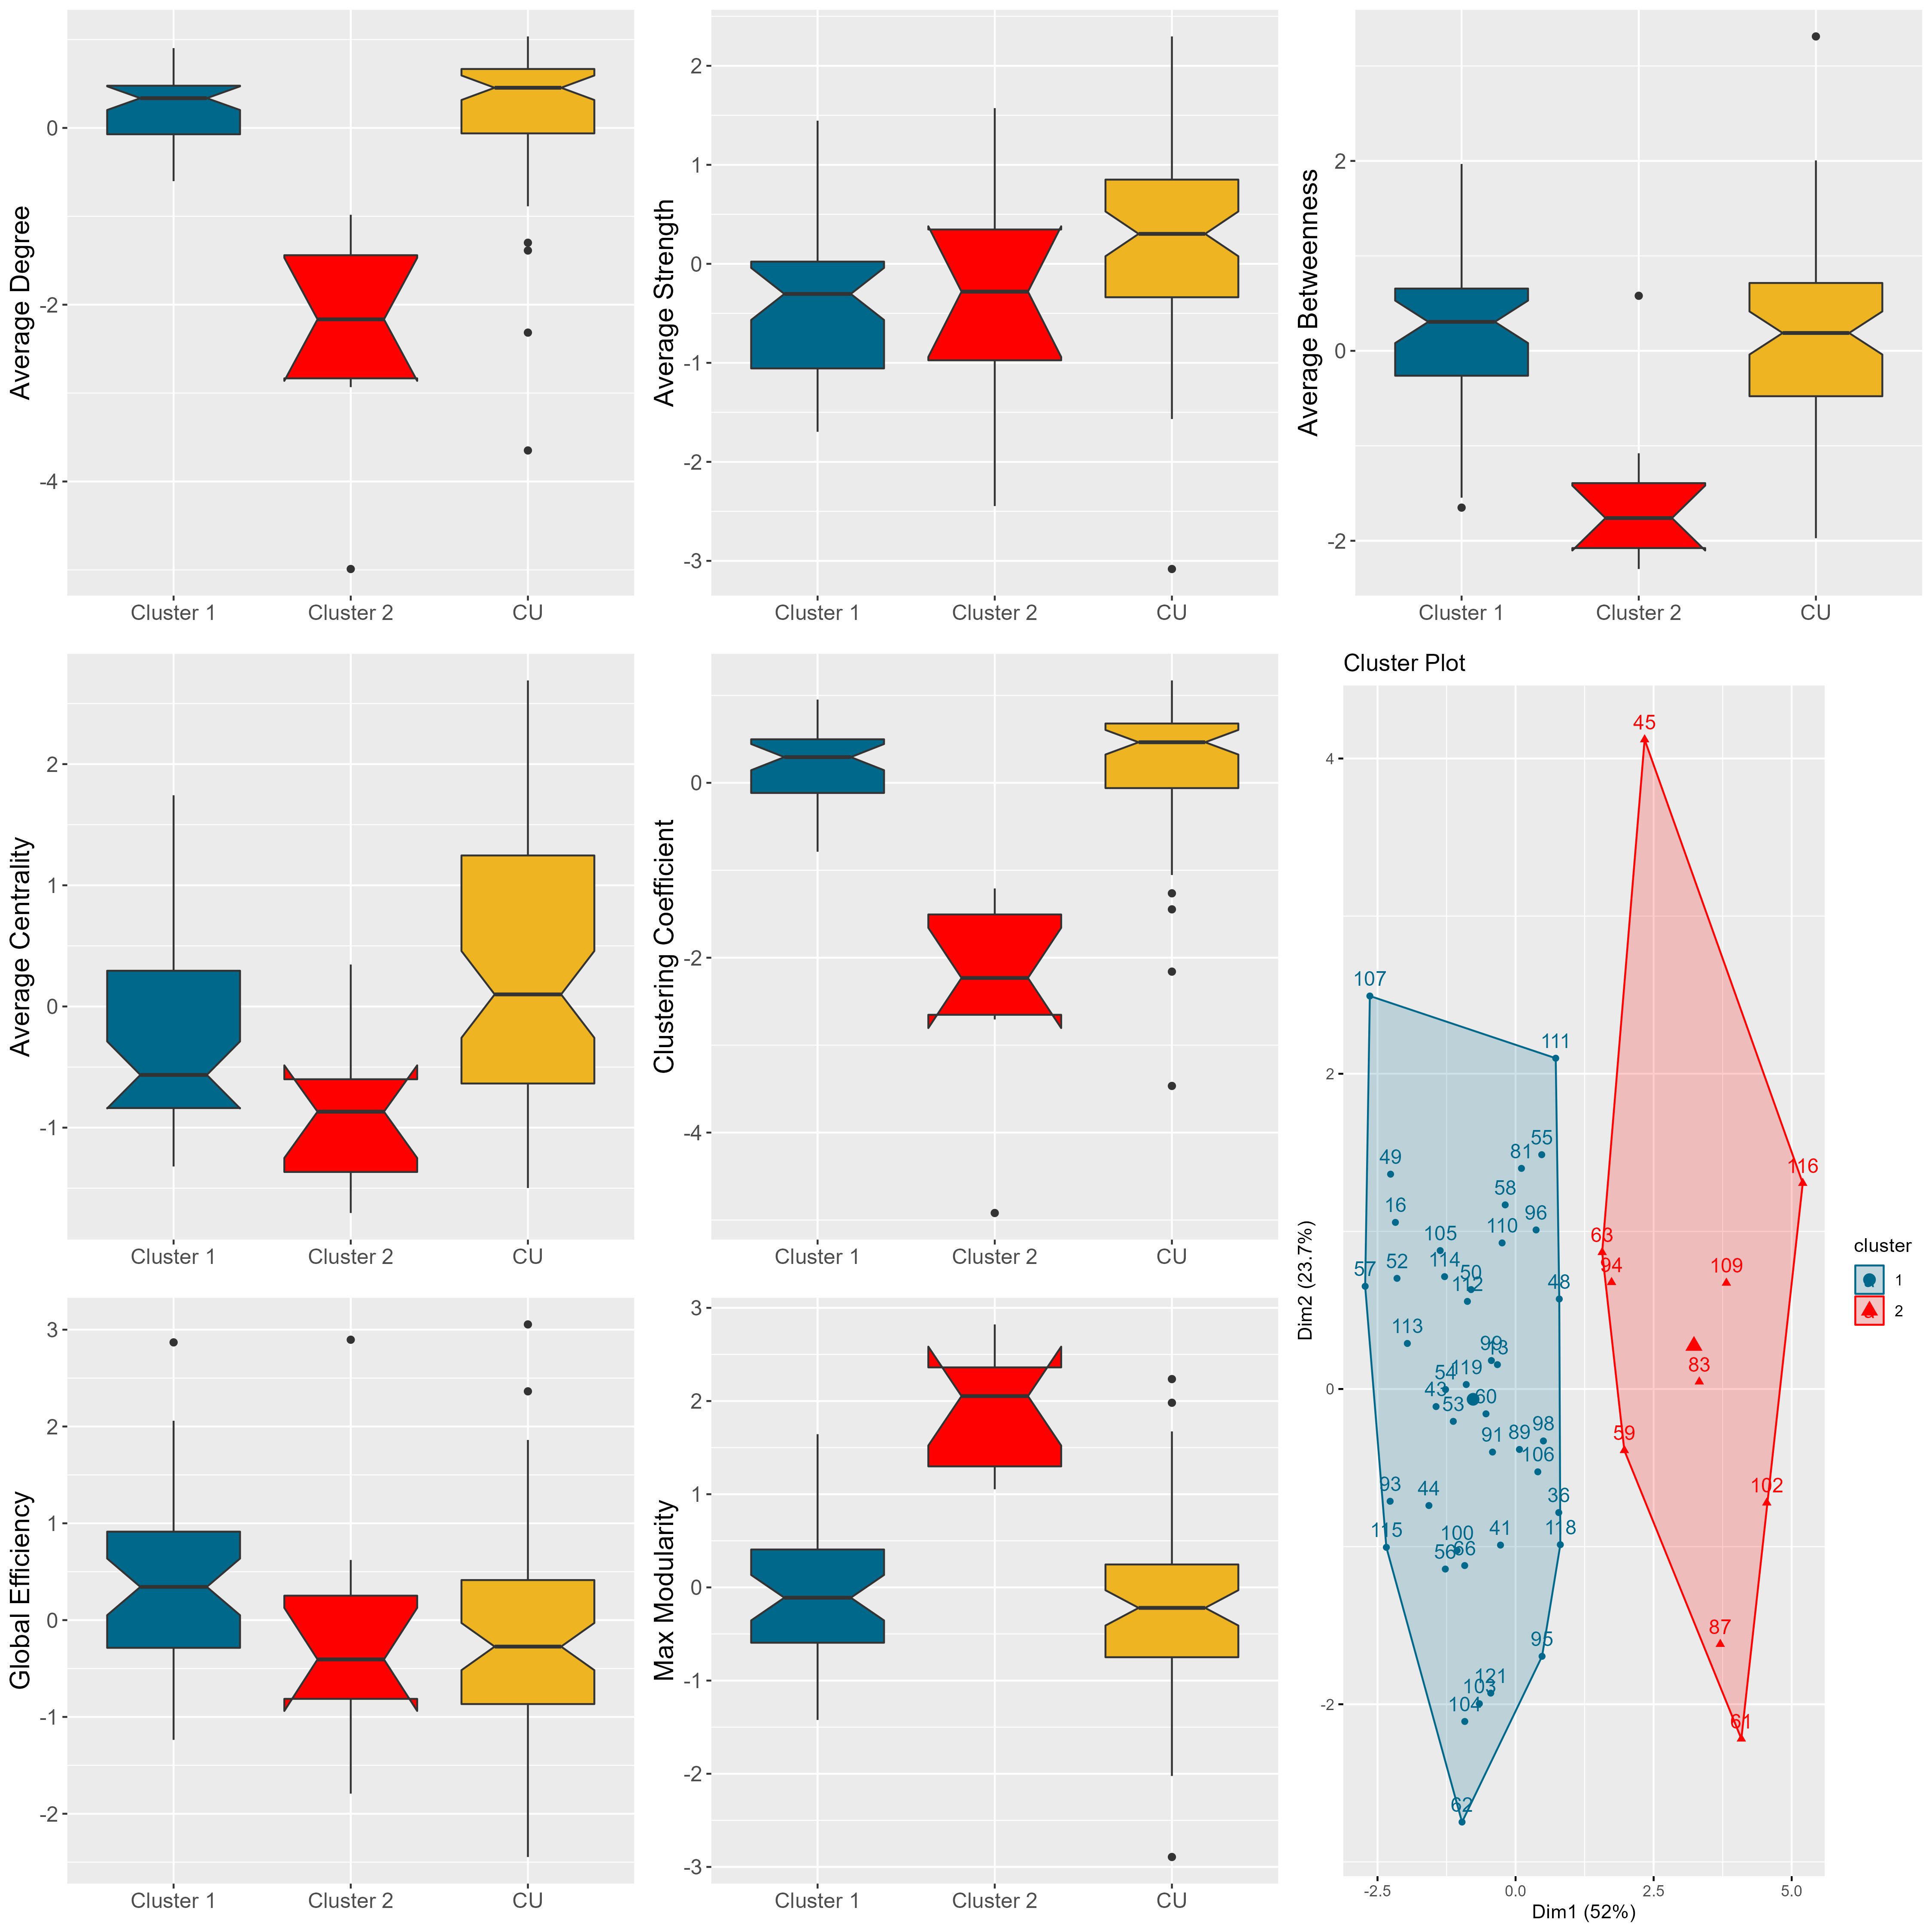
The SVM analysis was able to classify CI vs. CU with a mean accuracy of 0.67, an Area Under the Curve (AUC) of 0.73, and a mean Brier Score of 0.22 using 10-fold cross-validation (Fig. 2). In addition, k-means clustering was able to find 2 clusters in the CI group (Fig. 3). CI Cluster 1 (n=42) exhibited greater similarity to controls compared to CI Cluster 2 (n=10) in all GT metrics measured except for global efficiency. A chi-square test of the two CI clusters showed no significant difference in their distribution of AD versus MCI.Conclusions
GT measures were sensitive in differentiating cognitive impairment group from healthy control group. Further analysis showed that the cognitively impaired group was divided into two clusters with one cluster showing higher concordance to the healthy controls in their GT metrics. However, there was no apparent difference in the distribution of cognitive impairment severity as assessed by the consensus diagnosis. Future research would focus on assessing the utility of GT measures to differentiate clinical variations within the CI group while accounting for any demographic differences.Acknowledgements
Research reported in this publication was supported by the National Institute of Neurological Disorders and Stroke and the National Institutes of Health (National Institute of Aging and National Center for Advancing Translational Sciences) under award numbers R01NS117568, R01NS123378, R01NS105646, R01NS111022, P50HD105353, UL1TR002373, UF1AG051216, the AES Pre-doctoral Fellowship, the Medical Scientist Training Program Grant: T32 GM140935, UW-Madison MSTP Radiology Fellowship, and UWSMPH Shapiro Summer Research Program.References
1. Smith R, Raffelt D, Tournier J-D, Connelly A. Quantitative streamlines tractography: methods and inter-subject normalisation. 2020.
2. Ades-Aron B, Veraart J, Kellner E, Lui YW, Novikov DS, Fieremans E, editors. Diffusion parameter EStImation with Gibbs and NoisE Removal (DESIGNER). ISMRM 24th Annual Meeting & Exhibition; 2016.
3. Jenkinson M, Beckmann CF, Behrens TEJ, Woolrich MW, Smith SM. FSL. NeuroImage. 2012;62(2):782-90.
4. Avants BB, Tustison NJ, Song G, Cook PA, Klein A, Gee JC. A reproducible evaluation of ANTs similarity metric performance in brain image registration. NeuroImage. 2011;54(3):2033-44.
5. Tournier JD, Smith R, Raffelt D, Tabbara R, Dhollander T, Pietsch M, et al. MRtrix3: A fast, flexible and open software framework for medical image processing and visualisation. NeuroImage. 2019;202:116137.
6. Csardi G, Csardi MG. The igraph package. Citeseer; 2007.
7. Rousseeuw PJ. Silhouettes: a graphical aid to the interpretation and validation of cluster analysis. Journal of computational and applied mathematics. 1987;20:53-65.
Figures