3055
Investigating Alzheimer’s disease in women: is pregnancy a risk factor?1Institute of Biomedical Engineering, Department of Engineering Science, University of Oxford, Oxford, United Kingdom
Synopsis
Keywords: Alzheimer's Disease, Alzheimer's Disease
The influence of biological sex on clinical outcomes has been often neglected. Nevertheless, it is known that women have higher risk of dementia. Pregnancy might play an important role in this discrepancy, and studies have shown that this event is related to an increased risk of cerebrovascular impairment later in life. In this work we investigated the relation between the pregnancy related metrics and cognitive status and cerebral blood flow. Our results confirm that the number of pregnancies might be an important factor to consider when studying AD. Baseline CBF is not related to cognitive status or number of pregnancies.Introduction
The influence of biological sex on clinical outcomes has been often neglected, creating a troubling gap in research. For instance, it is known that women with dementia outnumber men two to one [1], and this observation cannot be explained by the increased risk with life expectancy alone [2]. Interestingly, one life event that might contribute to sex discrepancies might be pregnancy, as this leads to a variety of vascular, metabolic, and physiological adaptations during a considerable time period [3]. Additionally, complications during pregnancy such as gestational hypertension or preeclampsia have been shown to also increase the risk of cerebrovascular impairment [4,5], including Alzheimer’s disease (AD), and the number of pregnancies seems to also be a risk factor for AD [6]. Nevertheless, to the best of our knowledge, pregnancy-related metrics and their relation to cognitive status and cerebral blood flow (CBF) have never been investigated. In this work, we will take advantage of the large dataset OASIS-3 [7] and will investigate the impact of the number of pregnancies on cognitive status and cerebral blood flow.Methods
Out of the 1379 subjects of the OASIS-3 dataset, 113 subjects were selected based on: (1) being a female, (2) the existence of ASL and structural imaging, (3) the existence of a calibration image for absolute CBF quantification, (4) confirmed cognitive status (cognitively normal, NC, and diagnosed Alzheimer’s disease, AD) and (5) the existence of pregnancy information. MR scanning included a single time-point PASL sequence (TI=1900ms, TR/TE=4000/13ms) and a high-resolution structural image (MPRAGE), used for registration and tissue segmentation purposes. All data were analyzed using FSL, MATLAB (R2019b) and RStudio. ASL data pre-processing steps included extraction of first volume (calibration image) and motion correction. A standard kinetic model was fitted to the data using BASIL (T1a=1.65s, T1t=1.3s), and the resulting CBF maps were calibrated using a voxelwise long TR approach [8] (labelling efficiency = 0.9). Regional CBF values (average, standard deviation, spatial coefficient of variation (sCoV, [9])) were computed for the following regions: gray matter (GM, segmented using FAST), frontal, parietal, temporal and occipital (based on MNI atlas). The relation between cognitive status, number of pregnancies, regional CBF, demographic (age, race and APOE genotyping), and physiological factors (body mass index, mean arterial pressure) was investigated using Pearson correlation analysis, multiple linear regression and corresponding analysis of variance (ANOVA).Results and Discussion
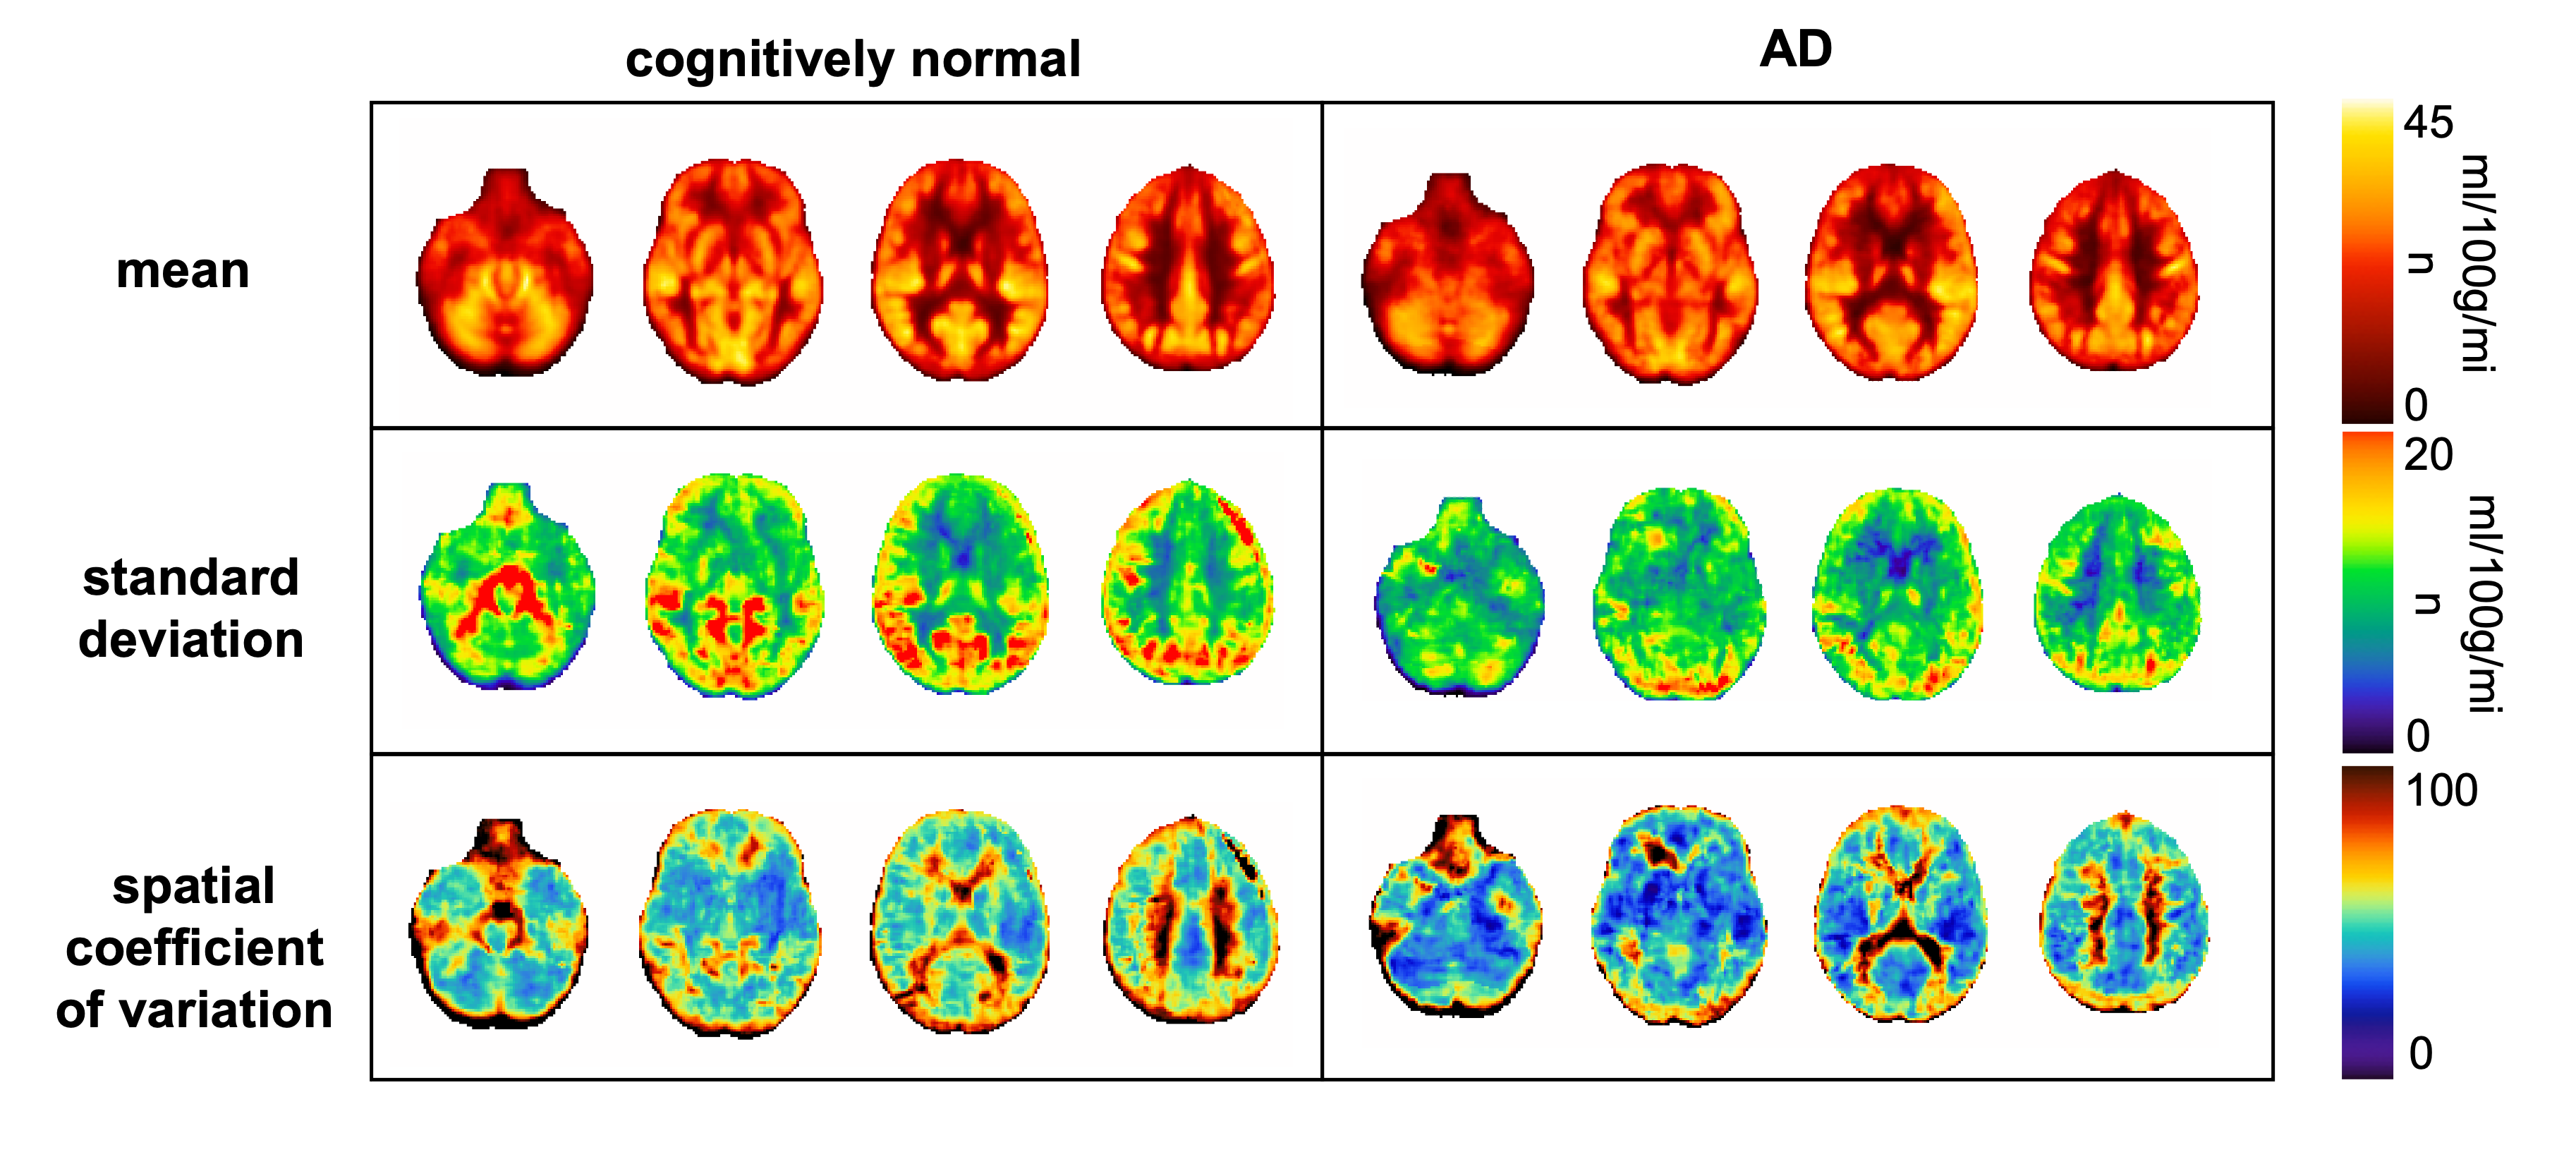
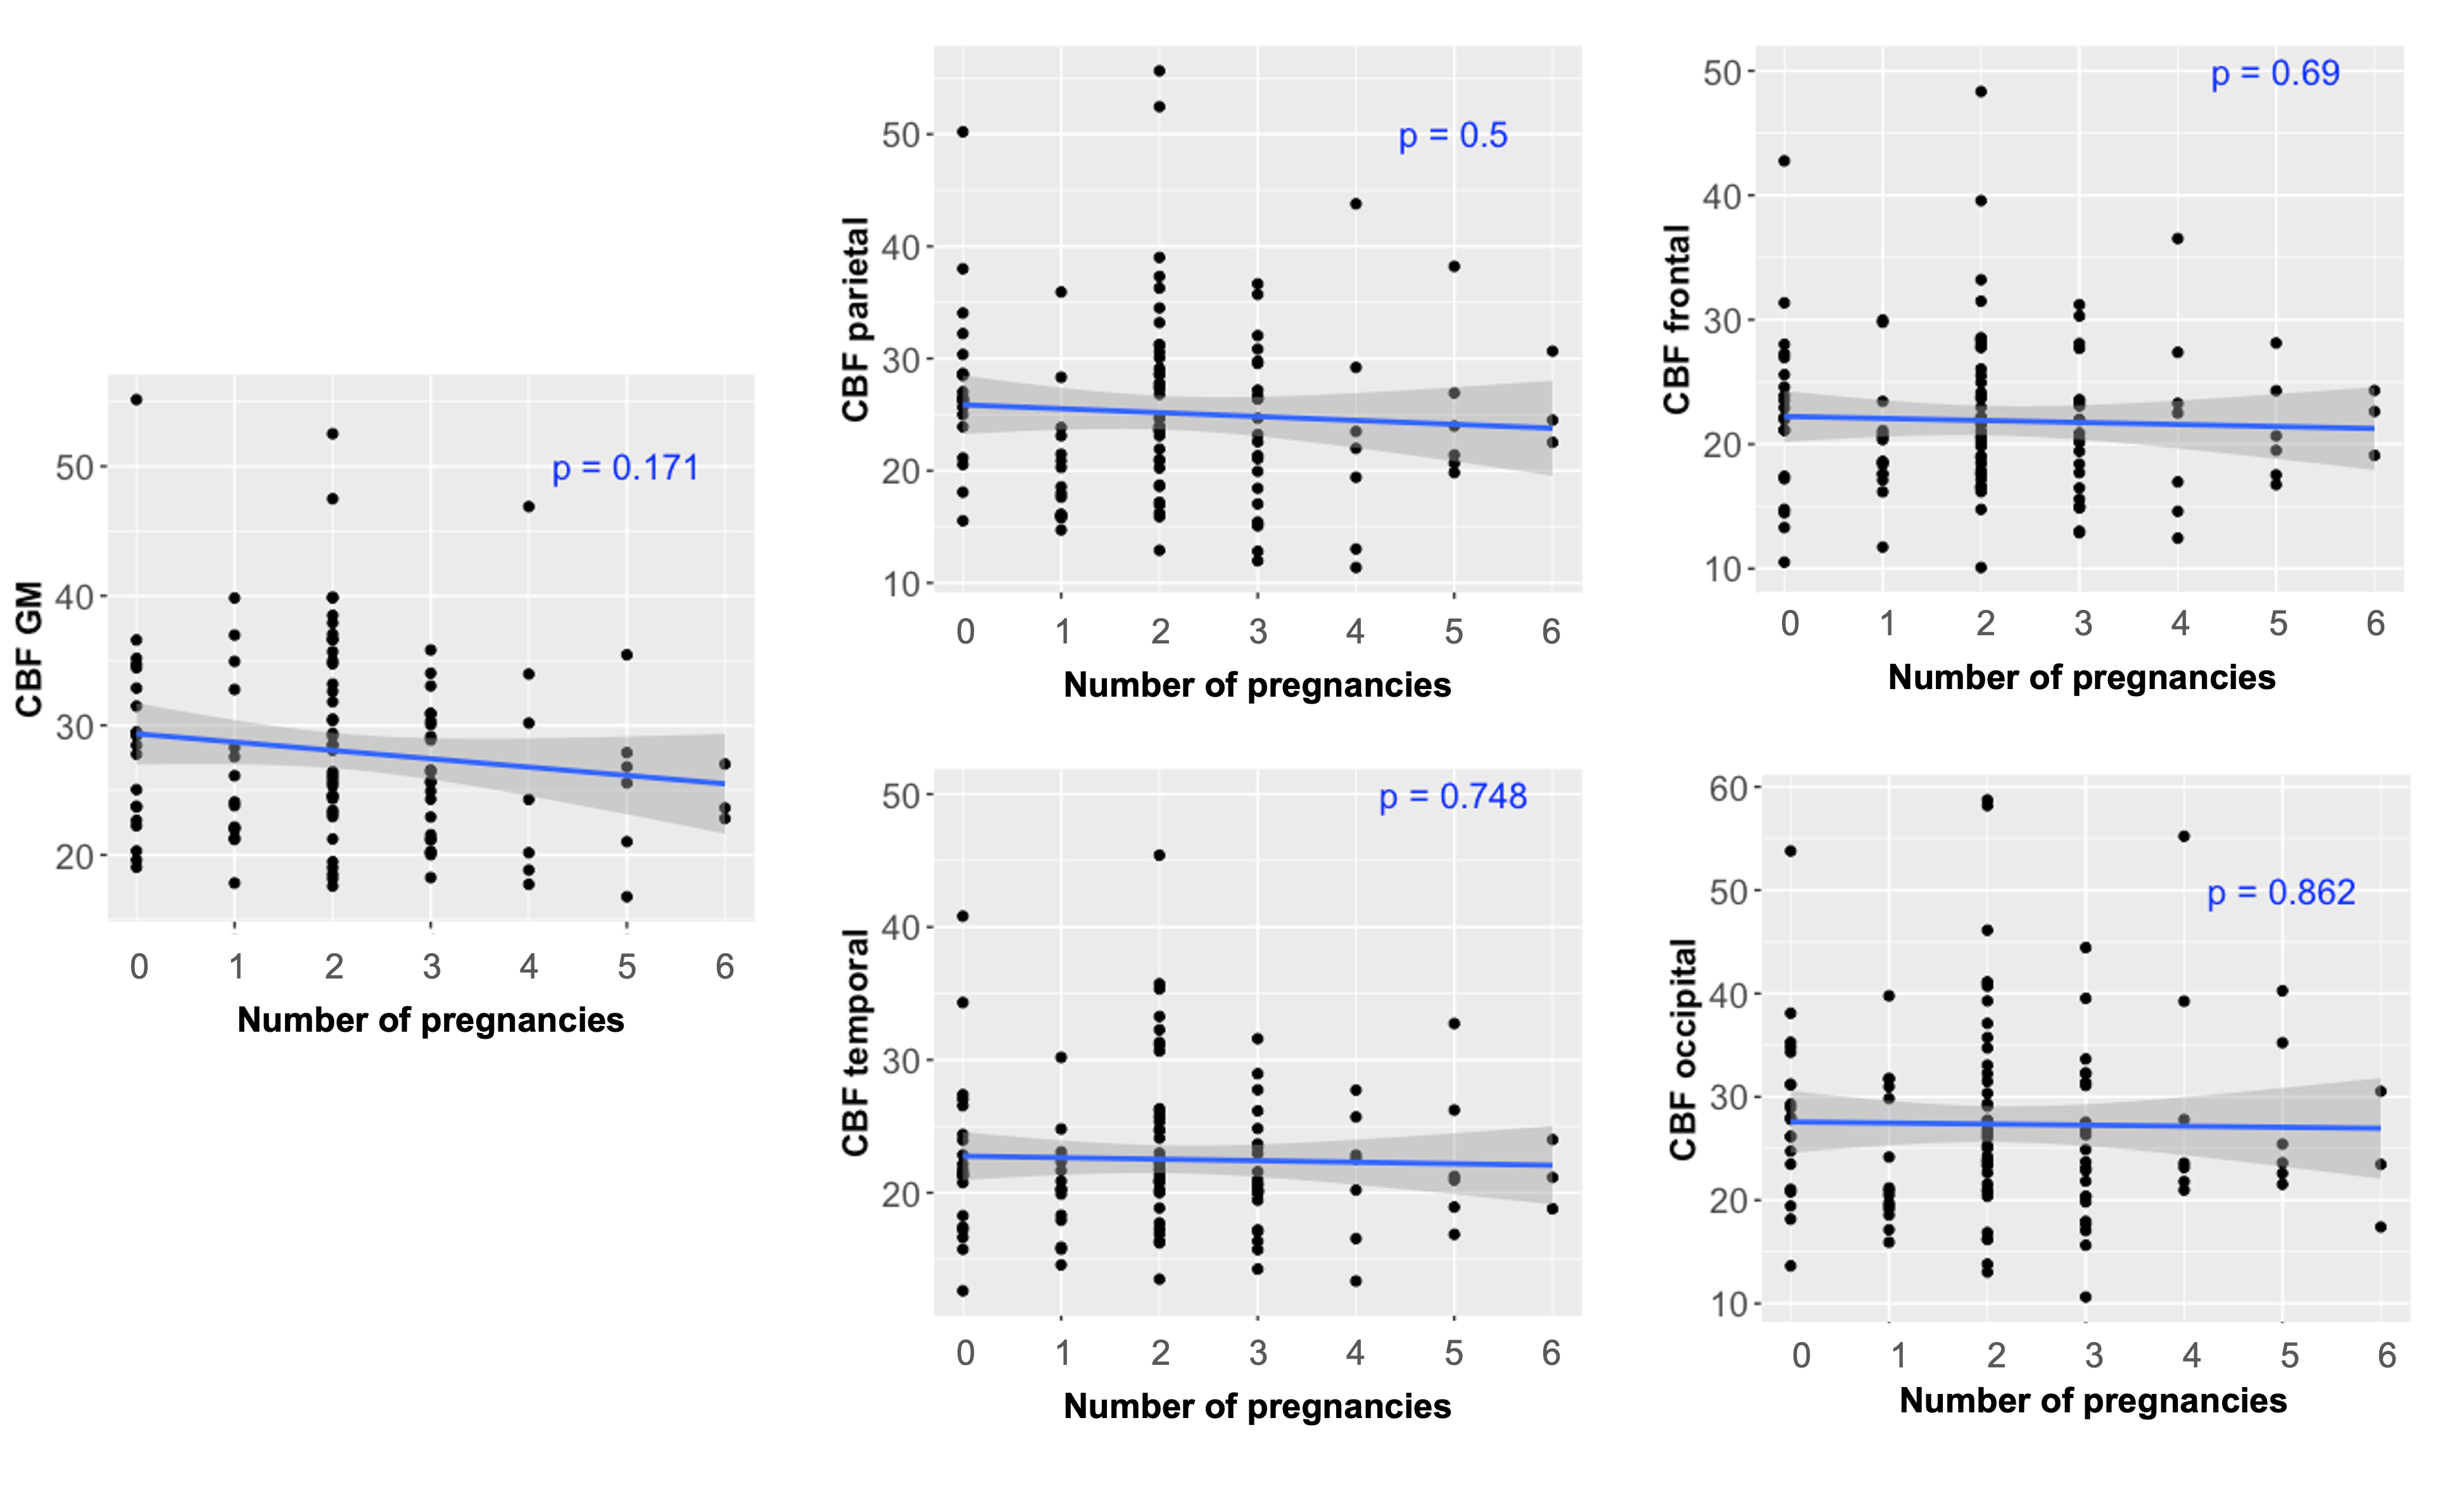
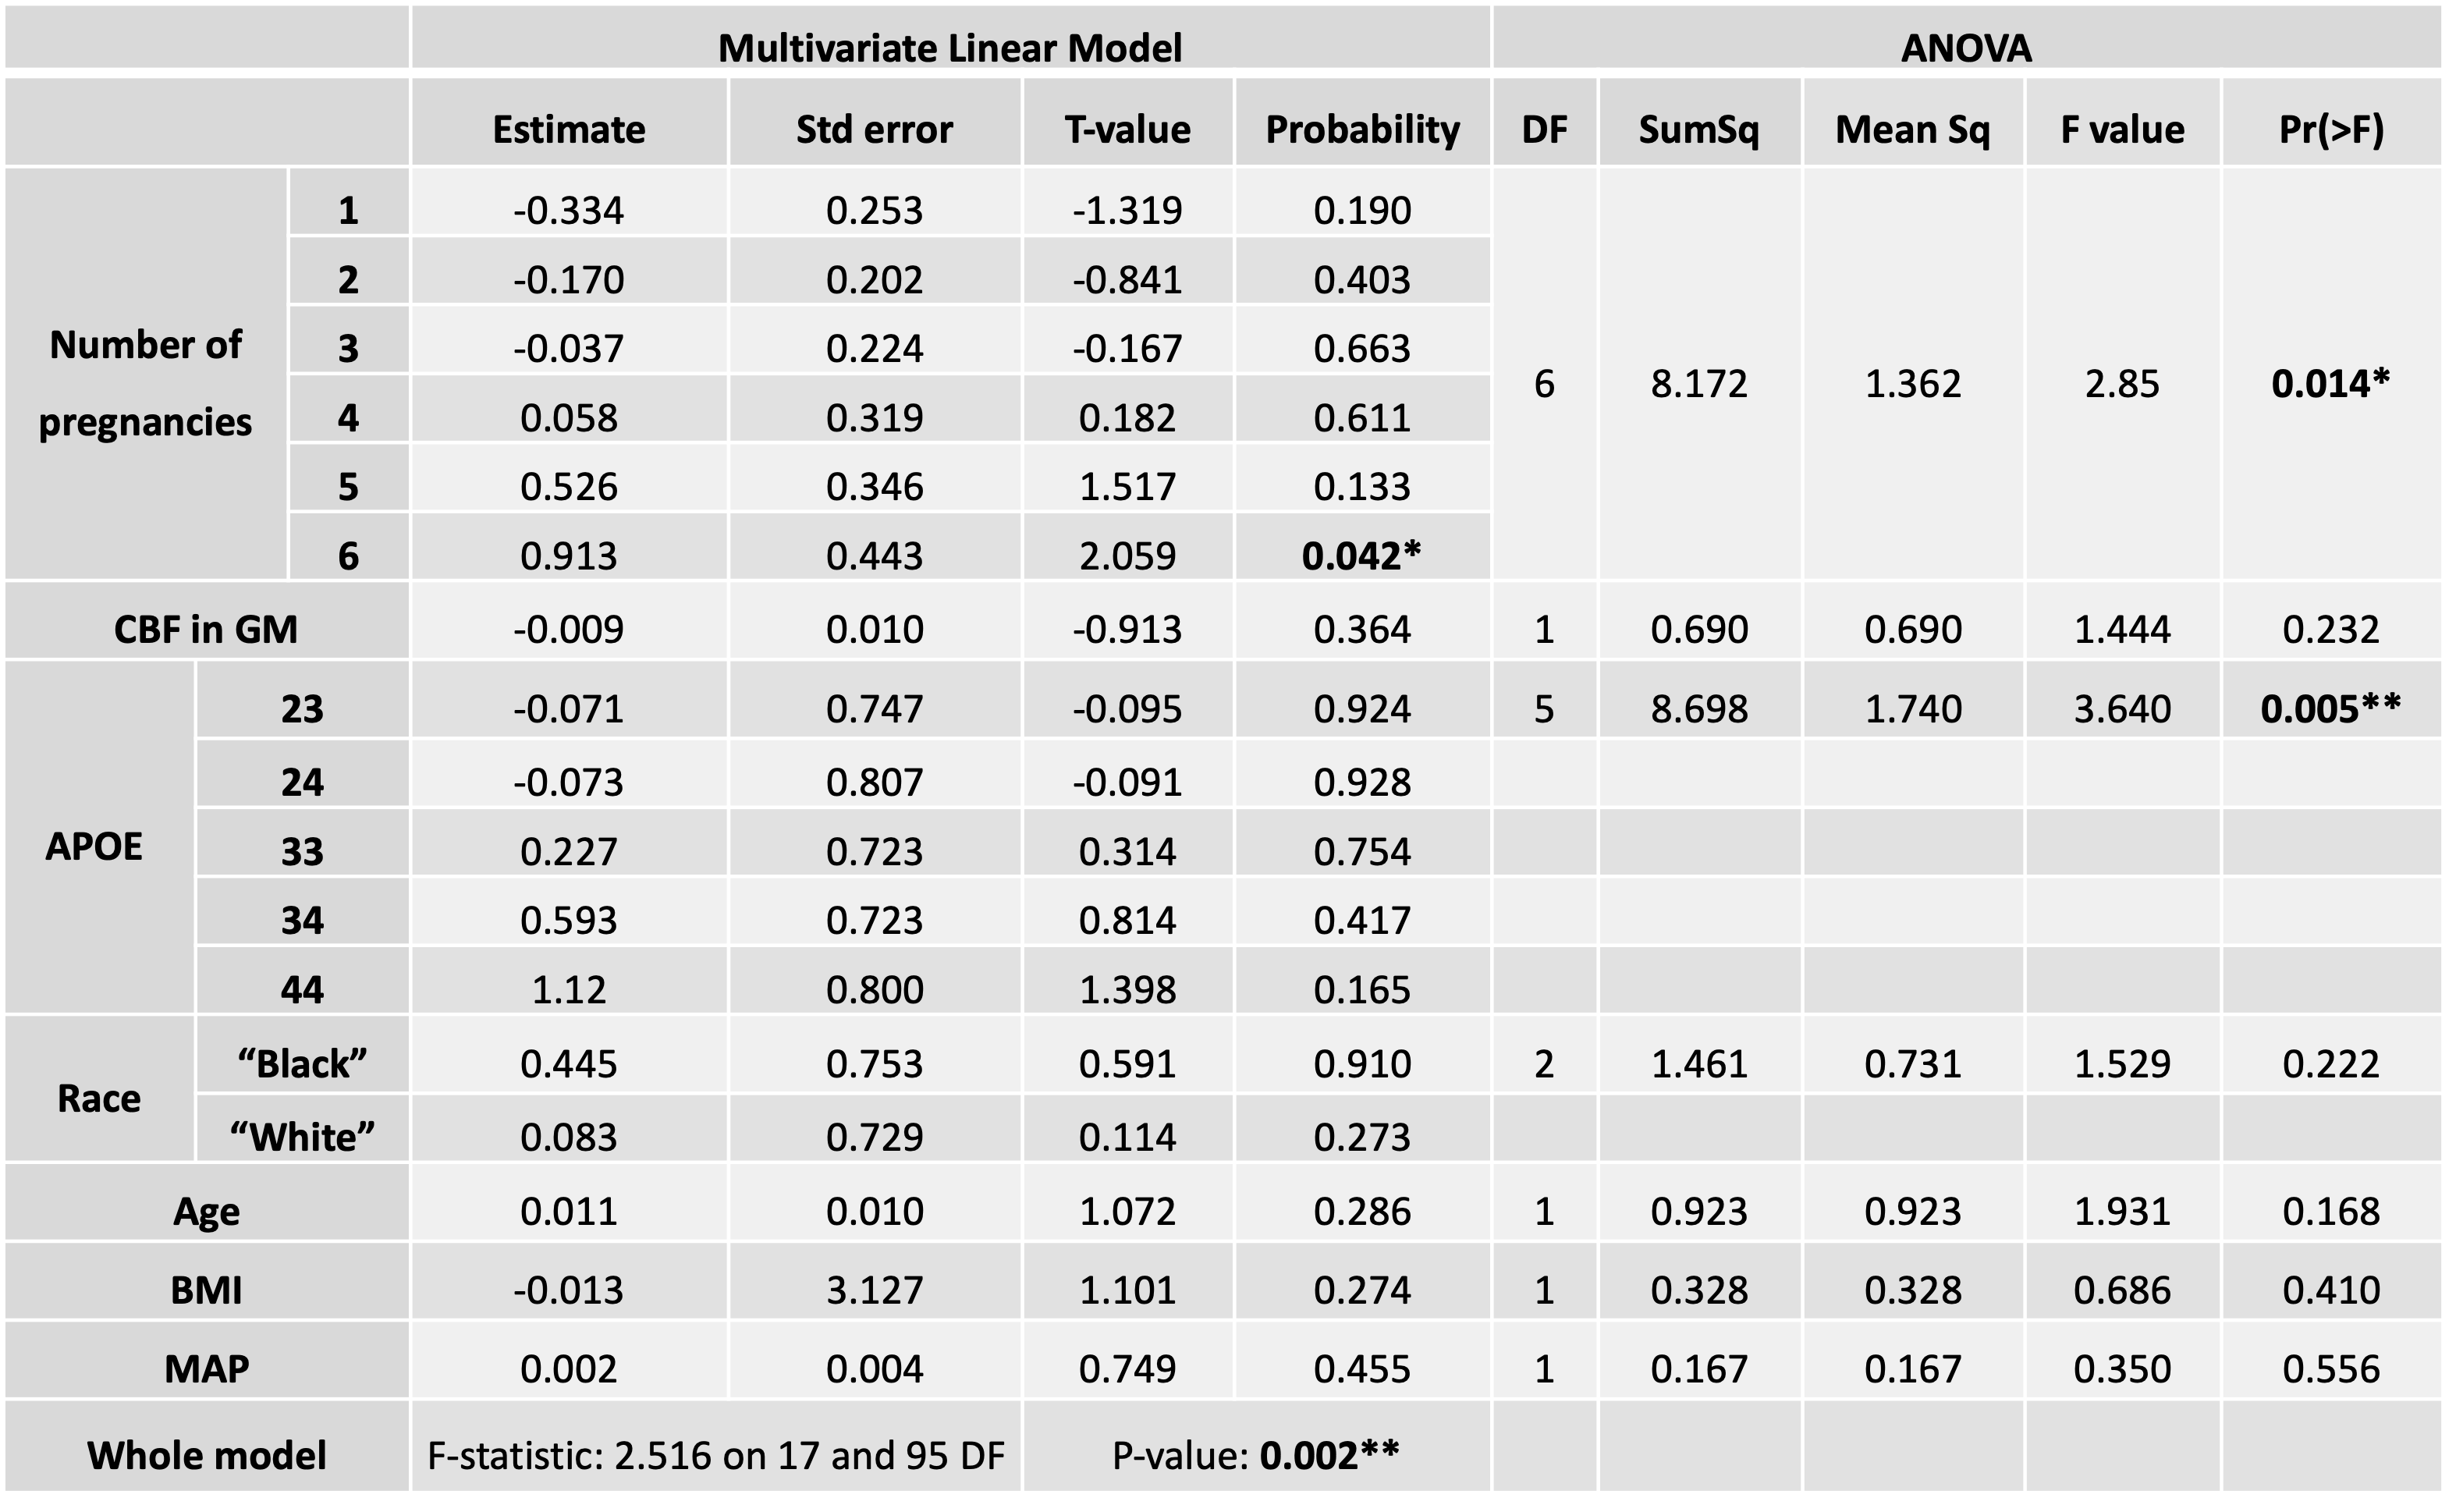
Table 1 shows the demographics for the two different groups of subjects (only females). Figure 1 depicts average and standard deviation maps of the two groups across female subjects, as well as the corresponding sCoV maps. Differences between groups can be observed mainly in arterial regions (outside GM), highlighting possible differences in CBF dynamics on those areas and suggesting that multiple-timepoint ASL strategies might be beneficial when investigating whole brain CBF in these groups of subjects. Figure 2 shows the Pearson correlation analysis between regional CBF and the number of pregnancies (corresponding p-values all non-significant). Table 3 shows the results of the multivariate linear regression (given the results of Figure 2, only CBF GM was used in the regression analysis. Nevertheless, other regions show similar trends). Both APOE genotyping and the number of pregnancies seem to have a significant relation with the cognitive status (ANOVA main effect, p=0.005 and p=0.014, respectively). In particular, higher number of pregnancies (N=6) shows a trend towards being a significant predictor of cognitive status (p=0.042). CBF in GM is also not related with the cognitive status, which is line with previous reports [10].Conclusion
To our knowledge, this is the first study to investigate pregnancy-related metrics and their relation to cognitive status and cerebral blood flow. No relation was observed between baseline CBF and the number of pregnancies. Future work includes investigating other MR functional metrics such as cerebrovascular reactivity and/or applying multiple timepoint ASL strategies to quantify other CBF-related metrics. Our results confirm that pregnancy related metrics, and in particular the number of pregnancies, might be an important factor to consider when studying AD. Future AD studies should include more information on pregnancy including number of pregnancies and if any complications occur (e.g., gestational hypertension, preeclampsia).Acknowledgements
This work was funded by EPSRC grant EP/S021507/1. Data were provided by OASIS-3: Longitudinal Multimodal Neuroimaging. Principal Investigators: T. Benzinger, D. Marcus, J. Morris; NIH P30 AG066444, P50 AG00561, P30 NS09857781, P01 AG026276, P01 AG003991, R01 AG043434, UL1 TR000448, R01 EB009352.References
[1] Mielke MM., Psychiatr Times, 2018, 35. https://www.ncbi.nlm.nih.gov/pmc/articles/PMC6390276/
[2] Niu H, et al., Neurologia. 2017, 32. DOI: 10.1016/j.nrl.2016.02.016
[3] de Lange AMG, et al. Hum Brain Mapp. 2020, 41. DOI: 10.1002/hbm.25180
[4] Basit S, et al. BMJ. 2018, 363. DOI: 10.1136/bmj.k4109
[5] Boeldt DS, et al. J Endocrinol. 2017, 232. DOI: 10.1530/JOE-16-0340
[6] Jang H, et al. Neurology 2018, 91. DOI: 10.1212/WNL.0000000000006000
[7] Colucci M, et al. Eur J Neurol. 2006,13. DOI: 10.1111/j.1468-1331.2006.01520.x
[8] OASIS-3: Longitudinal Multimodal Neuroimaging: https://doi.org/10.1101/2019.12.13.19014902
[9] Pinto J, et al. Magn Reson Med. 2020, 83. DOI: 10.1002/mrm.28000
[10] Mutsaerts HJMM, et al. PLoS One. 2020, 15. DOI: 10.1371/journal.pone.0229444
[11] Suri, S., et al. Alzheimer's & Dementia, 11. DOI: 10.1016/j.jalz.2014.05.1755
Figures