3054
Disrupted subsystem interactions of default mode network in mild cognitive impairment: A Resting-State Functional Connectivity MRI Study
Sirong Piao1, Keliang Chen1, Na Wang1, Yong Zhang2, and Yuxin Li1
1Huashan Hospital, Fudan University, Shanghai, China, 2GE Healthcare, Shanghai, China
1Huashan Hospital, Fudan University, Shanghai, China, 2GE Healthcare, Shanghai, China
Synopsis
Keywords: Alzheimer's Disease, fMRI (resting state)
The default mode network (DMN) could be further divided into three subsystems, and each subsystem of DMN serves different cognitive functions. In this study, we revealed that cognitive decline is driven by weakened functional connectivity within the core subsystems, but enhanced functional connectivity between the core and MTL subsystems as well as the core and DMPFC subsystems. This dissociation may reflect abnormal core-centered connection abnormalities, along with the disruption of the MTL subsystem and the DMPFC subsystem to some degree. Our findings provided a promising imaging biomarker for the early diagnosis of AD.Background
Previous studies have revealed the functional network alterations of the default mode network(DMN), suggesting that the DMN could be the critical brain network underlying cognitive impairment severity or progression. DMN could be further divided into three subsystems: the core subsystem, the dorsal medial prefrontal cortex (DMPFC) subsystem, and the medial temporal lobe (MTL) subsystem. Each subsystem of DMN serves different cognitive functions. In the present study, we sought to investigate the difference of functional connectivity (FCs) within DMN on subsystem-level between MCI and HC, and developed several disease classification models with clinical information and the FCs features.Material and methods
In this study, 117 MCI patients, 110 age and sex-matched elderly healthy controls were prospectively recruited. All participants were scanned on a 3 Tesla MR scanner (Discovery 750, GE Healthcare, US) using a standard eight-channel head coil. The high-resolution 3D T1-weighted images were acquired by a fast spoiled gradient-echo (FSPGR) sequence. The resting-fMRI images were obtained using a single shot gradient-recalled echo-planar imaging (EPI) sequence. The resting-state fMRI Data preprocessing was conducted in the toolbox for Data Processing & Analysis of Brain Imaging (DPABI, Yan et al., 2016, http://rfmri.org/DPABI).Twenty-four anatomical regions of interest (ROIs) of DMN were defined in the present study based on Yeo's 17-network parcellation. These 24 ROIs can be further divided into 3 DMN subsystems following previous publications. We calculated Tikhonov Partial Correlation as FC instead of conventional Pearson’s correlation in the present study. We extracted the average time series from each ROI and calculated Tikhonov Partial Correlation between each ROI-pair as FC, forming a 24 × 24 FC matrix. We then Z-transformed all FCs with a Fisher's r-to-z transformation. For the entire DMN, we simply averaged across all FCs in the matrix. For FCs at the subsystem level, we averaged FCs among ROIs of the same subsystem as FCs within a subsystem and all FCs reflecting pair-wise connections between subsystems as FCs between subsystems. To give a comprehensive view of the alterations of FCs, we subsequently conducted an ROI-level analysis on FC. Similarly, FCs of all ROI pairs in the two groups were calculated the same way as in the DMN subsystems. After the subsystem level and ROI level analysis, FCs with significant between-group differences in MCI group and HC group were selected as the significant features. Then, combined with clinical characteristics, we used multivariate logistic regression to find the independent discriminative features and the receiver operating characteristic (ROC) analysis to assess the disease discriminative ability.
Results
Demographic data and cognitive performanceNo significant differences in age, gender, and education level were found between the MCI and HC-elder groups (p>0.05). MMSE and MoCA scores were significantly higher in the HC group when compared to MCI group (both p<0.0001).
FCs within and between subsystems of DMN
The overall FC strengths within the DMN were compared between the MCI and HCs, and no significant differences were found between the two groups (t= -0.7015, p=0.4837).FC within the core subsystem of MCI group was significantly decreased compared with the HC group (t=-5.5592, p<0.0001). FC between the core and MTL subsystems was significantly enhanced in MCIs as compared to the HCs(t=4.1741, p<0.0001). Besides, FC between core and DMPFC subsystem were significantly increased in the MCI group compared to the HCs (t=2.3376, p=0.0203).No significant differences were found in FC between the DMPFC and MTL subsystems or within the DMPFC or MTL subsystem. (Figure 1)
ROI levels
We found eighteen ROI connections were significantly different between the MCI and HC individuals, including seven decreased and eleven enhanced connections (MCI versus HC). ROI-wise results that were generally in correspondence with the network and subsystem level findings.
Disease discrimination and evaluation
Five models were constructed using the above independent discriminative features to discriminate MCI from HC. In Model I, FCs of within and between DMN subsystems features were set as independent discriminative features, which achieved the AUC of 0.7149. In Model II, features were identified as nine FCs of ROI connections with significant between-group differences. The performance AUC of model II was 0.8070. In Model III, independent discriminative features were set as the combination of significant features from the model I and model II, which was the joint model of significant FCs of subsystems and ROIs, and the AUC were enhanced to 0.8190. In Model IV, we regarded the demographic features and MMSE scores as independent discriminative features, which achieved the AUC of 0.8731. In Model V, features were set as the combination of significant features in model III and model IV, which reached the highest AUC of 0.9253.
Conclusion
In conclusion, this present study offers direct evidence on the pivotal role of the DMN in the neural mechanisms of AD. This dissociation may reflect abnormal core-centered connection abnormalities, along with the disruption of the MTL subsystem and the DMPFC subsystem to some degree. Our findings provided a primary assurance of its potential clinical utility for providing novel insight into the potential pathogenesis and offering a promising imaging biomarker for the early diagnosis of AD.Acknowledgements
Authors thank all the staff and participants in the study.References
Andrews-Hanna JR. 2012. The brain's default network and its adaptive role in internal mentation. Neuroscientist 18(3):251-70.
Andrews-Hanna JR, Reidler JS, Sepulcre J, Poulin R, Buckner RL. 2010. Functional-anatomic fractionation of the brain's default network. Neuron 65(4):550-62.
Andrews-Hanna JR, Smallwood J, Spreng RN. 2014. The default network and self-generated thought: component processes, dynamic control, and clinical relevance. Ann N Y Acad Sci 1316:29-52.
Berron D, van Westen D, Ossenkoppele R, Strandberg O, Hansson O. 2020. Medial temporal lobe connectivity and its associations with cognition in early Alzheimer’s disease. Brain 143(4):1233-1248.
Berron D, Vogel JW, Insel PS, Pereira JB, Xie L, Wisse L, Yushkevich PA, Palmqvist S, Mattsson-Carlgren N, Stomrud E and others. 2021. Early stages of tau pathology and its associations with functional connectivity, atrophy and memory. Brain.
Braun U, Plichta MM, Esslinger C, Sauer C, Haddad L, Grimm O, Mier D, Mohnke S, Heinz A, Erk S and others. 2012. Test-retest reliability of resting-state connectivity network characteristics using fMRI and graph theoretical measures. Neuroimage 59(2):1404-12.
Buckner RL, Andrews-Hanna JR, Schacter DL. 2008. The brain's default network: anatomy, function, and relevance to disease. Ann N Y Acad Sci 1124:1-38.
Buckner RL, DiNicola LM. 2019. The brain's default network: updated anatomy, physiology and evolving insights. Nature reviews. Neuroscience 20(10):593-608.
Chen X, Chen NX, Shen YQ, Li HX, Li L, Lu B, Zhu ZC, Fan Z, Yan CG. 2020. The subsystem mechanism of default mode network underlying rumination: A reproducible neuroimaging study. Neuroimage 221:117185.
Crespi C, Galandra C, Canessa N, Manera M, Poggi P, Basso G. 2020. Microstructural damage of white-matter tracts connecting large-scale networks is related to impaired executive profile in alcohol use disorder. Neuroimage Clin 25:102141.
Damoiseaux JS, Prater KE, Miller BL, Greicius MD. 2012. Functional connectivity tracks clinical deterioration in Alzheimer's disease. Neurobiol Aging 33(4):828.e19-30.
Greicius MD, Srivastava G, Reiss AL, Menon V. 2004. Default-mode network activity distinguishes Alzheimer's disease from healthy aging: evidence from functional MRI. Proc Natl Acad Sci U S A 101(13):4637-42.
Grieder M, Wang D, Dierks T, Wahlund LO, Jann K. 2018. Default Mode Network Complexity and Cognitive Decline in Mild Alzheimer's Disease. Front Neurosci 12:770.
Guo CC, Kurth F, Zhou J, Mayer EA, Eickhoff SB, Kramer JH, Seeley WW. 2012. One-year test-retest reliability of intrinsic connectivity network fMRI in older adults. Neuroimage 61(4):1471-83.
Gusnard DA, Raichle ME, Raichle ME. 2001. Searching for a baseline: functional imaging and the resting human brain. Nat Rev Neurosci 2(10):685-94.
Hall B, Mak E, Cervenka S, Aigbirhio FI, Rowe JB, O Brien JT. 2017. In vivo tau PET imaging in dementia: Pathophysiology, radiotracer quantification, and a systematic review of clinical findings. Ageing Research Reviews 36:50-63.
Harrison TM, Maass A, Adams JN, Du R, Baker SL, Jagust WJ. 2019. Tau deposition is associated with functional isolation of the hippocampus in aging. Nat Commun 10(1):4900.
Huo T, Li Y, Zhuang K, Song L, Wang X, Ren Z, Liu Q, Yang W, Qiu J. 2020. Industriousness Moderates the Link Between Default Mode Network Subsystem and Creativity. Neuroscience 427:92-104.
Jack CRJ, Bennett DA, Blennow K, Carrillo MC, Feldman HH, Frisoni GB, Hampel H, Jagust WJ, Johnson KA, Knopman DS and others. 2016. A/T/N: An unbiased descriptive classification scheme for Alzheimer disease biomarkers. Neurology 87(5):539-547.
Jessen F, Wiese B, Bachmann C, Eifflaender-Gorfer S, Haller F, Kolsch H, Luck T, Mosch E, van den Bussche H, Wagner M and others. 2010. Prediction of dementia by subjective memory impairment: effects of severity and temporal association with cognitive impairment. Arch Gen Psychiatry 67(4):414-22.
Jessen F, Wolfsgruber S, Wiese B, Bickel H, Mosch E, Kaduszkiewicz H, Pentzek M, Riedel-Heller SG, Luck T, Fuchs A and others. 2014. AD dementia risk in late MCI, in early MCI, and in subjective memory impairment. Alzheimers Dement 10(1):76-83.
Jones DT, Graff-Radford J, Lowe VJ, Wiste HJ, Gunter JL, Senjem ML, Botha H, Kantarci K, Boeve BF, Knopman DS and others. 2017. Tau, amyloid, and cascading network failure across the Alzheimer's disease spectrum. Cortex 97:143-159.
Jones DT, Knopman DS, Gunter JL, Graff-Radford J, Vemuri P, Boeve BF, Petersen RC, Weiner MW, Jack CJ. 2016. Cascading network failure across the Alzheimer's disease spectrum. Brain 139(Pt 2):547-62.
Pervaiz U, Vidaurre D, Woolrich MW, Smith SM. 2020. Optimising network modelling methods for fMRI. Neuroimage 211:116604.
Poerio GL, Sormaz M, Wang HT, Margulies D, Jefferies E, Smallwood J. 2017. The role of the default mode network in component processes underlying the wandering mind. Soc Cogn Affect Neurosci 12(7):1047-1062.
Power JD, Barnes KA, Snyder AZ, Schlaggar BL, Petersen SE. 2012. Spurious but systematic correlations in functional connectivity MRI networks arise from subject motion. Neuroimage 59(3):2142-54.
Qi H, Hu Y, Lv Y, Wang P. 2020. Primarily Disrupted Default Subsystems Cause Impairments in Inter-system Interactions and a Higher Regulatory Burden in Alzheimer's Disease. Front Aging Neurosci 12:593648.
Qi H, Liu H, Hu H, He H, Zhao X. 2018. Primary Disruption of the Memory-Related Subsystems of the Default Mode Network in Alzheimer's Disease: Resting-State Functional Connectivity MRI Study. Front Aging Neurosci 10:344.
Raichle ME, MacLeod AM, Snyder AZ, Powers WJ, Gusnard DA, Shulman GL. 2001. A default mode of brain function. Proc Natl Acad Sci U S A 98(2):676-82.
Reas ET. 2017. Amyloid and Tau Pathology in Normal Cognitive Aging. The Journal of Neuroscience 37(32):7561-7563.
Ries ML, Schmitz TW, Kawahara TN, Torgerson BM, Trivedi MA, Johnson SC. 2006. Task-dependent posterior cingulate activation in mild cognitive impairment. Neuroimage 29(2):485-92.
Schurz M, Maliske L, Kanske P. 2020. Cross-network interactions in social cognition: A review of findings on task related brain activation and connectivity. Cortex 130:142-157.
Tambini A, Ketz N, Davachi L. 2010. Enhanced brain correlations during rest are related to memory for recent experiences. Neuron 65(2):280-90.
Wang Z, Yan C, Zhao C, Qi Z, Zhou W, Lu J, He Y, Li K. 2011. Spatial patterns of intrinsic brain activity in mild cognitive impairment and Alzheimer's disease: a resting-state functional MRI study. Hum Brain Mapp 32(10):1720-40.
Wig GS, Grafton ST, Demos KE, Wolford GL, Petersen SE, Kelley WM. 2008. Medial temporal lobe BOLD activity at rest predicts individual differences in memory ability in healthy young adults. Proc Natl Acad Sci U S A 105(47):18555-60.
Yao W, Chen H, Sheng X, Zhao H, Xu Y, Bai F. 2021. Core-Centered Connection Abnormalities Associated with Pathological Features Mediate the Progress of Cognitive Impairments in Alzheimer's Disease Spectrum Patients. J Alzheimers Dis 82(4):1499-1511.
Yeo BT, Krienen FM, Sepulcre J, Sabuncu MR, Lashkari D, Hollinshead M, Roffman JL, Smoller JW, Zollei L, Polimeni JR and others. 2011. The organization of the human cerebral cortex estimated by intrinsic functional connectivity. J Neurophysiol 106(3):1125-65.
Figures
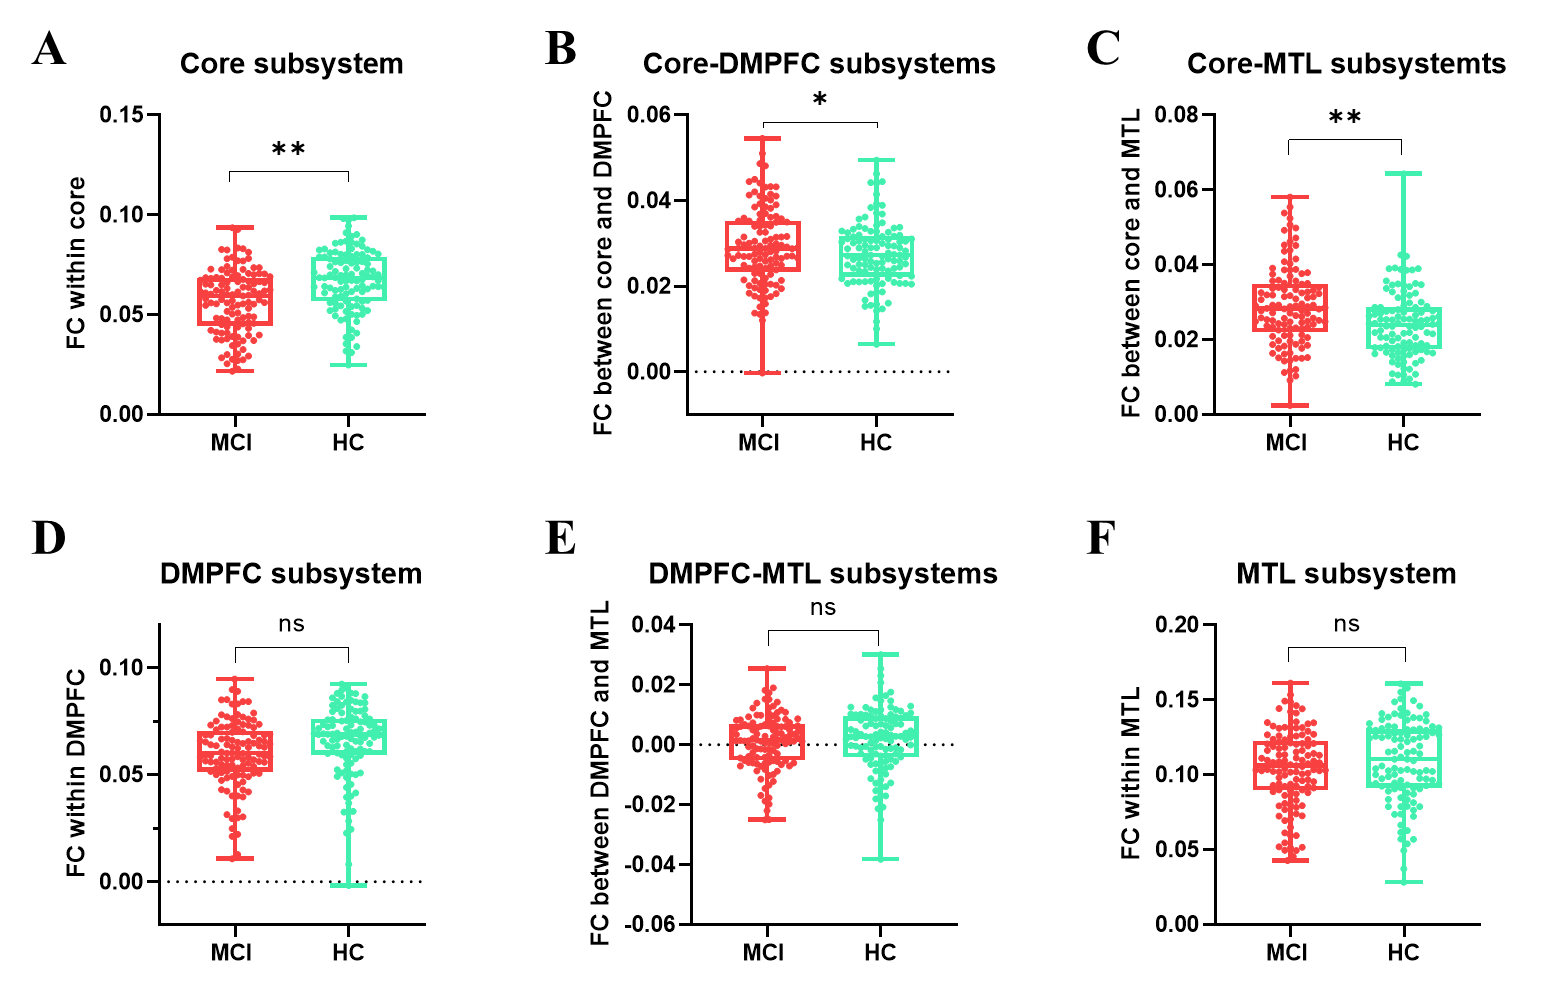
Figure 1. Between group differences of FCs among DMN and subsystems.(A) Overall FC differences within DMN between groups. (B) FC within the core subsystem.(C) FC within DMPFC subsystem.(D) FC within MTL.(E) Increased FC between the core and DMPFC subsystem was found in MCI group when compared to HC-elder group.(F) Enhanced FCs between the core and MTL subsystems were found in MCI group compared with HC-elder group. (G) No significant differences of FCs between DMPFC and MTL subsystems were found between groups. *: p <0.05; **: p < 0.01.
DOI: https://doi.org/10.58530/2023/3054