3049
Cortical thickness related to future score on the Dementia Questionnaire for People with Learning Disabilities in adults with Down syndrome1The Cleveland Clinic, Cleveland, OH, United States, 2University Hospitals, Cleveland, OH, United States
Synopsis
Keywords: Alzheimer's Disease, Genetics, Down Syndrome
Down syndrome (DS) is a genetic condition that is associated with early onset Alzheimer’s disease (AD). Individuals with DS show changes in neuroanatomy, including regional increases in cortical thickness. Here, we assess cortical thickness in ten non-demented adults with DS. We focus on regions that show cortical thinning in AD and relate cortical thickness to scores on a measure of dementia. We find that regional thickness measures are related to the 4.6 year change in a measure of dementia, suggesting that the magnitude of early DS-related neuroanatomical differences may relate to aspects of dementia onset.Introduction
Down syndrome (DS) is a genetic condition that is associated with intellectual disability, stereotypic physical characteristics, and specific medical conditions, including early onset Alzheimer’s disease (AD). Individuals with DS show reliable changes in neuroanatomy, including reduced brain size. Despite an overall size reduction, regional increases in cortical thickness have been reported from infancy to adulthood (1-3), and we previously reported increased mean cortical thickness in a sample of young adults with DS compared to age and sex matched controls (4). As individuals with DS progress to AD (DSAD), they show a pattern of cortical atrophy similar to that seen in AD in the general population (5), and increased atrophy is related to poorer memory performance in DSAD (6).Individuals with DS show relatively large variations in cognitive function, complicating the diagnosis of DSAD. Widely-used tests of cognitive function may not be applicable to those with intellectual disabilities, where poor performance may reflect baseline function rather than dementia-related decline. To account for baseline function, instruments such as the Dementia Questionnaire for People with Learning Disabilities (DLD; 7) highlight the change in score over time as a more accurate predictor of dementia onset. The DLD social score probes mood, behavioral disturbance, and interest in activities, all domains that may show early dementia-related changes in individuals with intellectual disabilities. The DLD cognitive score probes memory and orientation, which also show dementia-related decline. An increase in DLD score indicates more potential signs of dementia onset.
Here, we assess cortical thickness in a group of non-demented adults with DS. We focus on in regions that show cortical thinning in AD, and relate cortical thickness to scores on a measure of dementia, the DLD. Increased understanding of the pathophysiology of DS may provide a “road map” of changes related to typical aging and those that are the consequence of dementia.
Methods
Ten non-demented adults with DS (mean age 31.4, range 26-35, 7 males) were scanned in an IRB-approved protocol on a Siemens 7T Magnetom (Siemens Medical Solutions, Erlangen) using a 32-channel head coil (Nova Medical). Scans included a whole-brain anatomical MP2RAGE (voxel size = 0.75mm3). All participants were administered the DLD. Participants returned for a second research visit, which included a second administration of the DLD. Clinical consensus was used to determine if participants were showing symptoms associated with dementia onset. Mean time between visits was 4.7 ± 0.26 years.Using Freesurfer 6.0, the visit 1 MP2RAGE was segmented and cortical thickness was measured in regions roughly analogous to those found to be associated with AD (5), including bilateral superior and inferior parietal cortex, precuneus, supramarginal gyrus, superior frontal gyrus, pars opercularis, pars triangularis, temporal pole, inferior temporal cortex, parahippocampal gyrus, and entorhinal cortex.
Visit 1 cortical thickness was correlated with social, cognitive, and total DLD scores and the visit 2 – visit 1 change in scores. The false discovery rate (FDR) correction was applied.
Results
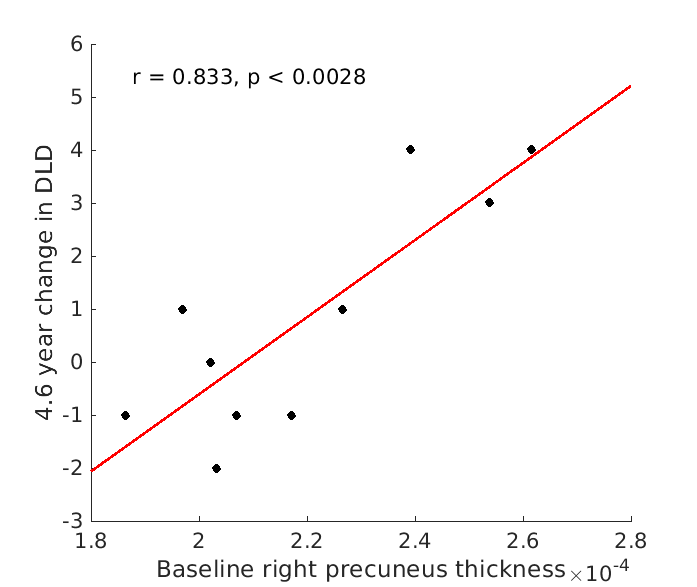
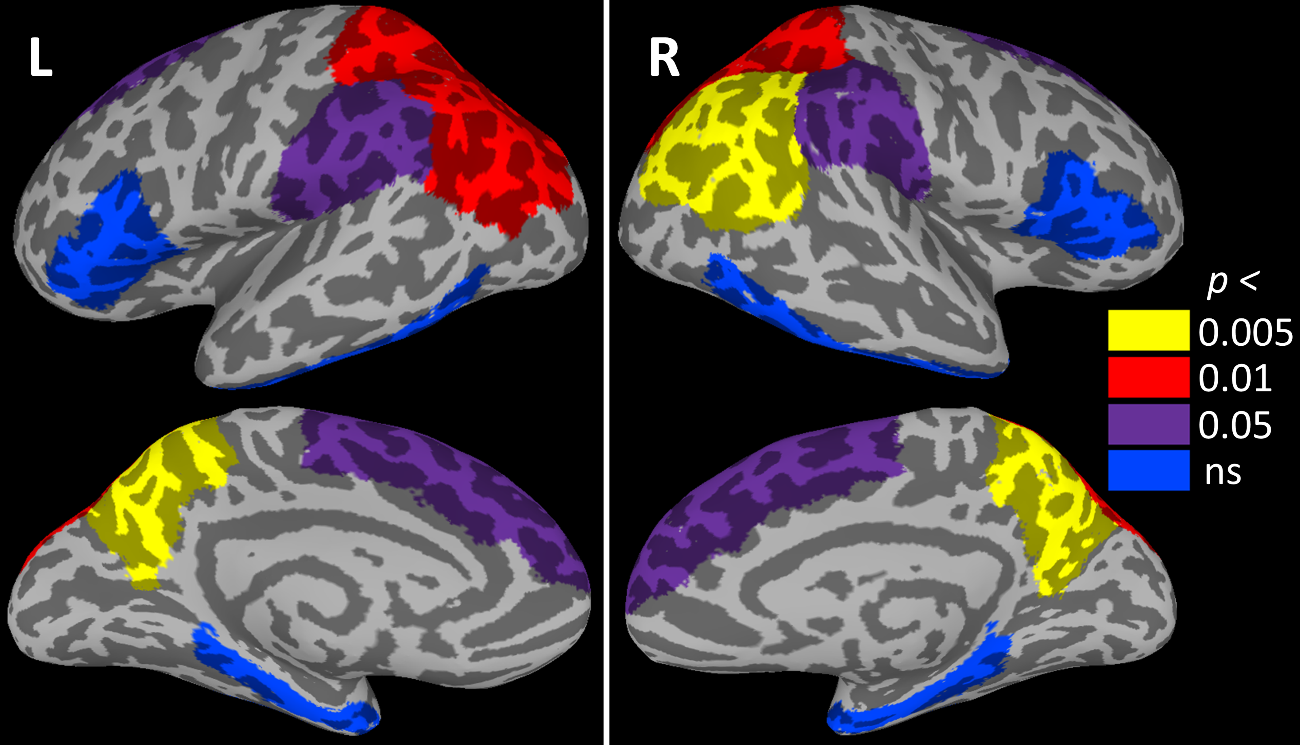
No participants showed symptoms of dementia onset at visit 2. DLD change scores were below those considered clinically significant (7), although mean total DLD score increased from 5.7 to 8.3 (p < 0.047, driven by an increase in cognitive score). Cortical thickness was not related to total DLD or to cognitive or social scores at either visit. Likewise, cortical thickness was not related to the change in total DLD or the change in cognitive score. However, the change in DLD social score was positively related to thickness in bilateral precuneus (p < 0.005; Figure 1) and superior and inferior parietal cortices (p < 0.01). The relationship to thickness of the bilateral superior frontal and supramarginal gyri did not survive FDR correction (p < 0.05). Figure 2 shows the relationship of all tested regions to the change in DLD social score.Discussion
In a sample of adults with DS, those with increased cortical thickness showed an increase in the number of potentially dementia-related social domain symptoms after 4.6 years. Previous work has associated DSAD with cortical atrophy, but none of the participants in this study were diagnosed with DSAD and the increase in symptoms was not clinically significant for any participant. Although preliminary, this finding suggests that the magnitude of early DS-related neuroanatomical differences may relate to aspects of dementia onset. Measurement of further dementia-related changes in these participants will require longitudinal follow up and confirmation in a larger sample.Acknowledgements
This work was supported by the Alzheimer’s Association (2016-NIRG-395687) and the National Institute of Aging (P30 AG062428 01), with technical support by Siemens Medical Solutions.References
1. Levman J, MacDonald A, Baumer N, et al. Structural Magnetic Resonance Imaging Demonstrates Abnormal Cortical Thickness in Down Syndrome: Newborns to Young Adults. Neuroimage Clin. 2019; 23(101874):1-8.
2. Lee NR, Adeyemi EI, Lin A, et al. Dissociations in Cortical Morphometry in Youth with Down Syndrome: Evidence for Reduced Surface Area but Increased Thickness. Cereb Cortex. 2016; 26(7):2982-90.
3. Bletsch A, Mann C, Andrews DS, et al. Down syndrome is accompanied by significantly reduced cortical grey–white matter tissue contrast. Human Brain Mapping. 2018; 39(10):4043-4054.
4. Koenig, KA, Oh, SH, Stasko, MR, et al. High resolution structural and functional MRI of the hippocampus in young adults with Down syndrome. Brain Commun. 2021; 3(2):fcab088.
5. Dickerson BC, Bakkour A, Salat DH, et al. The Cortical Signature of Alzheimer’s Disease: Regionally Specific Cortical Thinning Relates to Symptom Severity in Very Mild to Mild AD Dementia and is Detectable in Asymptomatic Amyloid-Positive Individuals. Cerebral Cortex. 2009; 19(3):497–510.
6. Benejam, B, Aranha, MR, Videla, L, et al. Neural correlates of episodic memory in adults with Down syndrome and Alzheimer’s disease. Alzheimer's Research & Therapy. 2022; 14:123.
7. Evenhuis, H. M. Further evaluation of the Dementia Questionnaire for Persons with Mental Retardation. J Intellectual Disabilities Res. 1996; 40(4):369-373.
Figures