3042
Functional connectivity to entorhinal cortex in hypertensive Alzheimer’s disease rat models1Max Planck Institute for Biological Cybernetics, Tuebingen, Germany, 2Department of Radiology, Michigan State University, East Lansing, MI, United States, 3Department of Radiology and Cognitive Imaging Research Center, Michigan State University, East Lansing, MI, United States, 4Neuroscience Program, Michigan State University, East Lansing, MI, United States, 5Department of Translational Neuroscience, Michigan State University, Grand Rapids, MI, United States, 6Department of Pharmacology and Toxicology, Michigan State University, East Lansing, MI, United States, 7Department of Family Medicine, Michigan State University, Grand Rapids, MI, United States, 8Hauenstein Neurosciences Center, Mercy Health Saint Mary’s Hospital, Grand Rapids, MI, United States
Synopsis
Keywords: Alzheimer's Disease, Animals
Extensive studies have revealed that the entorhinal cortex (EC) plays a critical role in Alzheimer’s disease (AD) development. However, EC functional connectivity and its associated network abnormalities are understudied, especially in rodent models. To the best of our knowledge, this is the first study to report disrupted EC functional connectivity in hypertensive AD rodents using resting-state fMRI. Our results may provide new insights into the impaired EC connectivity patterns and enable the search for novel preclinical EC-based fMRI biomarkers for AD studies. In addition, our novel animal model provides new information to understand the link between hypertension and AD.Introduction
The entorhinal cortex (EC) plays a critical role in functional disconnection of cognitive brain networks during AD development and is a potential target for disease modification1,2. BOLD-fMRI can convey whole-brain dynamic functional connectivity mapping noninvasively3. However, the EC function/dysfunction and its associated network abnormalities are understudied, especially in rodent models. Therefore, we characterized the functional connectivity between EC and the rest of the brain in rats using resting-state fMRI. We explored the EC functional connectivity difference between hypertensive AD and hypertensive rats.Methods
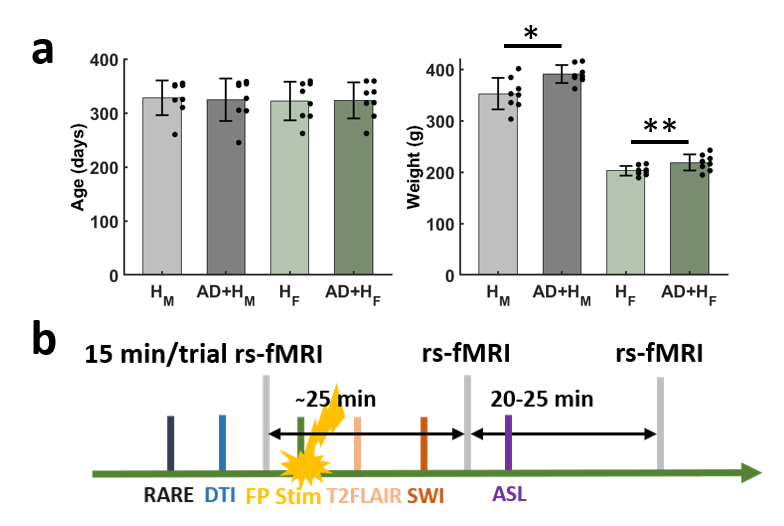
The hypertensive AD rat model was developed by breeding the Tg344-19 AD rat model4 with the spontaneously hypertensive stroke-prone rat (SHRSP) model of cerebrovascular small vessel disease5. Four groups of rats were used (8 female/male SHRSP and eight female/male SHRSP*Tg344-19). All procedures in this study were conducted in accordance with guidelines set by the Institutional Animal Care and Use Committee of Michigan State University. All images were acquired on a 7 T small-animal scanner (Bruker BioSpin, Billerica, MA). A 72-mm quadrature volume coil and a 1H receive-only 2 × 2 brain surface array coil were used to transmit and receive magnetic resonance signals, respectively. For each rat, anesthesia was introduced first with nasal inflow of isoflurane and an initial bolus of subcutaneous injection of dexmedetomidine (0.1 mg/kg). It was then maintained via a steady subcutaneous injection of dexmedetomidine (0.1 mg/kg/h) during scanning. Functional images (Fig. 2, 3) were acquired with a 3D gradient-echo EPI sequence with the following parameters: time of echo (TE) = 20 ms, time of repetition (TR) = 1 s, field of view (FOV) = 2.6 cm × 2.6 cm × 1.6 cm, matrix size = 52 × 52 × 32, voxel size = 0.5 mm × 0.5 mm × 0.5 mm. Each rs-fMRI scan acquired 900-time points over 15 mins. The preprocessing procedures followed a commonly used protocol in rat rs-fMRI data6, including motion correction, despike, spatial blurring, and 0.01-0.1 Hz bandpass filtering in AFNI.Results
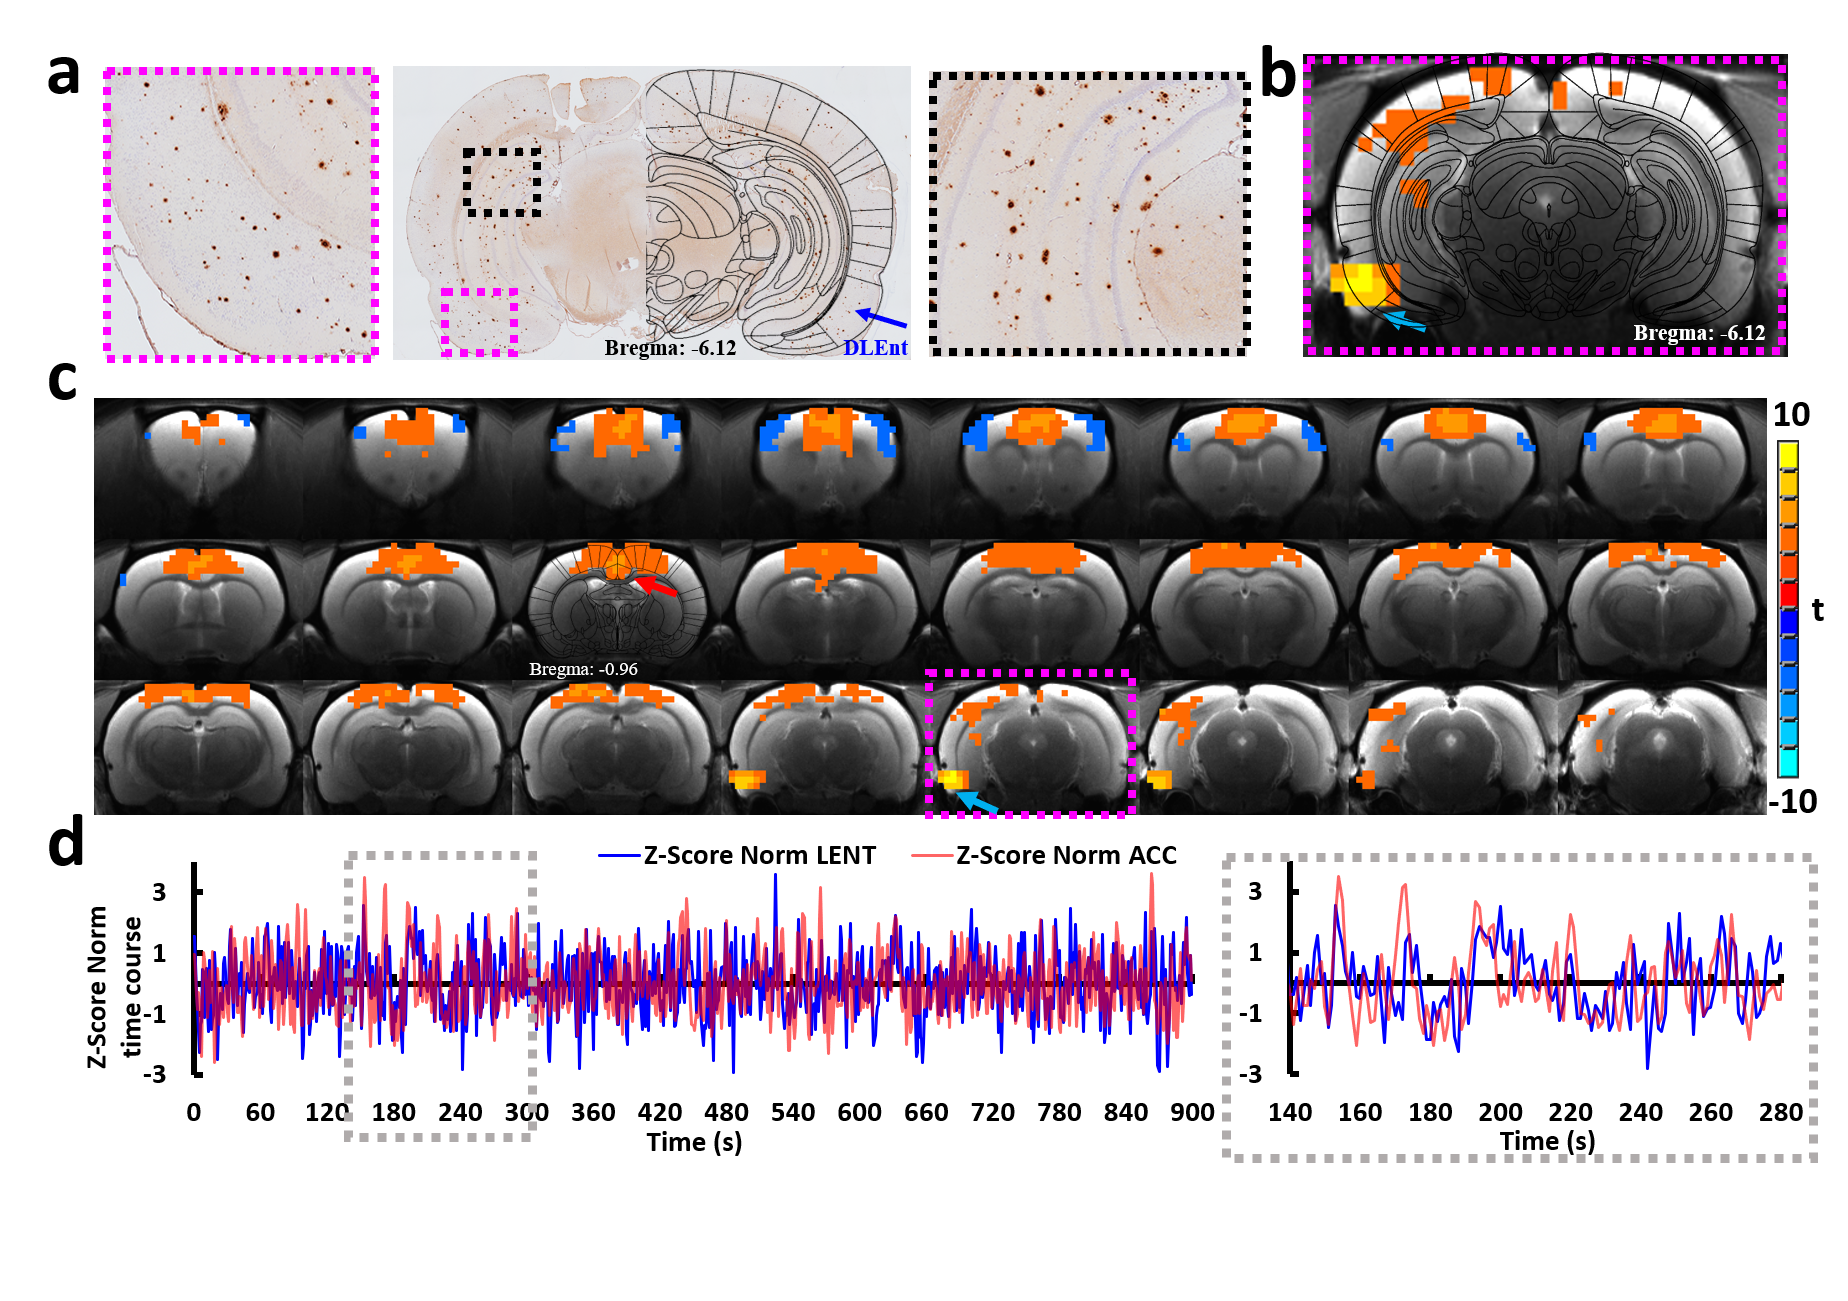
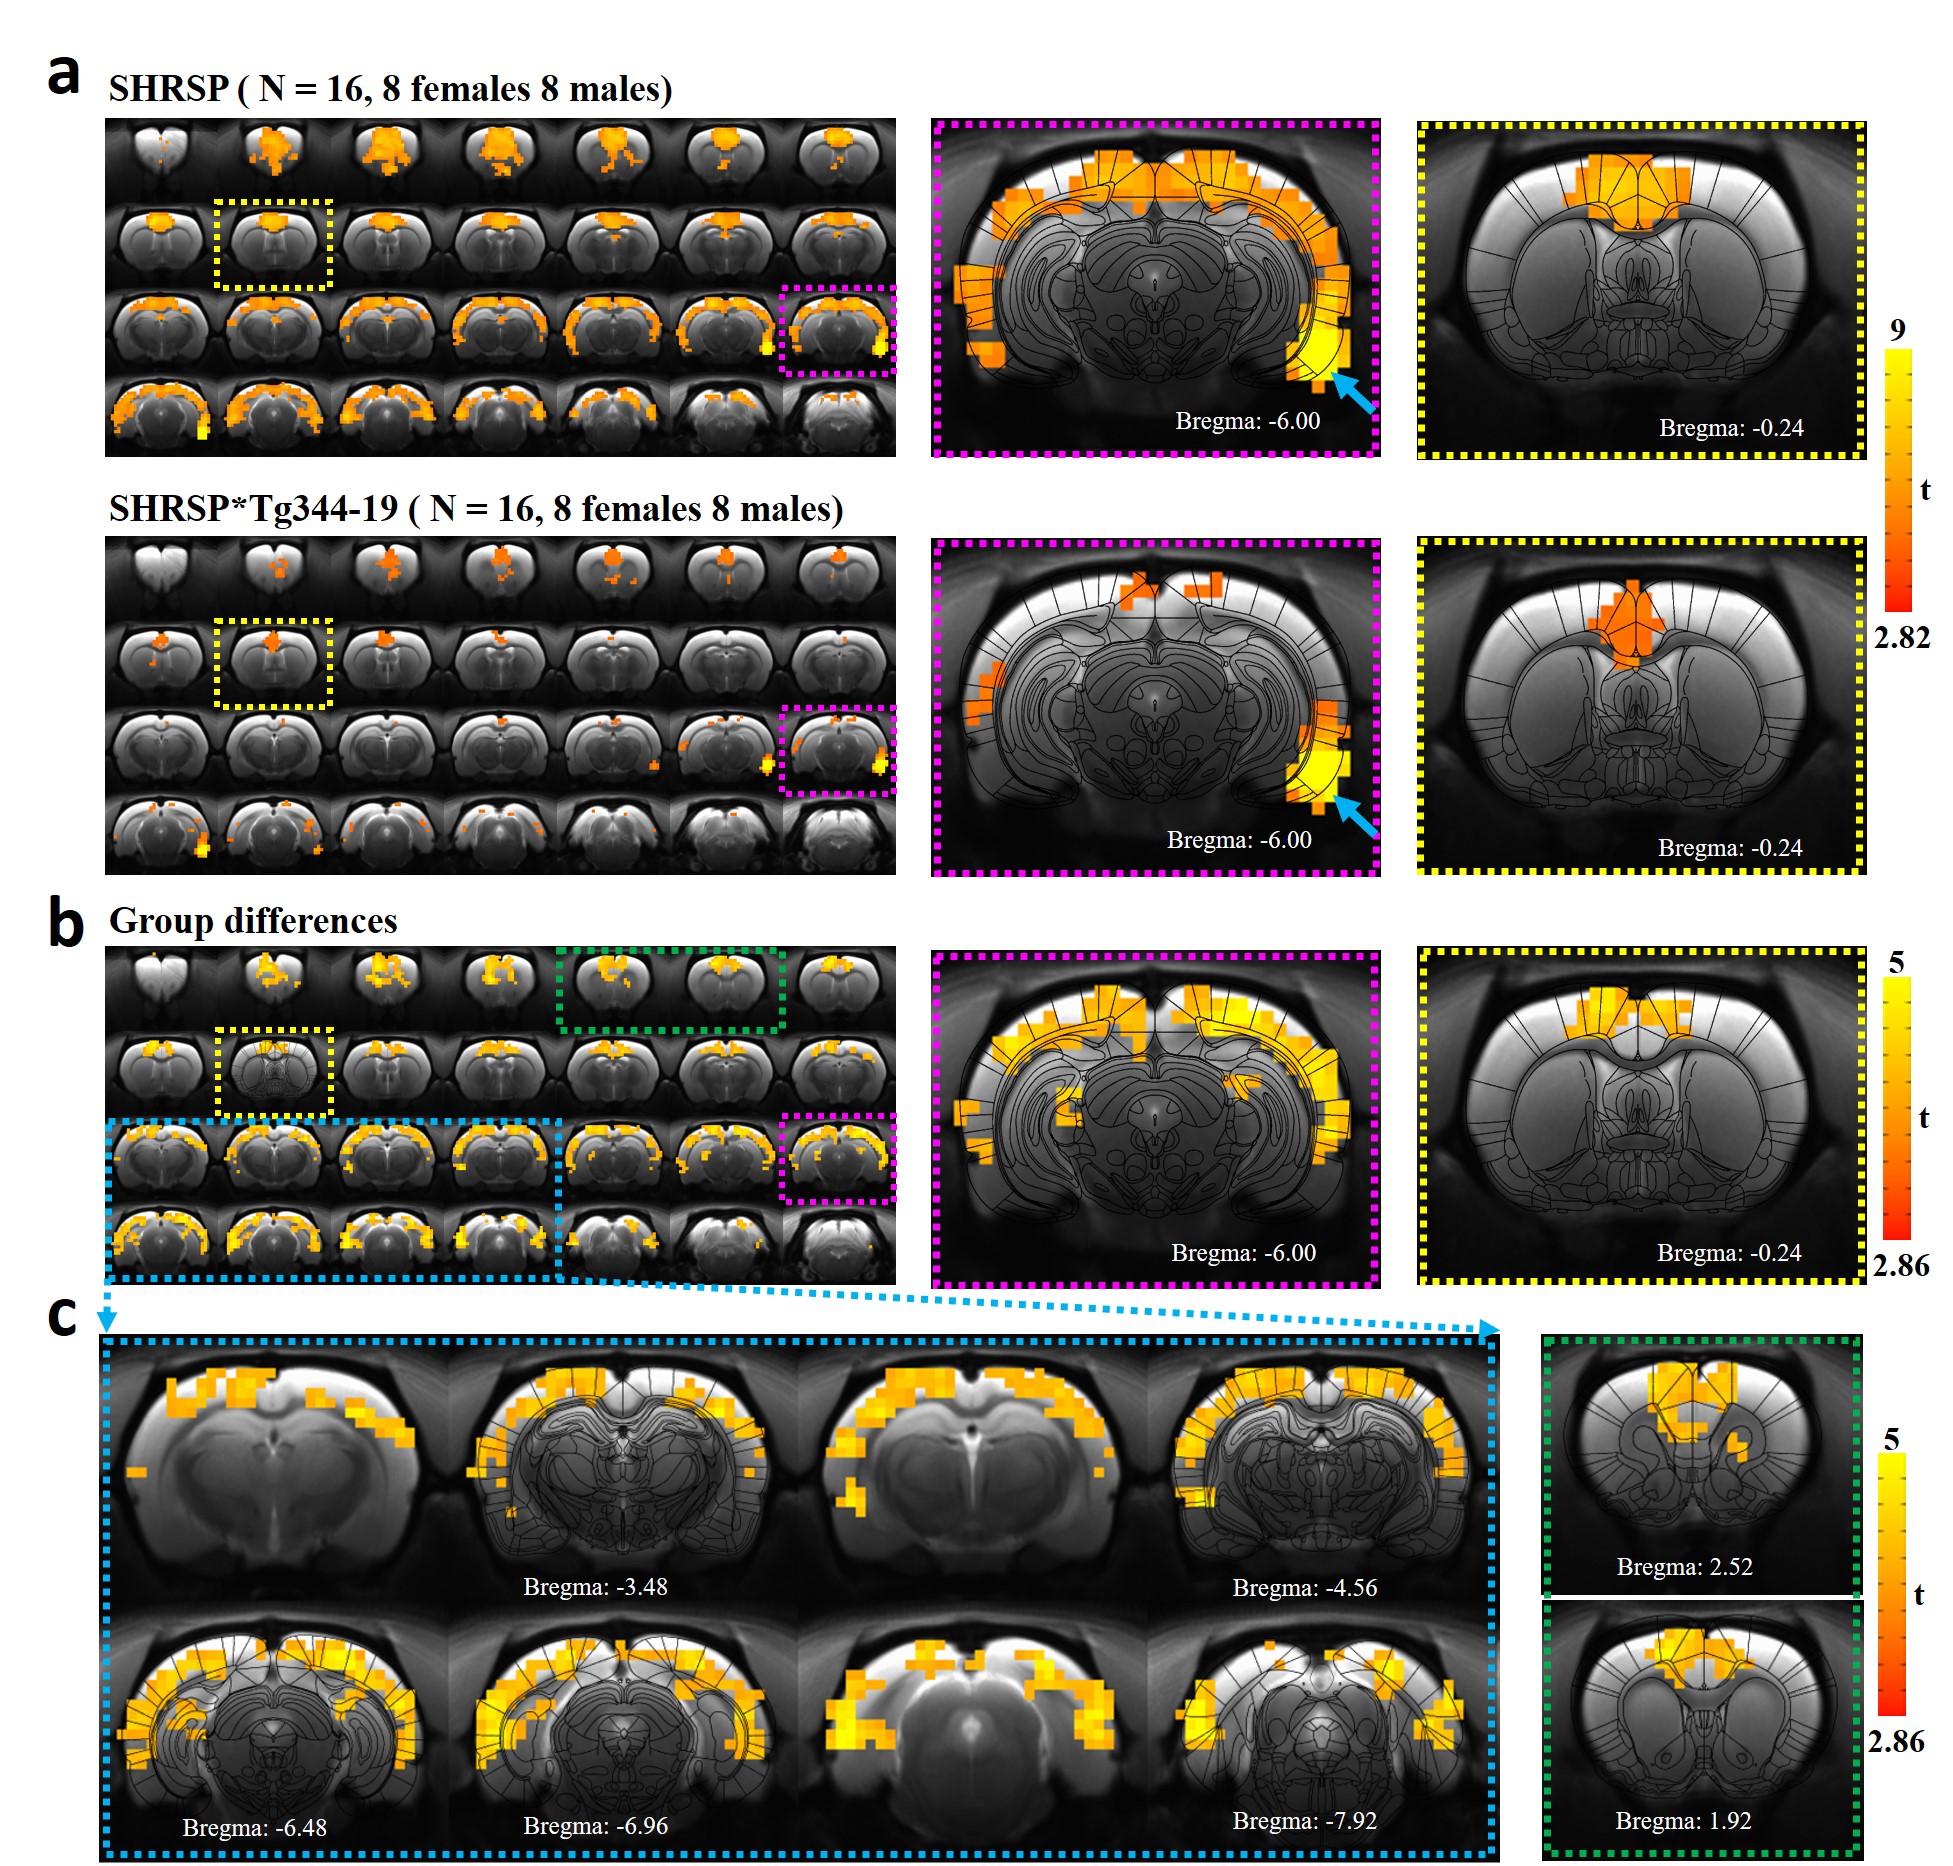
Animals were imaged at ~8-12 months of age. similar ages. The body weights were significantly higher in both the male and female SHRSP*Tg344-19 animals (Fig. 1). In preliminary studies, we identified extensive amyloid-β deposition throughout postmortem rat forebrain tissue including EC (Fig. 2a). Given the diverse heterogeneous projections of EC, then we chose the region with a prominent amyloid-β deposition in the EC as the seed to correlate the voxel-wise fMRI signals to the rest of the brain. Highly consistent with other studies4, we observed significant correlations in the hippocampus, piriform cortex, septal nuclei, and prefrontal cortex from five representative animals (Fig. 2c). The group connectivity maps in Fig. 3 show higher connectivity from the right EC to the prefrontal cortex, visual cortex, auditory cortex, M1/M2, and symmetric EC connectivity in the SHRSP rats compared to the SHRSP*Tg344-19 rats.Conclusion
To the best of our knowledge, this is the first study to report the reduced functional connectivity to the EC in a hypertensive AD rodent model. Our results may provide new insights into different EC functional connectivity patterns and enable the search for novel preclinical EC-based fMRI biomarkers for AD studies. In addition, the novel animal model with concurrent hypertension and AD provides new information to understand the link between hypertension and Alzheimer’s disease.Acknowledgements
This research was supported by NIH RF1NS113278-01, RF1NS128611-01 (CQ), NIH R01AG060731-A1 (SEC), NIH R21AG074514-01(AMD), NIH R01-HL-13769401 (AMD), R01AG057571 (DCZ) and by the Division of Electrical, Communications and Cyber Systems of the National Science Foundation under award number 2144138 (CQ). This project has also received funding from the European Union Framework Program for Research and Innovation Horizon 2020 (2014-2020) under the Marie Skłodowska-Curie Grant Agreement No.896245. Any opinions, findings, and conclusions or recommendations expressed in this material are those of the author(s) and do not necessarily reflect the views of the funding agencies.References
1 Suthana, N. et al. Memory enhancement and deep-brain stimulation of the entorhinal area. N Engl J Med 366, 502-510, doi:10.1056/NEJMoa1107212 (2012).
2 Mankin, E. A. & Fried, I. Modulation of Human Memory by Deep Brain Stimulation of the Entorhinal-Hippocampal Circuitry. Neuron 106, 218-235, doi:10.1016/j.neuron.2020.02.024 (2020).
3 Logothetis, N. K. What we can do and what we cannot do with fMRI. Nature 453, 869-878, doi:10.1038/nature06976 (2008).
4 Kelly, S. C. et al. Locus Coeruleus Degeneration Induces Forebrain Vascular Pathology in a Transgenic Rat Model of Alzheimer's Disease. J Alzheimers Dis 70, 371-388, doi:10.3233/JAD-190090 (2019).
5 Pires, P. W., Jackson, W. F. & Dorrance, A. M. Regulation of myogenic tone and structure of parenchymal arterioles by hypertension and the mineralocorticoid receptor. Am J Physiol Heart Circ Physiol 309, H127-136, doi:10.1152/ajpheart.00168.2015 (2015).
6 Jung, W. B., Jiang, H., Lee, S. & Kim, S. G. Dissection of brain-wide resting-state and functional somatosensory circuits by fMRI with optogenetic silencing. Proc Natl Acad Sci U S A 119, doi:10.1073/pnas.2113313119 (2022).
Figures