3041
MR-based Parenchymal CSF water fraction (CSFF) is a marker of glymphatic clearance function and relates to beta-amyloid deposition on 11C-PiB PET1Weill Cornell Medicine, New York, NY, United States
Synopsis
Keywords: Alzheimer's Disease, Neurofluids
Glymphatic clearance has recently gained increasing attention as a major driver of neurodegenerative diseases like Alzheimer’s disease. Perivascular spaces is believed to reflect glymphatic clearance such that enlargement of the PVS is believed to reflect blocked glymphatic clearance. We present preliminary work on a MR-based FAST-T2 CSF water fraction map to study glymphatic clearance. Our results show a quadratic relationship between CSFF and PiB PET SUVR in AD-specific regions. This indicates that CSFF could be a biomarker of dysfunctional glymphatic clearance, leading to early beta amyloid accumulation, since early on, CSFF increases without a significant change in PiB PET SUVR.Introduction
Glymphatic clearance has recently gained increasing attention as a major driver of neurodegenerative diseases like Alzheimer’s disease (AD)1. Perivascular space (PVS) is of the key route of the glymphatic system, facilitates the water exchange between CSF and ISF, and is believed to reflect glymphatic function. The enlargement of and fluid stasis in the PVS is believed to reflect blocked glymphatic clearance2. This dysfunctional clearance can lead to the deposition of extracellular amyloid beta and intracellular tau protein, which can be quantified using positron emission tomography (PET)3. Therefore, early detection of the clearance dysfunction is crucial to the prevention and diagnosis of neurodegenerative diseases4.In this study, we assessed the relationship between CSF water fraction (CSFF) mapping and beta-amyloid deposition using Pittsburgh compound B (11C-PiB) PET. We further assessed CSF water fraction mapping at low (5mm thickness) and high (2mm thickness) resolution5 to exclude the possible concerns about the partial volume effect (PVE).
Material and Methods
SubjectsA total of 45 subjects (21 normal controls, 11 MCI/AD, and 13 unknown diagnoses) were scanned on a 3T Siemens Prisma scanner with a 64-channel head-neck coil. The six echoes (TE=0, 7.5, 17.5, 67.5, 147.5, 307.5 ms) of MR FAST-T2 data were acquired with both 2mm (highRes) and 5mm (lowRes) thickness with common in-plane resolution 0.93mmX0.93mm.6 T1 MPRAGE images (isotropic 0.5 mm3) were acquired for coregistration and ROI parcellation. A total of 18 subjects (11 controls and 7 MCI/AD) had concomitant PiB PET, all of which had low-resolution FAST-T2 data.
Processing
The 6 echoes FAST-T2 data were fitted into the three-water compartment model with regularized nonlinear least square7. Then the CSFF map was obtained by dividing the long T2 (T2>200 ms) compartment signal magnitude by the total signal magnitude. The CSFF was co-registered to the FreeSurfer T1 space for ROI value extraction8. The PiB PET data was processed with temporal realignment, summation of 60-90 min time frames, coregistration to FreeSurfer T1 space, and calculation of the SUVR with a cerebellum cortex reference9. All the ROIs used in this work were eroded by 1 voxel to reduce the PVE.
Analysis
First, the regression was examined between CSFF and the PiB SUVR in AD-mask10 to evaluate the linear and nonlinear association between beta-amyloid deposition and CSFF. Secondly, we qualitatively checked the low- and high-resolution CSFF map and overlayed them on the susceptibility image (SWI) to see the consistency of hyperintensity spots (CSF/free water in PVS) on the CSFF map and hypointensity spots (medullary vein) surrounding lateral ventricle. Thirdly, we compared the ROI values of CSFF from both low- and high-resolution maps. The linear regression and Bland-Altman analyses were done to check the consistency between the low- and high-resolution CSFF to further exclude the concerns about PVE.
Results
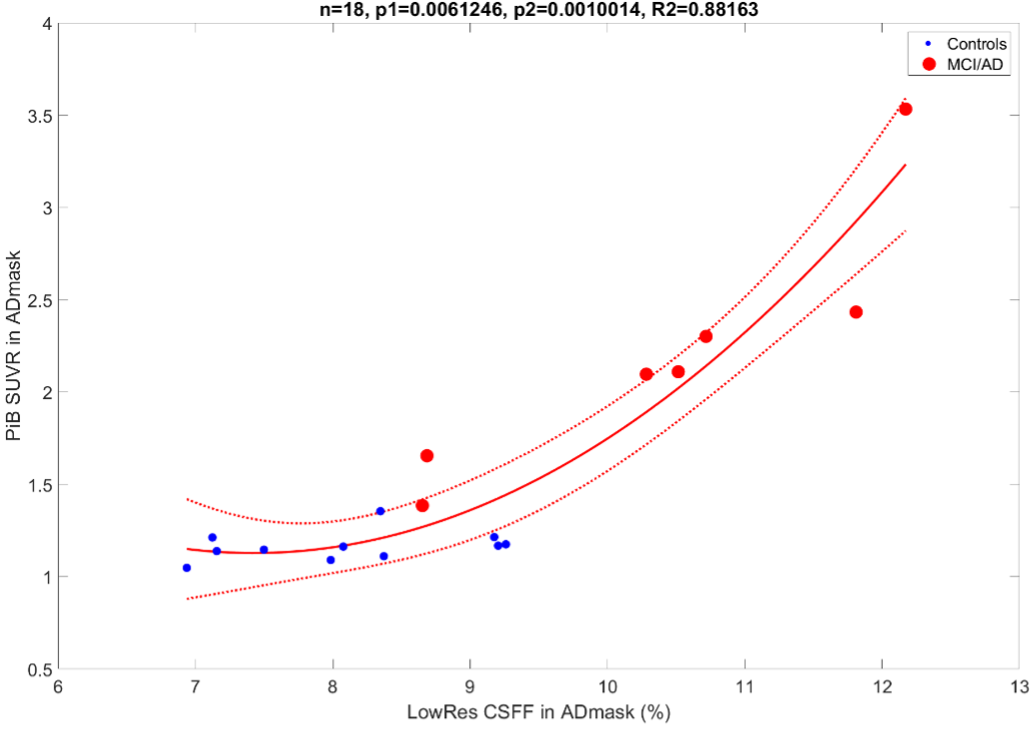
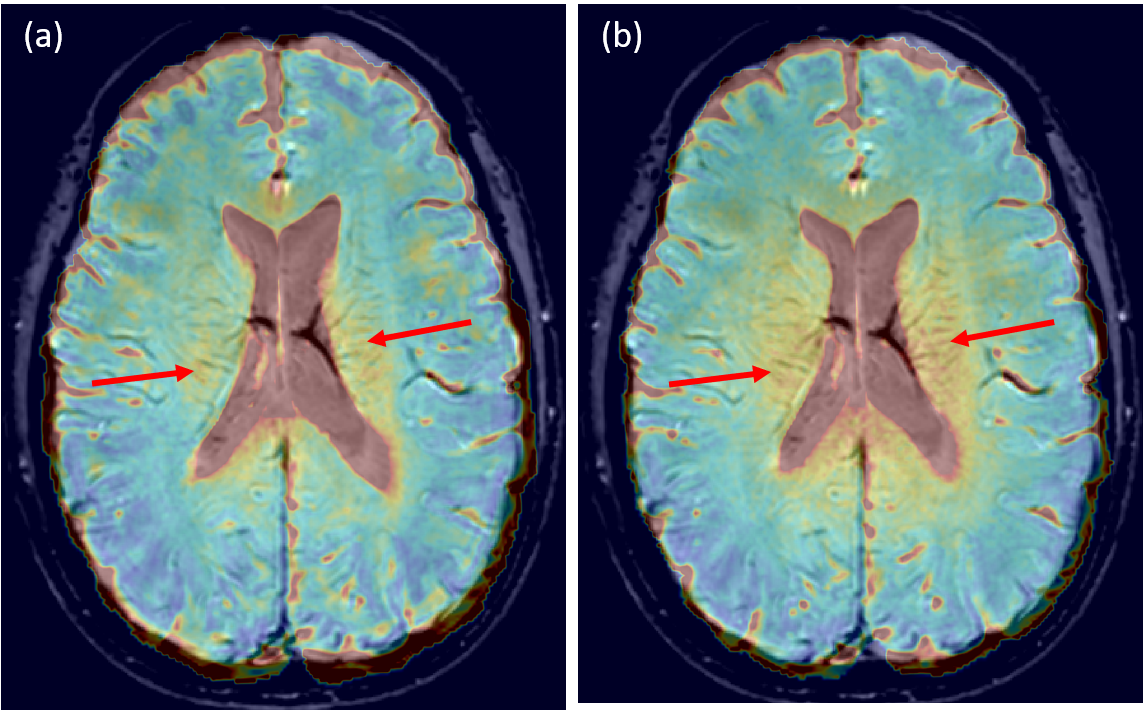
Figure 1 shows the quadratic relationship between the PiB SUVR and the low-resolution CSFF in ADmask (p1=0.006 for the first-order term, p2=0.001 for the second-order term, whole model R2=0.88). The healthy controls and MCI/AD subjects are presented with blue dots and red dots, respectively.Figure 2 shows the high and low-resolution CSFF maps overlayed on the same subject’s SWI images. (a) is high-resolution CSFF on SWI, and (b) is low-resolution CSFF on SWI. High CSFF signals around the lateral ventricle and along with medullary veins are observed.
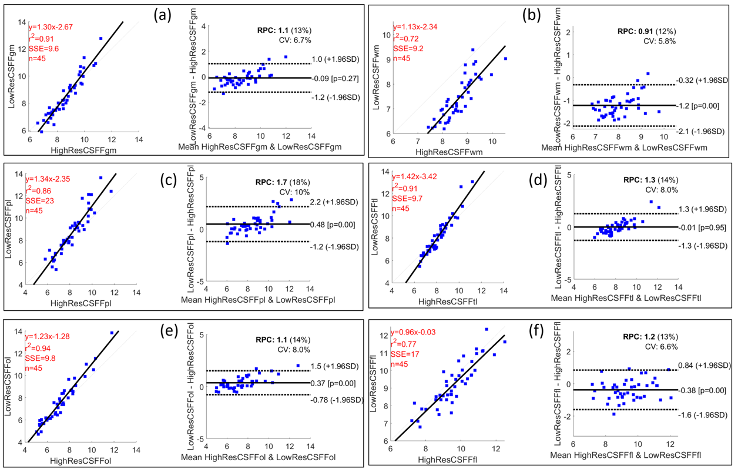
Figure 3 shows the linear regression and Bland-Altman plots comparing low- and high-resolution CSFF. The data show for: (a) the global cerebral cortex (p<0.0001, R2=0.91); (b) the global cerebral white matter (p<0.0001, R2=0.72); (c) the parietal lobe (p<0.0001, R2=0.86); (d) the temporal lobe (p<0.0001, R2=0.91); (e) the occipital lobe (p<0.0001, R2=0.94); (f) the frontal lobe (p<0.0001, R2=0.77). The Bland-Altman plots show that 97% of points lie within 1.96 standard deviations (which corresponds to a 95% confidence interval).
Discussion and conclusion
We present preliminary work on an MR-based FAST-T2 CSF water fraction map to study glymphatic clearance. Our results show a quadratic relationship between CSFF and the PiB PET SUVR in AD-specific regions. This indicates that CSFF could be a biomarker of dysfunctional glymphatic clearance, leading to early beta-amyloid accumulation, since early on, CSFF increases without a significant change in PiB PET SUVR (Figure 1).Figure 2 (a) and (b) show that the PVS surrounding medullary veins can be seen on both high- and low-resolution CSFF confirmed by cross-validation on SWI. Hyperintense CSFF foci with the medullary vein on SWI surrounding the lateral ventricle indicate a potential CSF clearance pathway, which is also corresponding to the findings of recent DTI-ALPS studies11.
Figure 3 shows that the CSFF value is consistent in both low (5mm thickness) and high (2mm thickness) resolution mapping within 1 voxel-eroded ROIs. This will justify the low-resolution FAST-T2 data in the analysis when high-resolution (thin-slice) images are not required/available.
Enlarged PVS can be seen on both low and high-resolution CSFF but smaller ones are not visible on CSFF or conventional T1w or T2w. CSFF corresponding to the long T2 signal that represents free water could be a more accurate measure of total CSF in the glymphatic system than the total PVS load.
Acknowledgements
This study is supported by NIH grants R01AG057848, R01AG068398, RF1AG057570, and R56AG058913.References
1. Benveniste H, Liu X, Koundal S, Sanggaard S, Lee H, Wardlaw J. The Glymphatic System and Waste Clearance with Brain Aging: A Review. GER. 2019;65(2):106-119. doi:10.1159/000490349
2. Gouveia-Freitas K, Bastos-Leite AJ. Perivascular spaces and brain waste clearance systems: relevance for neurodegenerative and cerebrovascular pathology. Neuroradiology. 2021;63(10):1581-1597. doi:10.1007/s00234-021-02718-7
3. Harrison IF, Ismail O, Machhada A, et al. Impaired glymphatic function and clearance of tau in an Alzheimer’s disease model. Brain. 2020;143(8):2576-2593. doi:10.1093/brain/awaa179
4. Li Y, Rusinek H, Butler T, et al. Decreased CSF clearance and increased brain amyloid in Alzheimer’s disease. Published online October 31, 2021. doi:10.21203/rs.3.rs-900478/v1
5. Zhou, Liangdong, Nguyen TD, Li, Yi. T2 relaxometry based CSF fraction (CSFF) mapping is a better biomarker for brain drainage pathology than DTI-based free water (DTI-FW) mapping. Proc Intl Soc Mag Reson Med. 2022;30.
6. Zhou, Liangdong, Nguyen TD, Li, Yi. MRI-based parenchyma CSF fraction (CSFF) mapping is a potential biomarker of brain drainage function: a multimodal imaging study. Proc Intl Soc Mag Reson Med. 2022;30.
7. Nguyen TD, Deh K, Monohan E, et al. Feasibility and reproducibility of whole brain myelin water mapping in 4 minutes using fast acquisition with spiral trajectory and adiabatic T2prep (FAST-T2) at 3T. Magn Reson Med. 2016;76(2):456-465. doi:10.1002/mrm.25877
8. Dale AM, Fischl B, Sereno MI. Cortical Surface-Based Analysis: I. Segmentation and Surface Reconstruction. NeuroImage. 1999;9(2):179-194. doi:10.1006/nimg.1998.0395
9. Su Y, D’Angelo GM, Vlassenko AG, et al. Quantitative Analysis of PiB-PET with FreeSurfer ROIs. PLOS ONE. 2013;8(11):e73377. doi:10.1371/journal.pone.0073377
10. Mosconi L, Rinne JO, Tsui WH, et al. Increased fibrillar amyloid-β burden in normal individuals with a family history of late-onset Alzheimer’s. Proceedings of the National Academy of Sciences. 2010;107(13):5949-5954. doi:10.1073/pnas.0914141107
11. Taoka T, Masutani Y, Kawai H, et al. Evaluation of glymphatic system activity with the diffusion MR technique: diffusion tensor image analysis along the perivascular space (DTI-ALPS) in Alzheimer’s disease cases. Jpn J Radiol. 2017;35(4):172-178. doi:10.1007/s11604-017-0617-z
Figures