3040
Spatial navigation reveals subcortical structural covariance and progression risk in subjective cognitive decline1Department of Radiology, Drum Tower Hospital, Clinical College of Nanjing Medical University, Nanjing, China, 2Department of Radiology, The Affiliated Drum Tower Hospital of Nanjing University Medical School, Nanjing, China
Synopsis
Keywords: Alzheimer's Disease, Gray Matter, structural covariance network
We aimed to investigate whether spatial navigation could reveal subcortical structural alterations and the risk of clinical progression in subjective cognitive decline (SCD). SCD subjects were divided into SCD-good (G-SCD) and SCD-bad (B-SCD) groups according to their navigation performance. The B-SCD group showed decreased volumes in the basal forebrain and had a larger shortest path length in the subcortical structural covariance network than the G-SCD group. Follow-up data suggested that the B-SCD group had a higher conversion rate to MCI than the G-SCD group. This study may provide new insights for the risk assessment and early intervention for SCD subjects.Introduction
Abundant evidence has shown that subjective cognitive decline (SCD) may serve as a symptomatic indicator for preclinical Alzheimer’s disease (AD); however, the SCD is a heterogeneous entity in terms of underlying etiology and clinical progression1, 2. Longitudinal studies have suggested the promising utility of baseline spatial navigation ability in predicting future cognitive decline3, 4. We aimed to investigate whether spatial navigation could reveal subcortical structural alterations and the risk of progression to mild cognitive impairment (MCI) in SCD subjects.Methods
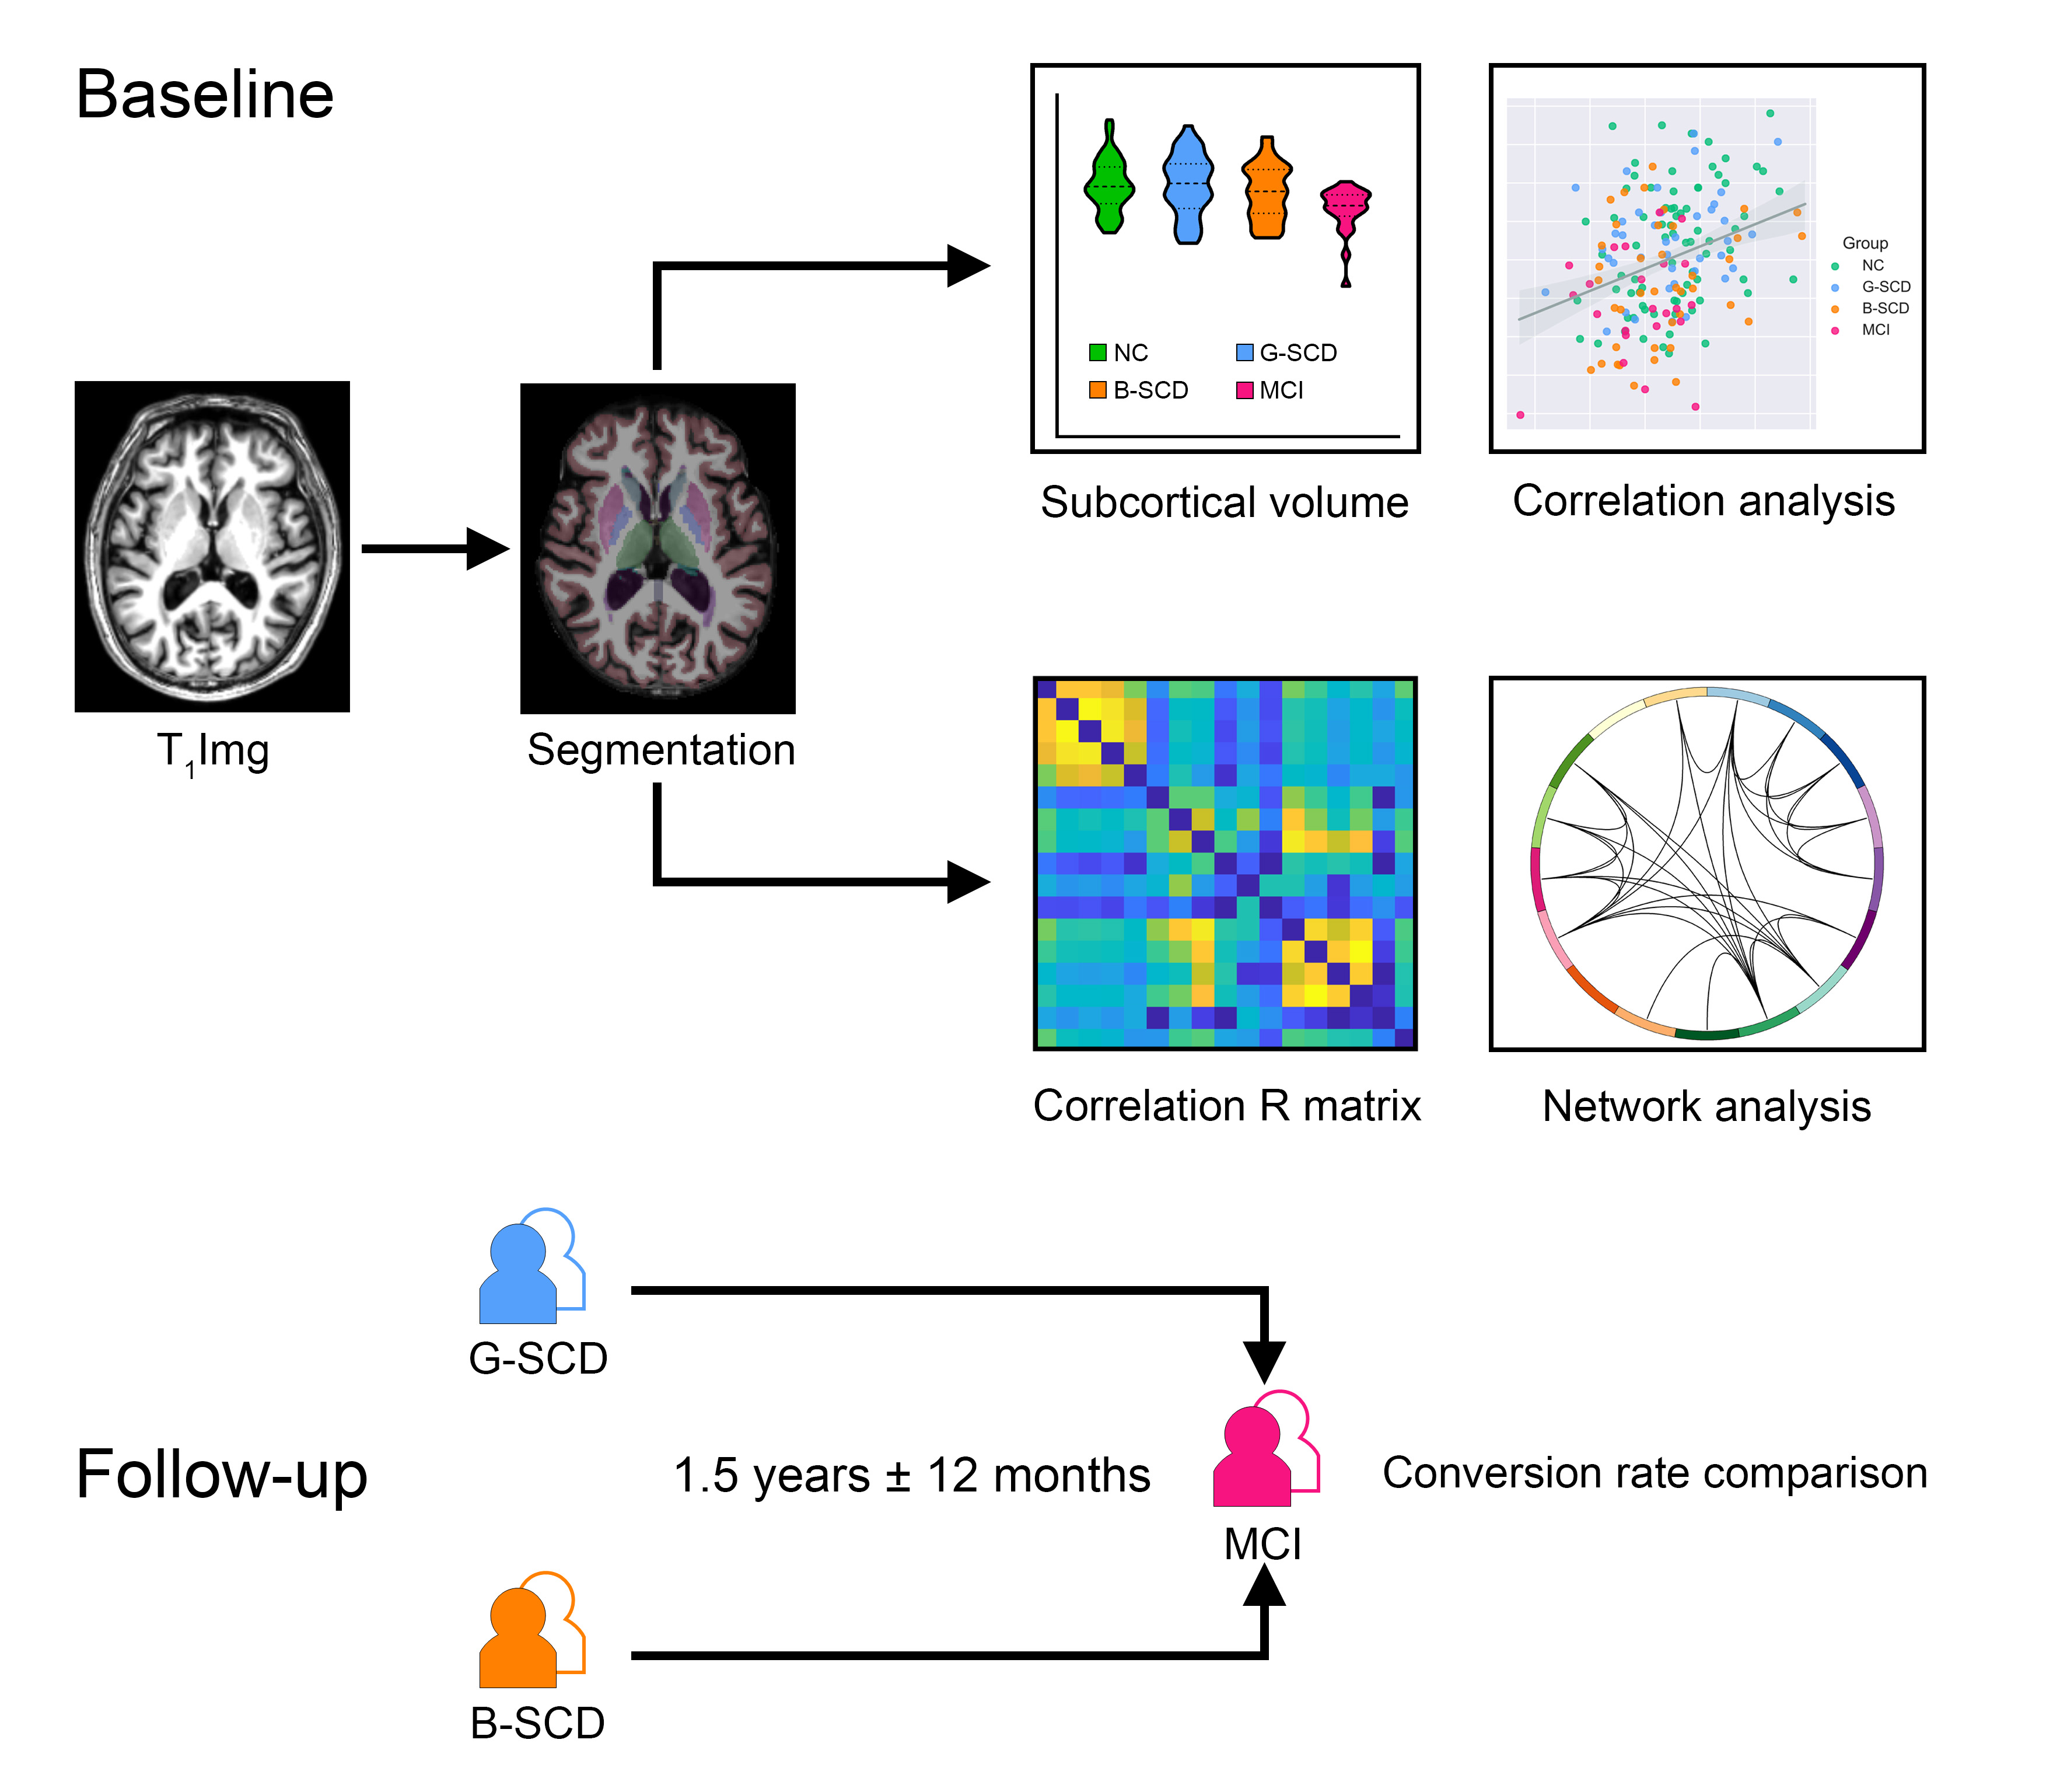
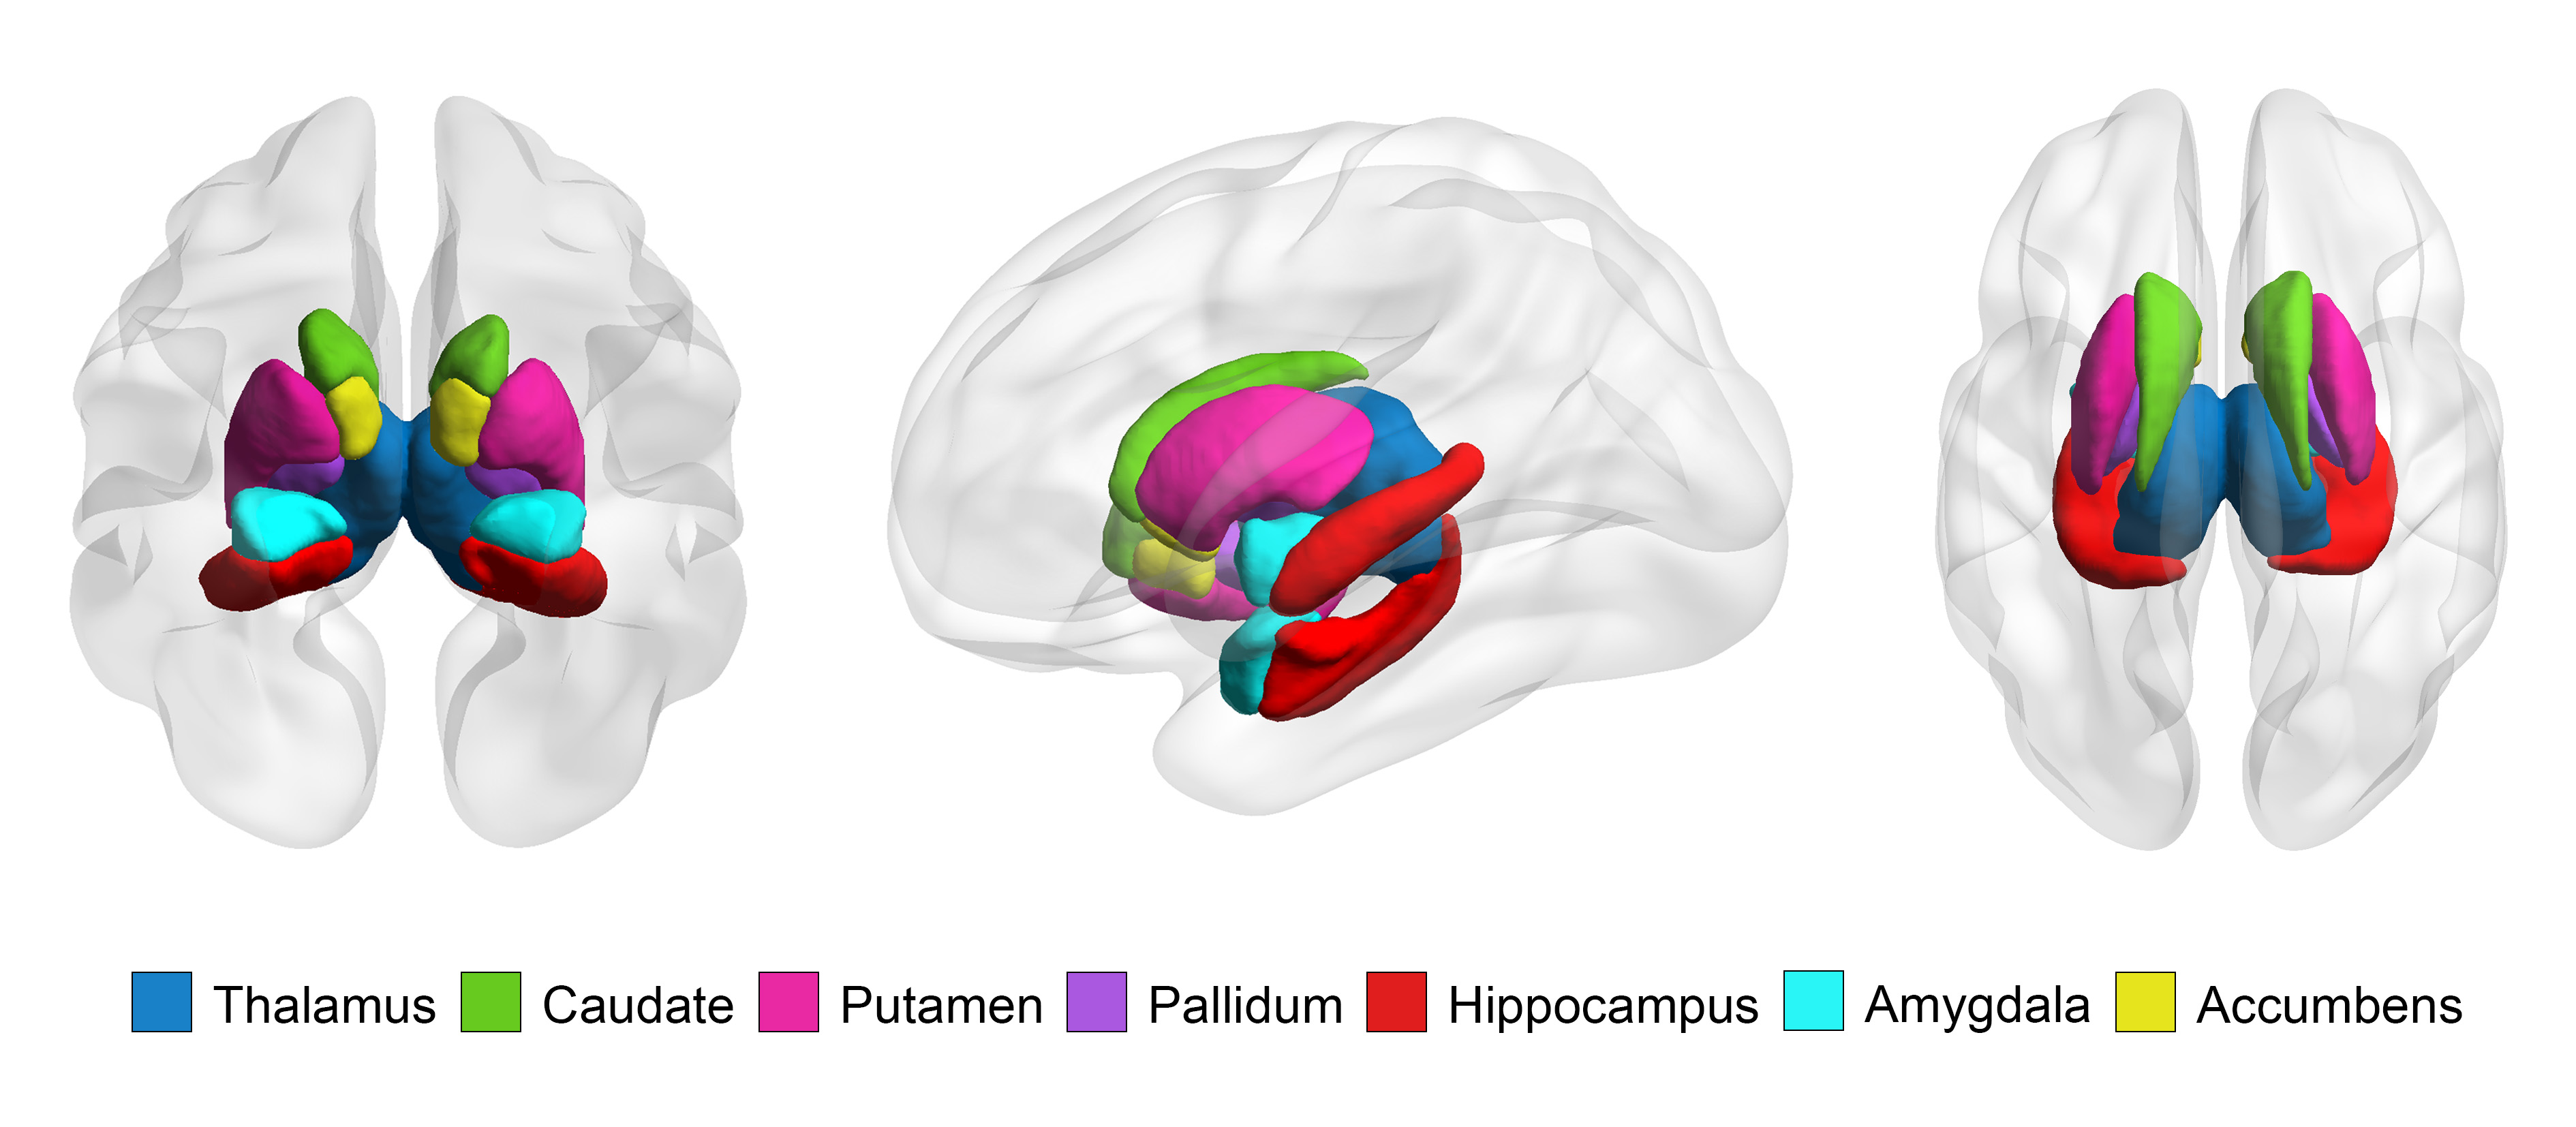
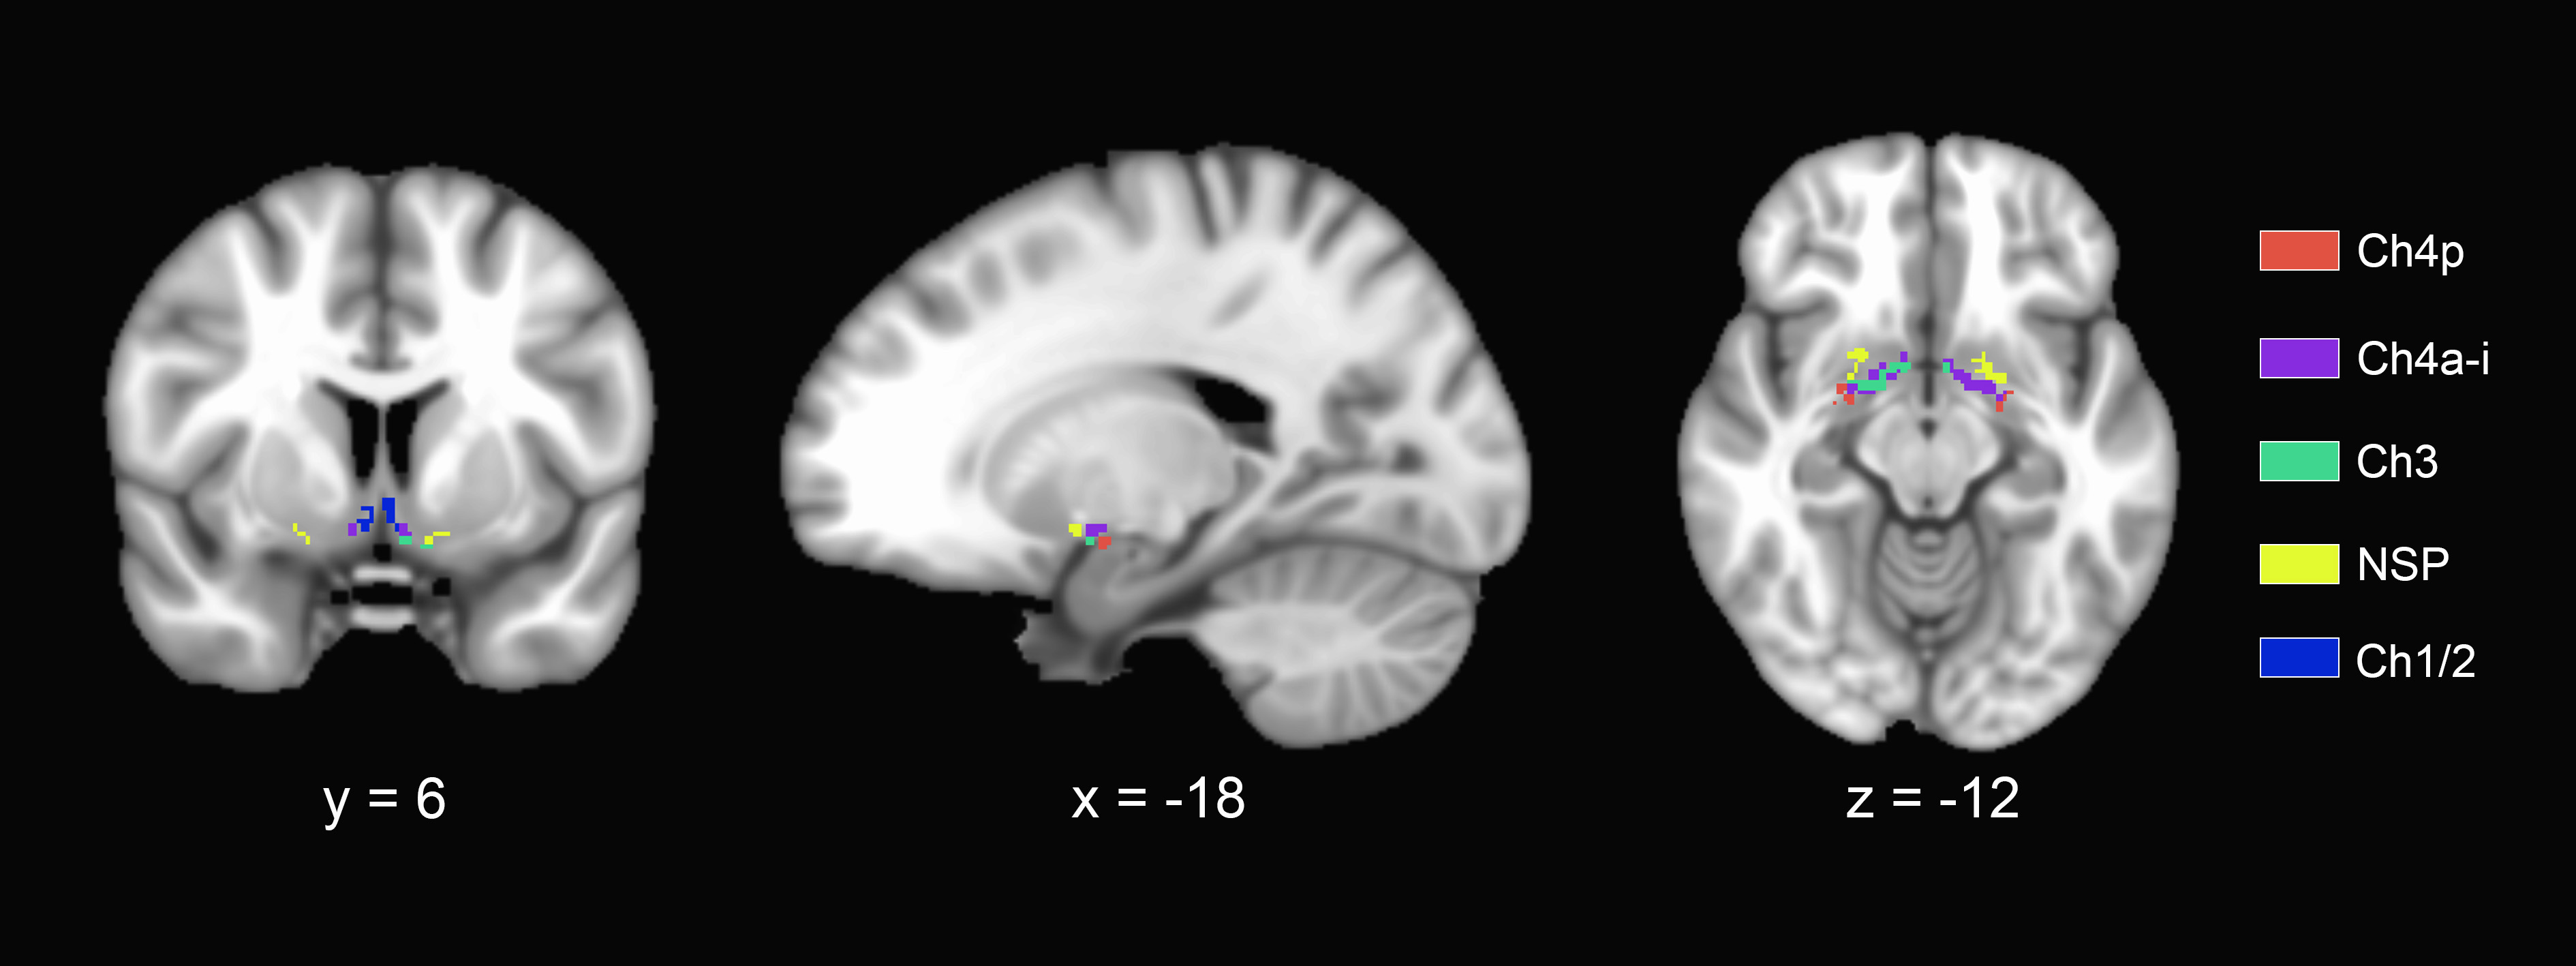
SCD subjects (n = 80), normal controls (NCs, n = 77) and MCI patients (n = 23) were enrolled. Each participant was administered a set of standardized neuropsychological tests, a computerized spatial navigation test, and brain MRI scanning. SCD subjects were further divided into the SCD-good (G-SCD, n = 40) group and the SCD-bad (B-SCD, n = 40) group according to their spatial navigation performance. The subcortical nuclei of thalamus, caudate, putamen, pallidum, hippocampus, amygdala, and accumbens were automatically segmented using the FreeSurfer version 6.6.0 image analysis suites. A cytoarchitectonic mask of the basal forebrain derived from histological sections of a postmortem brain was used to extract the basal forebrain volumes5. Associations of subcortical volumes with cognitive measures were assessed. Structural covariance network of subcortical nuclei was constructed using the Brain Connectivity Toolbox. Global metrics of clustering coefficient (Cp), characteristic path length (Lp), Gamma, Lambda, small worldness (Sigma), global efficiency, and local efficiency were calculated and compared among the four groups. With a bounded interval of a mean = 1.5 years ± 12 months of follow-up, neuropsychological assessment was re-performed, and the conversion rate to MCI were compared between the G-SCD and B-SCD groups.Results
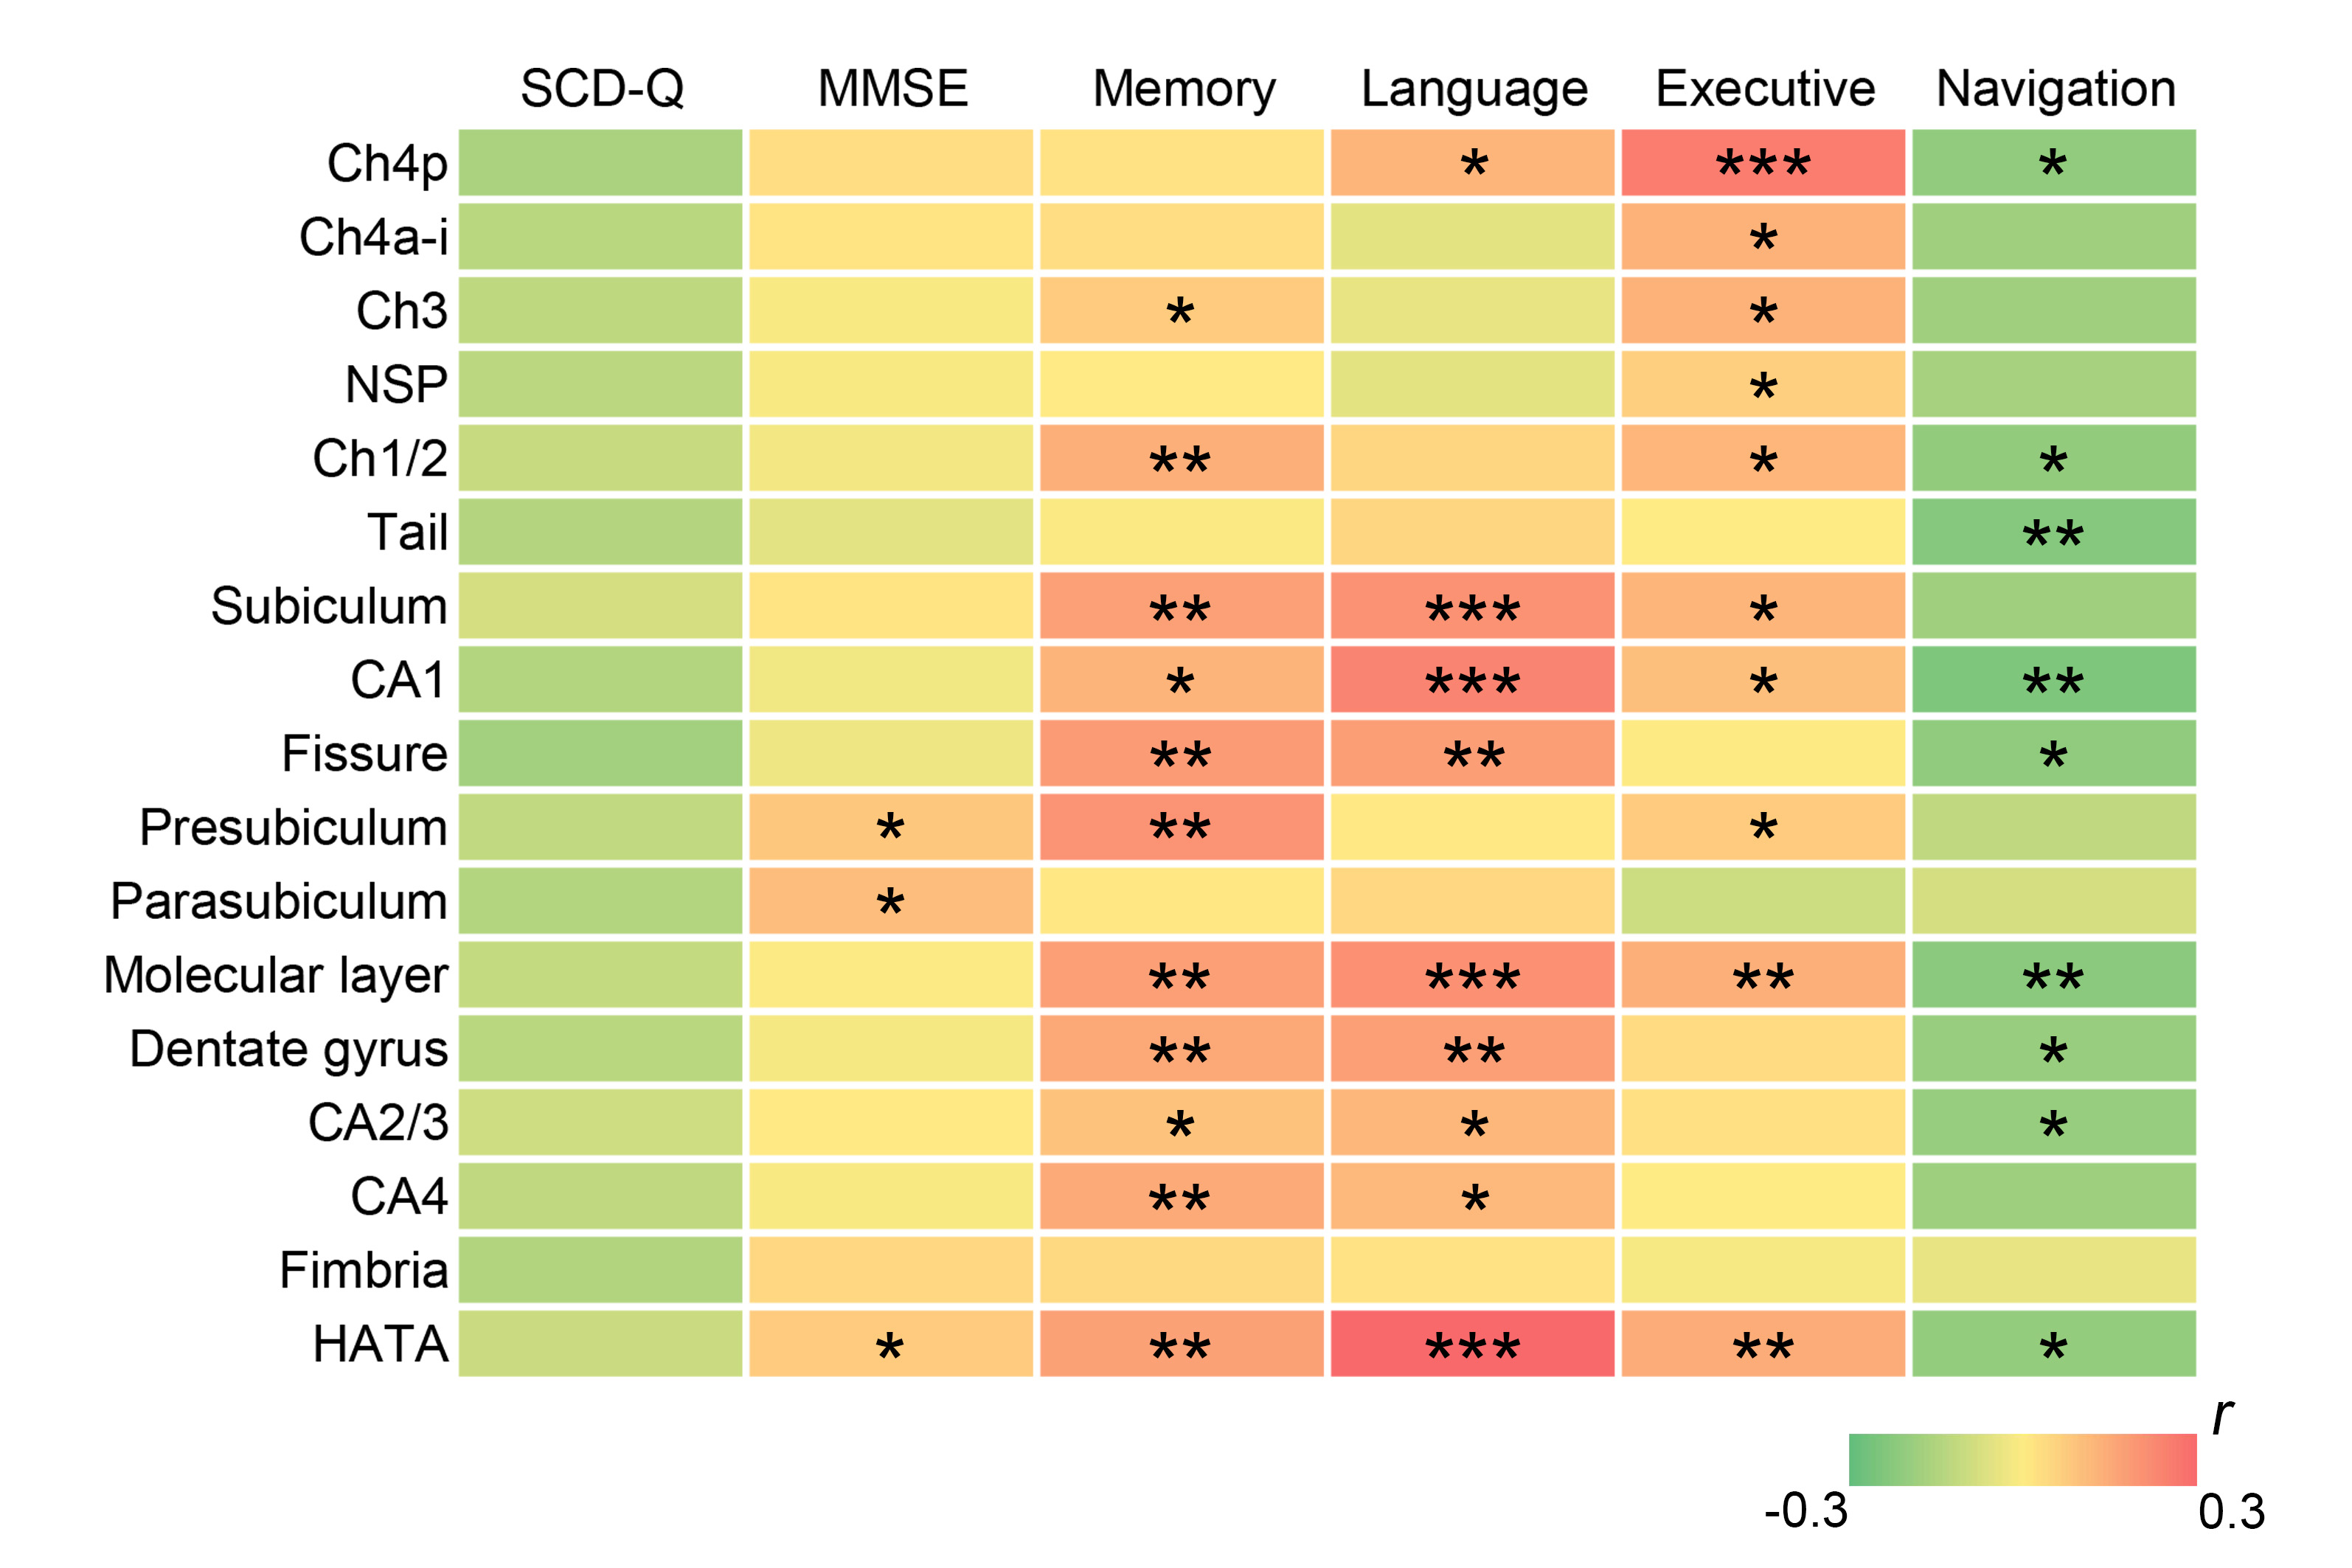
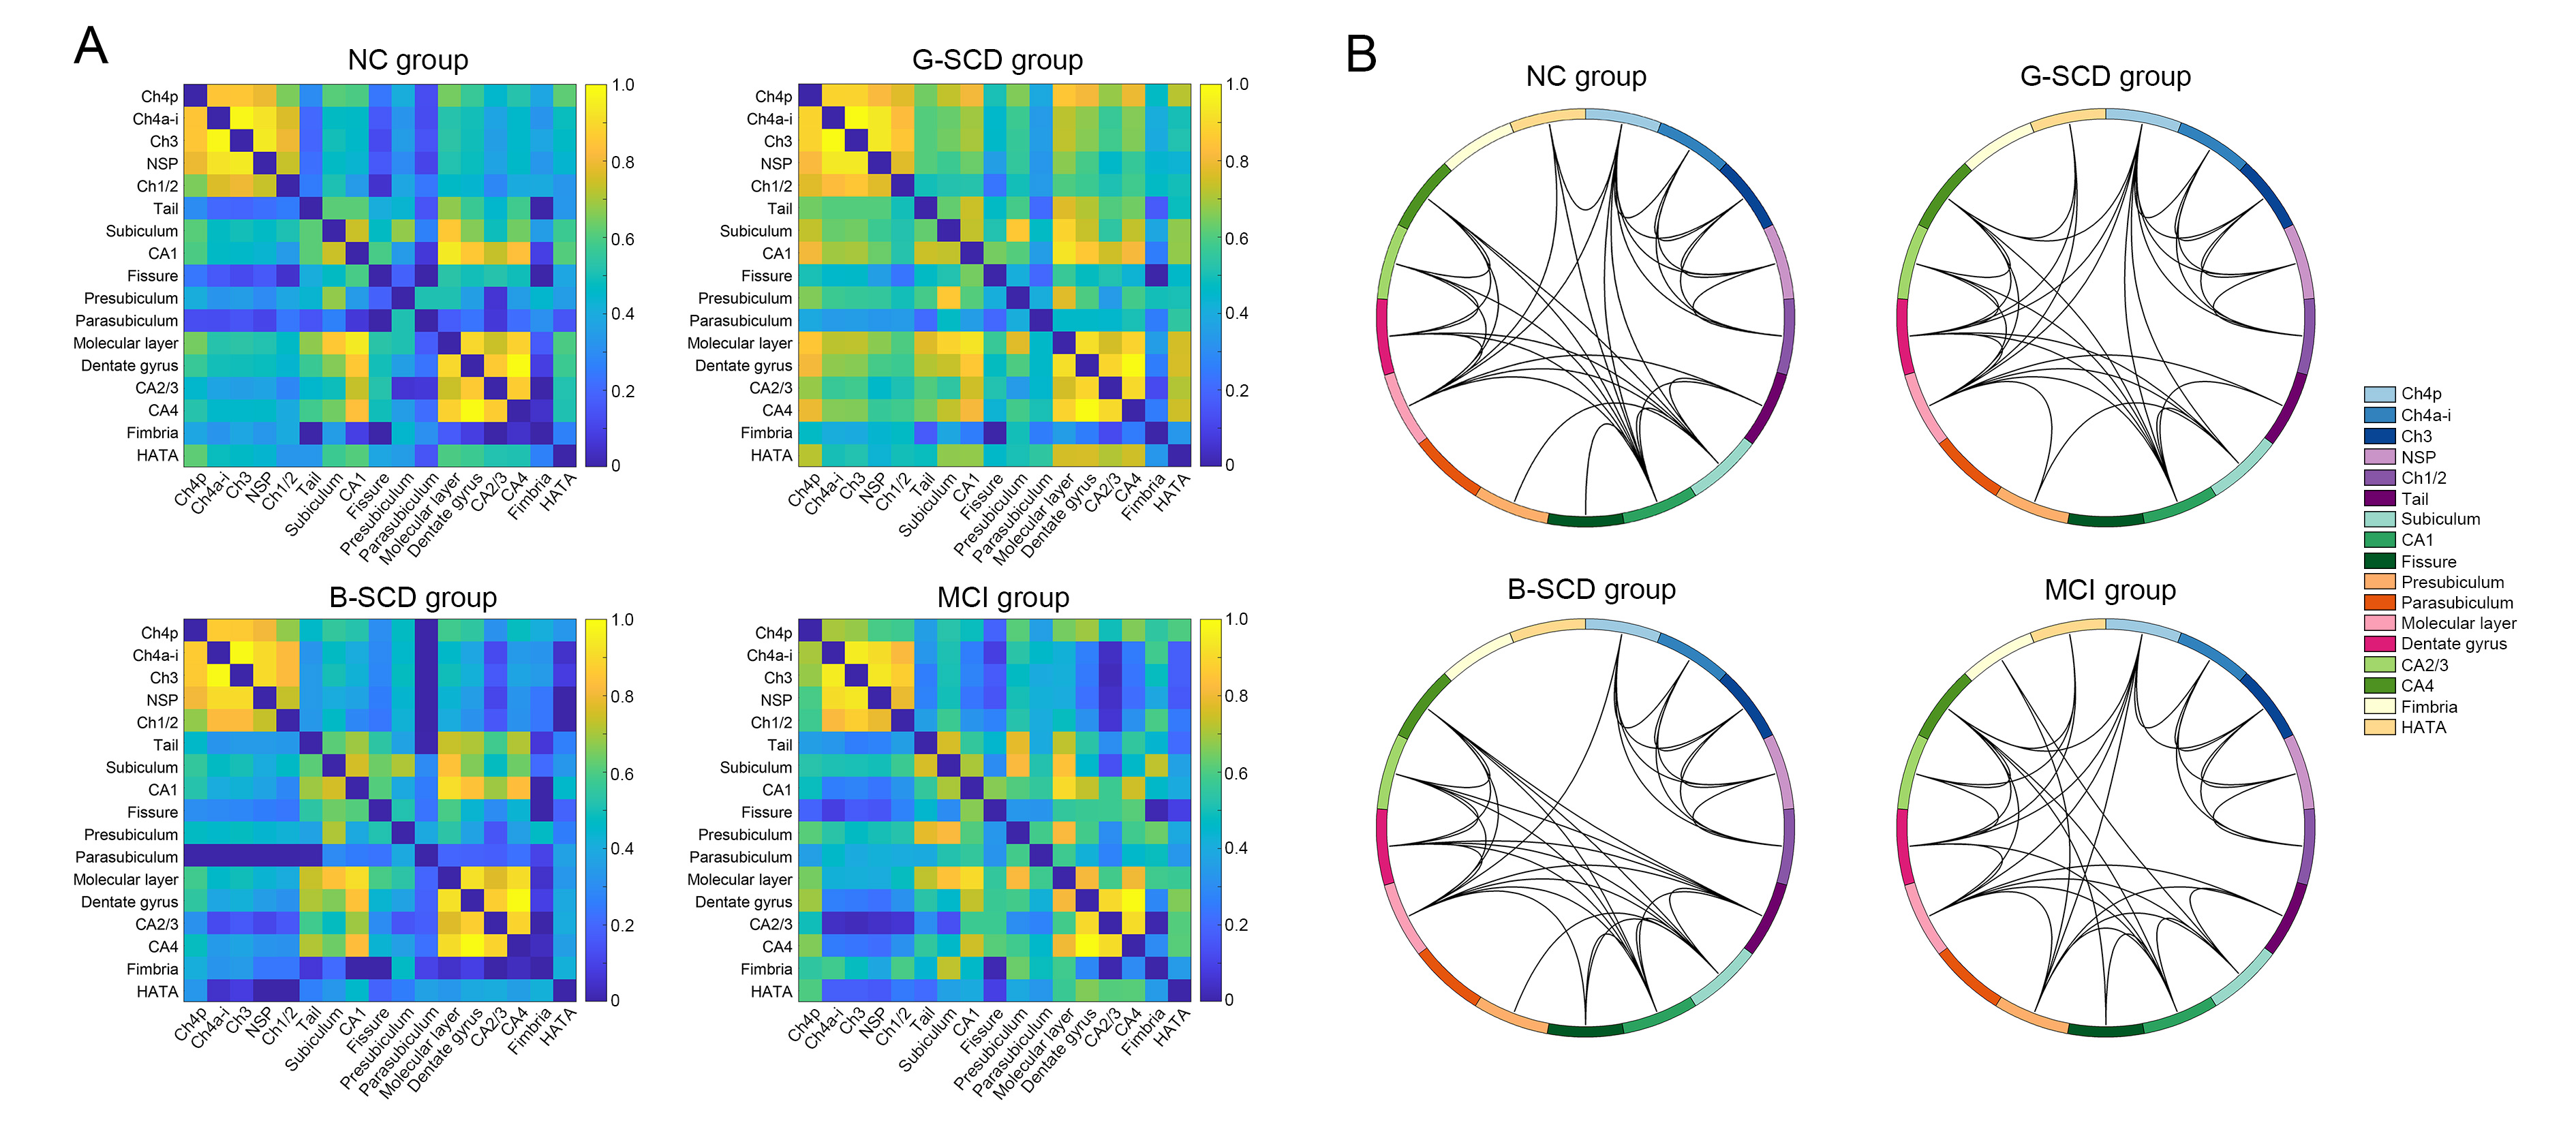
Significant differences in the volumes of the basal forebrain and the right hippocampus were observed among the four groups. More specifically, the B-SCD and MCI groups showed decreased volumes in the basal forebrain than the NC and G-SCD groups. The MCI group showed significantly atrophied right hippocampus than the other three groups. Subfield analyses of the basal forebrain and the right hippocampus suggested that the B-SCD group showed decreased volumes in the Ch4p and Ch4a-i subregions than the NC and G-SCD groups, and the MCI group showed decreased volumes in all the subregions of the basal forebrain. As for the right hippocampus, the MCI group showed atrophied subregions of the subiculum, CA1, presubiculum, molecular layer, dentate gyrus, CA4, and HATA. Subfield volumes of the basal forebrain and the right hippocampus showed significant associations with cognitive measures. Greater volumes in the Ch4p were associated with greater language (r = 0.186, p = 0.014), executive (r = 0.271, p < 0.001), and navigation function (r = -0.180, p = 0.017). Greater volumes in the Ch4a-i were associated with great performance on the executive tests (r = 0.192, p = 0.011). Furthermore, structural covariance network of basal forebrain and right hippocampal subfields showed that the B-SCD group had a larger Lp and a larger lambda than the G-SCD group. Follow-up data revealed that the B-SCD group had a significantly higher conversion rate to MCI than the G-SCD group.Discussion
It has been well-established by histopathological studies that AD is associated with the loss of cholinergic neurons and the basal forebrain is a key structure for cholinergic input to the hippocampus, amygdala, and cerebral cortex6. Previous studies have shown significant volume reductions of the basal forebrain in SCD, MCI and AD patients7-9. In accordance with previous studies, the B-SCD group and MCI group in this study showed decreased volumes in the basal forebrain, suggesting that the B-SCD group had a similar atrophy pattern to the MCI group in the basal forebrain, while this was not observed in the G-SCD group. No significant volume reduction in the hippocampus was observed in the B-SCD group, suggesting that volume reduction in the basal forebrain may be a more sensitive structural indicator than hippocampal atrophy in the preclinical AD stage. Subfield analyses showed that the B-SCD group mainly showed an atrophy in the Ch4 subfield. The Ch4 subregion projects to the medial frontal, cingulate, retrosplenial, and visual cortices10. Ch4p atrophy may lead to disrupted cholinergic projections to the medial frontal cortex and retrosplenial cortex, and subsequent cognitive and spatial navigation deficits. Structural covariance network was reorganized and a larger Lp was shown in the B-SCD group than the G-SCD group, suggesting a disrupted structural covariance of basal forebrain and hippocampal subfields. Follow-up data revealed that the B-SCD group had a significantly higher conversion rate to MCI than the G-SCD group, indicating that spatial navigation may have great potential in the investigation of SCD heterogeneity and the identification of SCD subjects at higher risk of clinical progression from the whole SCD entity.Conclusion
Compared to SCD subjects with good spatial navigation performance, SCD subjects with bad performance showed decreased volumes in the basal forebrain, reorganized structural covariance network of subcortical nuclei, and an increased risk of progression to MCI. This study may provide new insights for the risk assessment and early intervention for SCD subjects.Acknowledgements
This work was supported by the National Science and Technology Innovation 2030 -- Major program of "Brain Science and Brain-Like Research" (2022ZD0211800); the National Natural Science Foundation of China (81720108022, 81971596, 82001793); the Key Scientific Research Project of Jiangsu Health Committee (K2019025); the Industry and Information Technology Department of Nanjing (SE179-2021); the Educational Research Project of Nanjing Medical University (2019ZC036); the Project of Nanjing Health Science and Technology Development (YKK19055); and funding for Clinical Trials from the Affiliated Drum Tower Hospital, Medical School of Nanjing University.References
1. Jessen F, Amariglio RE, Buckley RF, et al. The characterisation of subjective cognitive decline. Lancet Neurol. 2020;19(3):271-278.
2. Sheng C, Yang K, He B, et al. Cross-Cultural Longitudinal Study on Cognitive Decline (CLoCODE) for Subjective Cognitive Decline in China and Germany: A Protocol for Study Design. J Alzheimers Dis. 2022;87(3):1319-1333.
3. Levine TF, Allison SL, Stojanovic M, et al. Spatial navigation ability predicts progression of dementia symptomatology. Alzheimers Dement. 2020;16(3):491-500.
4. Verghese J, Lipton R, Ayers E. Spatial navigation and risk of cognitive impairment: A prospective cohort study. Alzheimers Dement. 2017;13(9):985-992.
5. Wolf D, Grothe M, Fischer FU, et al. Association of basal forebrain volumes and cognition in normal aging. Neuropsychologia. 2014;53:54-63.
6. McGeer PL, McGeer EG, Suzuki J, et al. Aging, Alzheimer's disease, and the cholinergic system of the basal forebrain. Neurology. 1984;34(6):741-745.
7. Grothe M, Heinsen H, Teipel S. Longitudinal measures of cholinergic forebrain atrophy in the transition from healthy aging to Alzheimer's disease. Neurobiol Aging. 2013;34(4):1210-1220.
8. Teipel SJ, Meindl T, Grinberg L, et al. The cholinergic system in mild cognitive impairment and Alzheimer's disease: an in vivo MRI and DTI study. Hum Brain Mapp. 2011;32(9):1349-1362.
9. Scheef L, Grothe MJ, Koppara A, et al. Subregional volume reduction of the cholinergic forebrain in subjective cognitive decline (SCD). Neuroimage Clin. 2019;21:101612.
10. Solari N, Hangya B. Cholinergic modulation of spatial learning, memory and navigation. Eur J Neurosci. 2018;48(5):2199-2230.
Figures