3039
Comparison of diffusion kurtosis tensor imaging and multi-tissue CSD for the investigation of group differences in Alzheimer’s disease
Diana L. Giraldo1,2,3, Robert E. Smith4, Hanne Struyfs5, Ellis Niemantsverdriet5, Ellen De Roeck5, Sebastiaan Engelborghs5, Eduardo Romero2, Jan Sijbers1,3, and Ben Jeurissen1,3,6
1imec-Vision Lab, University of Antwerp, Antwerp, Belgium, 2Computer Imaging and Medical Applications Laboratory - Cim@Lab, Universidad Nacional de Colombia, Bogota, Colombia, 3µNEURO Research Center of Excellence, University of Antwerp, Antwerp, Belgium, 4The Florey Institute of Neuroscience and Mental Health, Melbourne, Australia, 5Reference Center for Biological Markers of Dementia (BIODEM), University of Antwerp, Antwerp, Belgium, 6Lab for Equilibrium Investigations and Aerospace, University of Antwerp, Antwerp, Belgium
1imec-Vision Lab, University of Antwerp, Antwerp, Belgium, 2Computer Imaging and Medical Applications Laboratory - Cim@Lab, Universidad Nacional de Colombia, Bogota, Colombia, 3µNEURO Research Center of Excellence, University of Antwerp, Antwerp, Belgium, 4The Florey Institute of Neuroscience and Mental Health, Melbourne, Australia, 5Reference Center for Biological Markers of Dementia (BIODEM), University of Antwerp, Antwerp, Belgium, 6Lab for Equilibrium Investigations and Aerospace, University of Antwerp, Antwerp, Belgium
Synopsis
Keywords: Alzheimer's Disease, Data Analysis
In this work, we compare the results of analyzing group differences in Alzheimer’s Disease (AD) with two different models for multi-shell diffusion MRI: the Diffusion Kurtosis Tensor (DKT) and Multi-Tissue Constrained Spherical Deconvolution (MT-CSD). Separate analysis for DKT metrics and measures derived from MT-CSD were performed to investigate differences between control subjects and patients with mild cognitive impairment and dementia due to AD. Statistical analyses included strong family-wise error correction for multiple comparisons. Results indicate that analyses with MT-CSD capture the differences that are detectable with DKT while offering more specific details that facilitate the interpretation of those differences.Introduction
Multi-shell diffusion MRI data is becoming common in neurodegeneration research. To date, one of the most widely used analysis methods for multi-shell data consists of examining metrics from the diffusion kurtosis tensor (DKT) model1,2. DKT3 is a higher-order extension of the diffusion tensor model that can capture the non-monoexponential signal decay typically observed at higher b-values and its derived metrics can serve as sensitive biomarkers. Being a signal representation model, however, its metrics are non-specific, making them difficult to interpret, in particular in the presence of macroscopic changes (e.g. atrophy), partial volume effects (e.g. with CSF), or multiple fiber populations. As an alternative, multi-compartment and multi-fiber approaches paired with voxel- and fixel-based analysis can potentially be more sensitive to neurodegeneration and provide more specific information about its nature. In this work, we compare the results of voxel-based analysis of DKT metrics to voxel- and fixel-based analysis4 of multi-tissue constrained spherical deconvolution5 (MT-CSD) in a study on Alzheimer’s disease (AD).Methods
Acquisition: Patients with mild cognitive impairment due to AD (n =29, referred to as MCI) and dementia due to AD (n = 23, referred to as ADD) as well as cognitively healthy controls (n=27) were included. Data were acquired on a 3T MRI scanner using a multi-slice, single-shot EPI, spin-echo imaging sequence. Diffusion weightings of b = 0, 700, 1000, and 2800 s/mm2 were applied in 10, 25, 40, and 75 directions, respectively. Preprocessing: Denoising6, Gibbs ringing suppression7, head motion and eddy current-induced distortion correction8, and bias field correction9 were performed using MRtrix310, FSL8, and ANTs9. Modeling: DKT parameters were estimated using an iterative weighted linear least squares estimator with constraints11,12. From this, fractional anisotropy (FA), mean diffusivity (MD), and mean kurtosis (MK) were obtained. Tissue-like fractions of CSF, GM, and WM as well as the WM fiber orientation density function (fODF) were obtained using MT-CSD5. Spatial normalization and statistical analysis: All parameter maps were warped to a study-specific template. Jacobian determinant and fiber cross-section4 were included in the set of MT-CSD measures. Group differences were investigated using a General Linear Model including age, gender, and intracranial volume as covariates. Non-parametric hypothesis testing was done with random permutations including family-wise error (FWE) correction13,14. Analyses were performed separately for each model (DKT vs MT-CSD) and involved two steps: first, an omnibus F-test was employed to detect any group effect in any of the investigated measures; then, post hoc t-tests were used to identify pairwise group differences for each measure within regions deemed significant in the F-test by calculating p-values with strong FWE control for multiple comparisons14. For MT-CSD, the analysis was further split into separate voxel- and fixel-based analyses.Results
According to results of omnibus F-tests (Figure 1), areas with significant group effects in DKT measures also show significant group effects in MT-CSD measures. Reduced FA (blue channel in Figure 2) in the fornix and tapetum of the corpus callosum was detected for MCI and ADD compared to controls, possibly related to ventricle expansion. In ADD, reduced FA extends to the hippocampal area, the anterior part of the superior longitudinal fasciculus, and the intersection between the cingulum bundle and the corticospinal tract. Group differences in these areas are also captured by fiber-specific measures (Figure 3), tissue-like composition (Figure 4), and local volumetric changes (Figure 5), all derived from MT-CSD. However, FA does not capture differences in areas where reductions in fiber cross-section and WM-like fraction were detected such as the uncinate and inferior longitudinal fasciculi.Extensive increases in MD (green channel in Figure 2) were detected for both groups of patients, all these areas overlapping with significant differences in tissue-like composition. However, increased MD can coincide with two types of changes: decreased GM-like with increased CSF-like tissue (yellow areas in Figure 4), or increased GM-like with decreased WM-like tissue (cyan areas in Figure 4). Increased MD for ADD compared to MCI was also detected in the superior longitudinal fasciculus and the right temporal lobe (bottom row in Figure 2), being the only DKT metric that exhibits significant differences between MCI and ADD. Some of these differences between disease stages match with significant variations of WM- and GM-like fractions (bottom row in Figure 4). Significant decreases of MK were detected in MCI and ADD compared to controls (red channel in Figure 2), all of those differences co-occur with increased MD or decreased FA, indicating that the use of MK gives little additional information to MD and FA.
Discussion
Group differences detected with DKT measures can be detected with measures derived from MT-CSD. However, the latter group of measures provides information that facilitates the interpretation of those differences. For instance, analysis of tissue-like composition derived from MT-CSD allows us to distinguish whether increased MD corresponds to increased free-water content (increased CSF-like tissue) or increased cellularity (increased GM-like tissue). Results in this cohort suggest FA sensitivity is limited compared to fiber-specific measures and WM-like fraction.Conclusion
The extent of group differences that are detected with MT-CSD measures is comparable to the extent of differences detected with DKT analysis. However, measures derived from MT-CSD offer more specific and interpretable information about the nature of those differences.Acknowledgements
DG received funds from COLCIENCIAS (grant 727).
RS is supported by fellowship funding from the National Imaging Facility (NIF), an Australian Government National Collaborative Research Infrastructure Strategy (NCRIS) capability.
BJ is grateful to the Research Foundation Flanders, Belgium (FWO: 12M3119N).
BJ and JS gratefully acknowledge support from Belgian Science Policy Prodex (Grant ISLRA 2009–1062).
References
- Struyfs H, Van Hecke W, Veraart J, Sijbers J, Slaets S, De Belder M, Wuyts L, Peters B, Sleegers K, Robberecht C, et al. (2015) Diffusion Kurtosis Imaging: A Possible MRI Biomarker for AD Diagnosis? J Alzheimers Dis 48, 937–948.
- Nir, T. M., Thomopoulos, S. I., Villalon-Reina, J. E., Zavaliangos-Petropulu, A., Dennis, E. L., Reid, R. I., Bernstein, M. A., Borowski, B., Jack, C. R., Weiner, M. W., Jahanshad, N., & Thompson, P. M. (2019). Multi-Shell Diffusion MRI Measures of Brain Aging: A Preliminary Comparison From ADNI3. In 2019 IEEE 16th International Symposium on Biomedical Imaging (ISBI 2019).
- Jensen, J. H., Helpern, J. A., Ramani, A., Lu, H., & Kaczynski, K. (2005). Diffusional kurtosis imaging: the quantification of non-gaussian water diffusion by means of magnetic resonance imaging. Magnetic resonance in medicine, 53(6), 1432–1440.
- Raffelt DA, Tournier J-D, Smith RE, Vaughan DN, Jackson G, Ridgway GR, Connelly A (2017). Investigating white matter fibre density and morphology using fixel-based analysis. NeuroImage 144, Part A, 58–73.
- Jeurissen B, Tournier J-D, Dhollander T, Connelly A, Sijbers J (2014) Multi-tissue constrained spherical deconvolution for improved analysis of multi-shell diffusion MRI data. NeuroImage 103, 411–426.
- Veraart J, Fieremans E, Novikov DS (2016) Diffusion MRI noise mapping using random matrix theory. Magn Reson Med 76, 1582–1593.
- Kellner E, Dhital B, Kiselev VG, Reisert M (2016) Gibbs-ringing artifact removal based on local subvoxel-shifts. Magn Reson Med 76, 1574–1581.
- Andersson JLR, Graham MS, Zsoldos E, Sotiropoulos SN (2016) Incorporating outlier detection and replacement into a non-parametric framework for movement and distortion correction of diffusion MR images. NeuroImage 141, 556–572.
- Tustison NJ, Avants BB, Cook PA, Zheng Y, Egan A, Yushkevich PA, Gee JC (2010) N4ITK: Improved N3 Bias Correction. IEEE Trans Med Imaging 29, 1310–1320.
- Tournier J-D, Smith R, Raffelt D, Tabbara R, Dhollander T, Pietsch M, Christiaens D, Jeurissen B, Yeh C-H, Connelly A (2019) MRtrix3: A fast, flexible and open software framework for medical image processing and visualisation. NeuroImage 202, 116137.
- Veraart J, Sijbers J, Sunaert S, Leemans A, Jeurissen B (2013) Weighted linear least squares estimation of diffusion MRI parameters: Strengths, limitations, and pitfalls. NeuroImage 81, 335–346.
- Tabesh A, Jensen JH, Ardekani BA, Helpern JA (2011) Estimation of tensors and tensor-derived measures in diffusional kurtosis imaging: Tensors and Tensor-Derived Measures in DKI. Magn Reson Med 65, 823–836.
- Winkler AM, Ridgway GR, Webster MA, Smith SM, Nichols TE (2014) Permutation inference for the general linear model. NeuroImage 92, 381–397.
- Alberton BAV, Nichols TE, Gamba HR, Winkler AM (2020) Multiple testing correction over contrasts for brain imaging. NeuroImage 216, 116760.
Figures
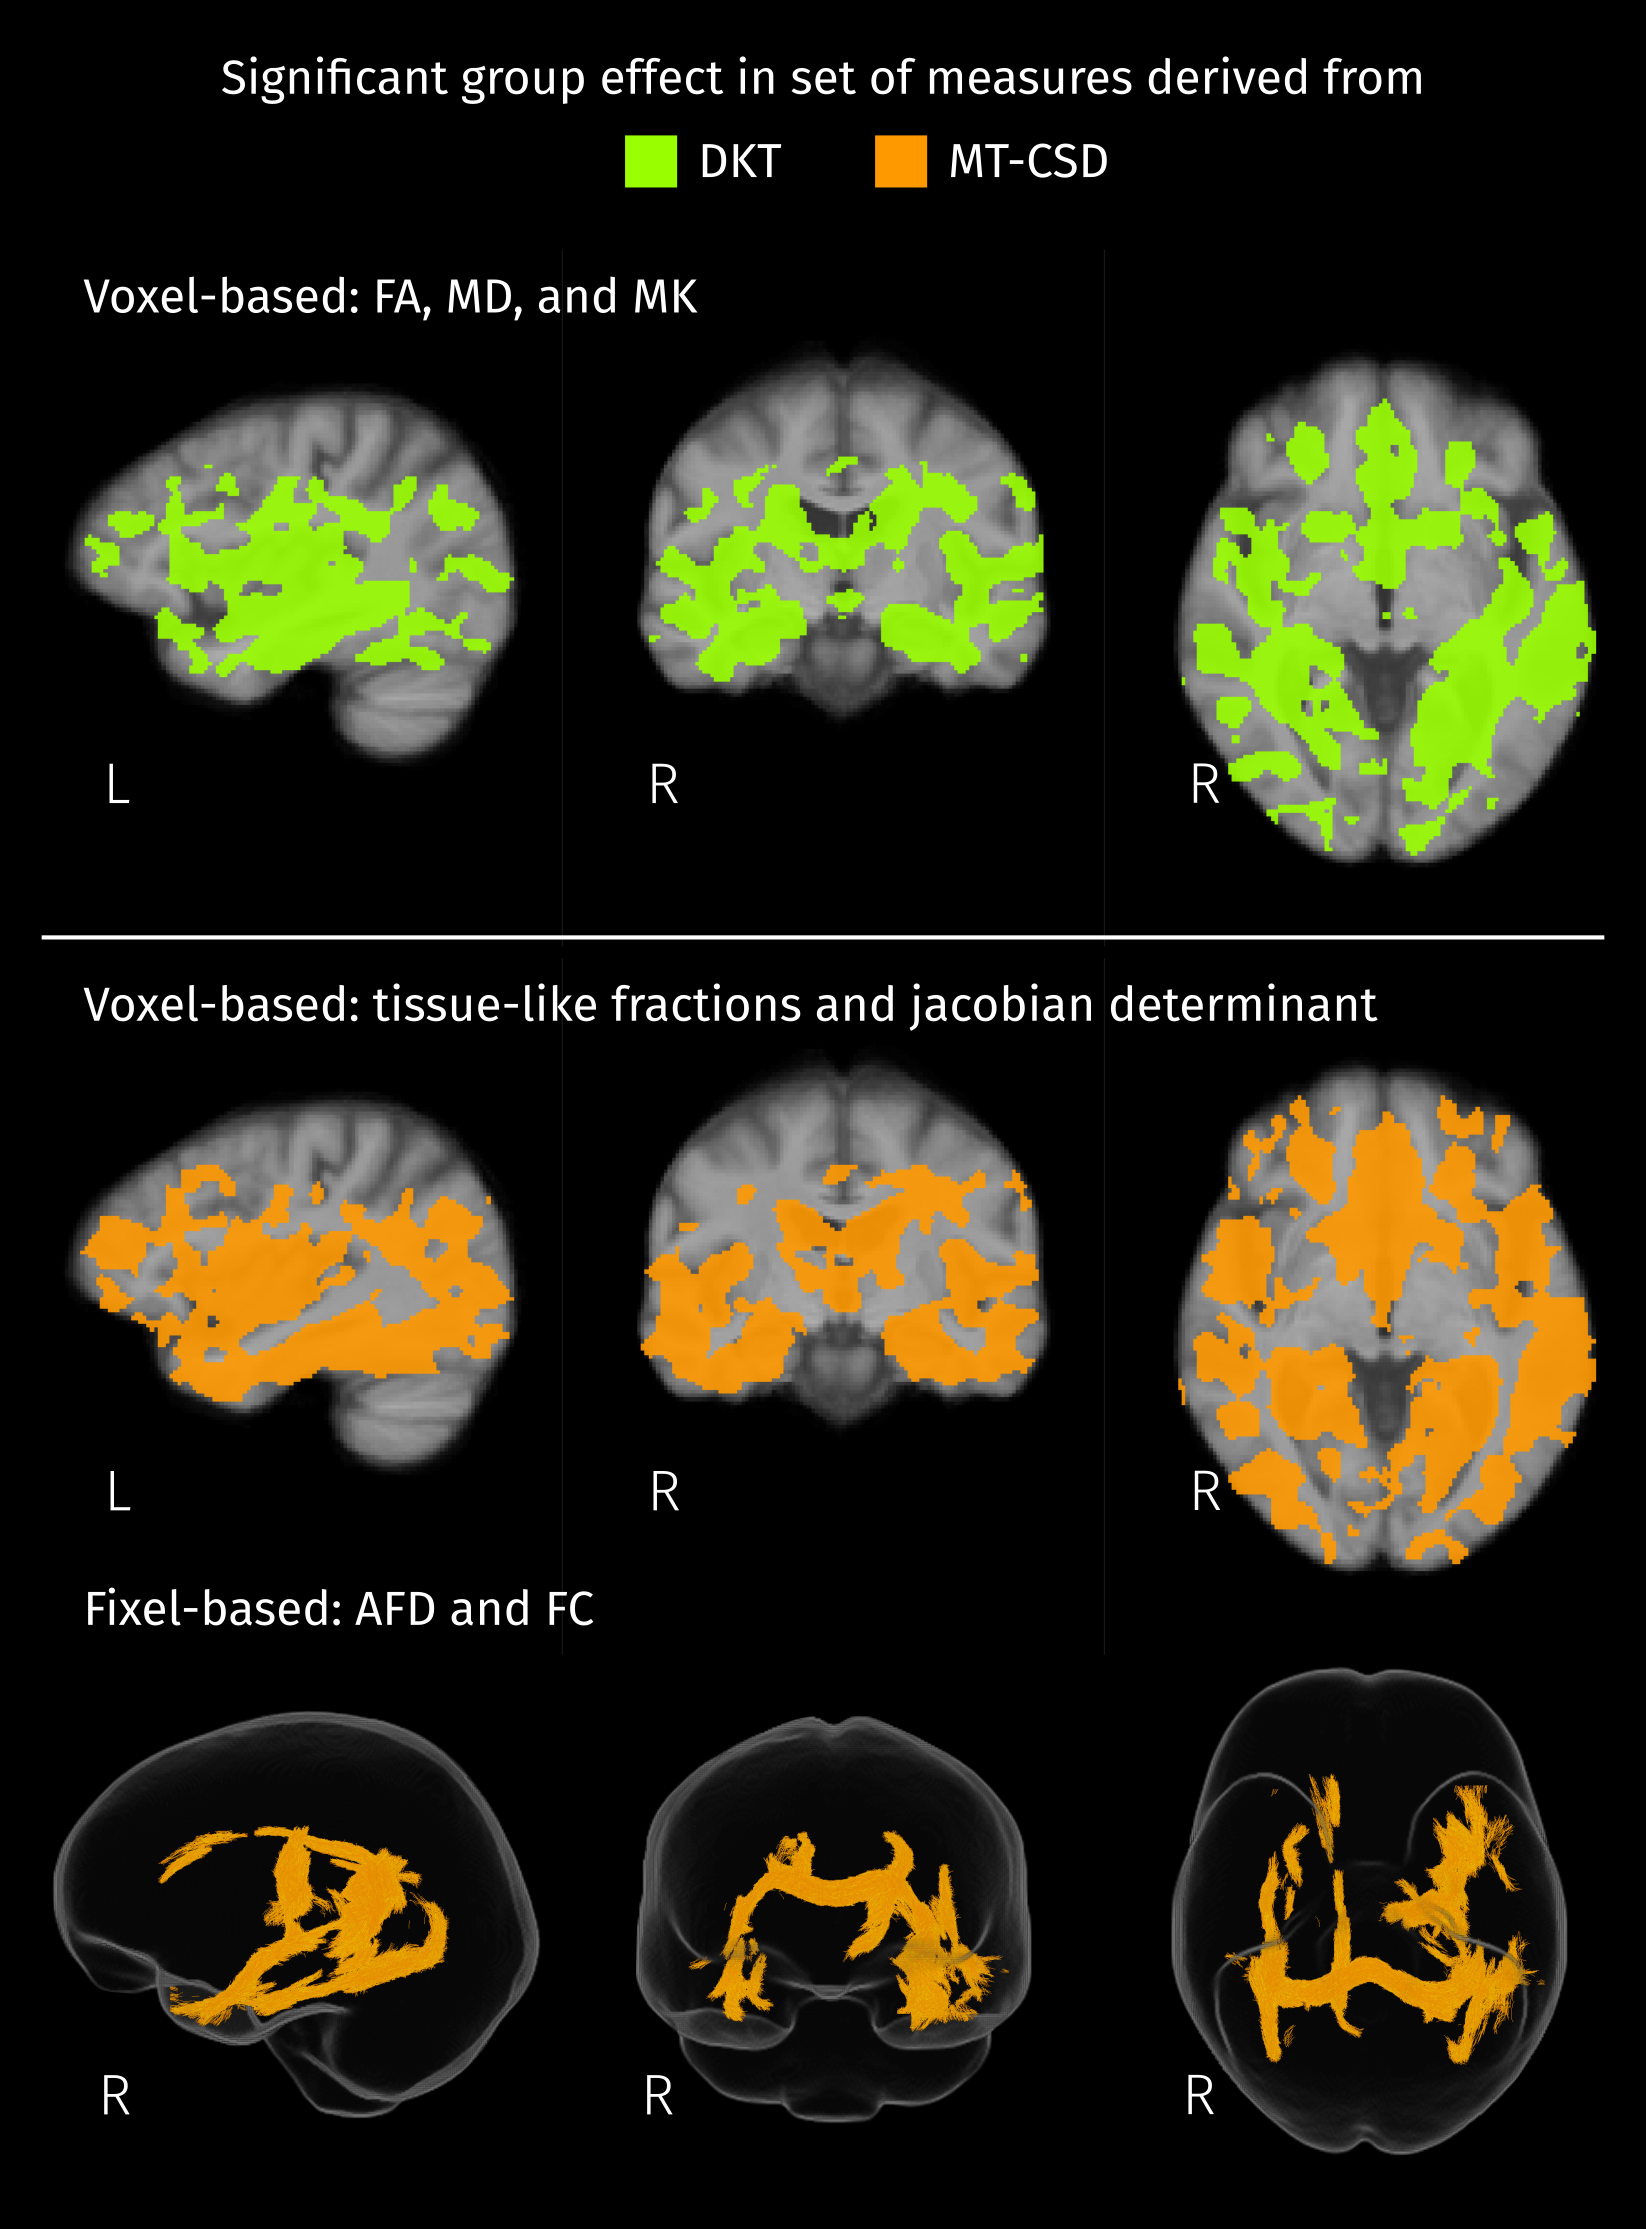
Brain areas where the group has significant effect (FWE-corrected p < 0.05) on any of the measures considered in each set. For the Diffusion Kurtosis Tensor (DKT) all the measures are voxel-based and only one initial F-test was performed. Measures derived from MT-CSD are divided in voxel- and fixel-based, then one F-test per set of measures was performed.
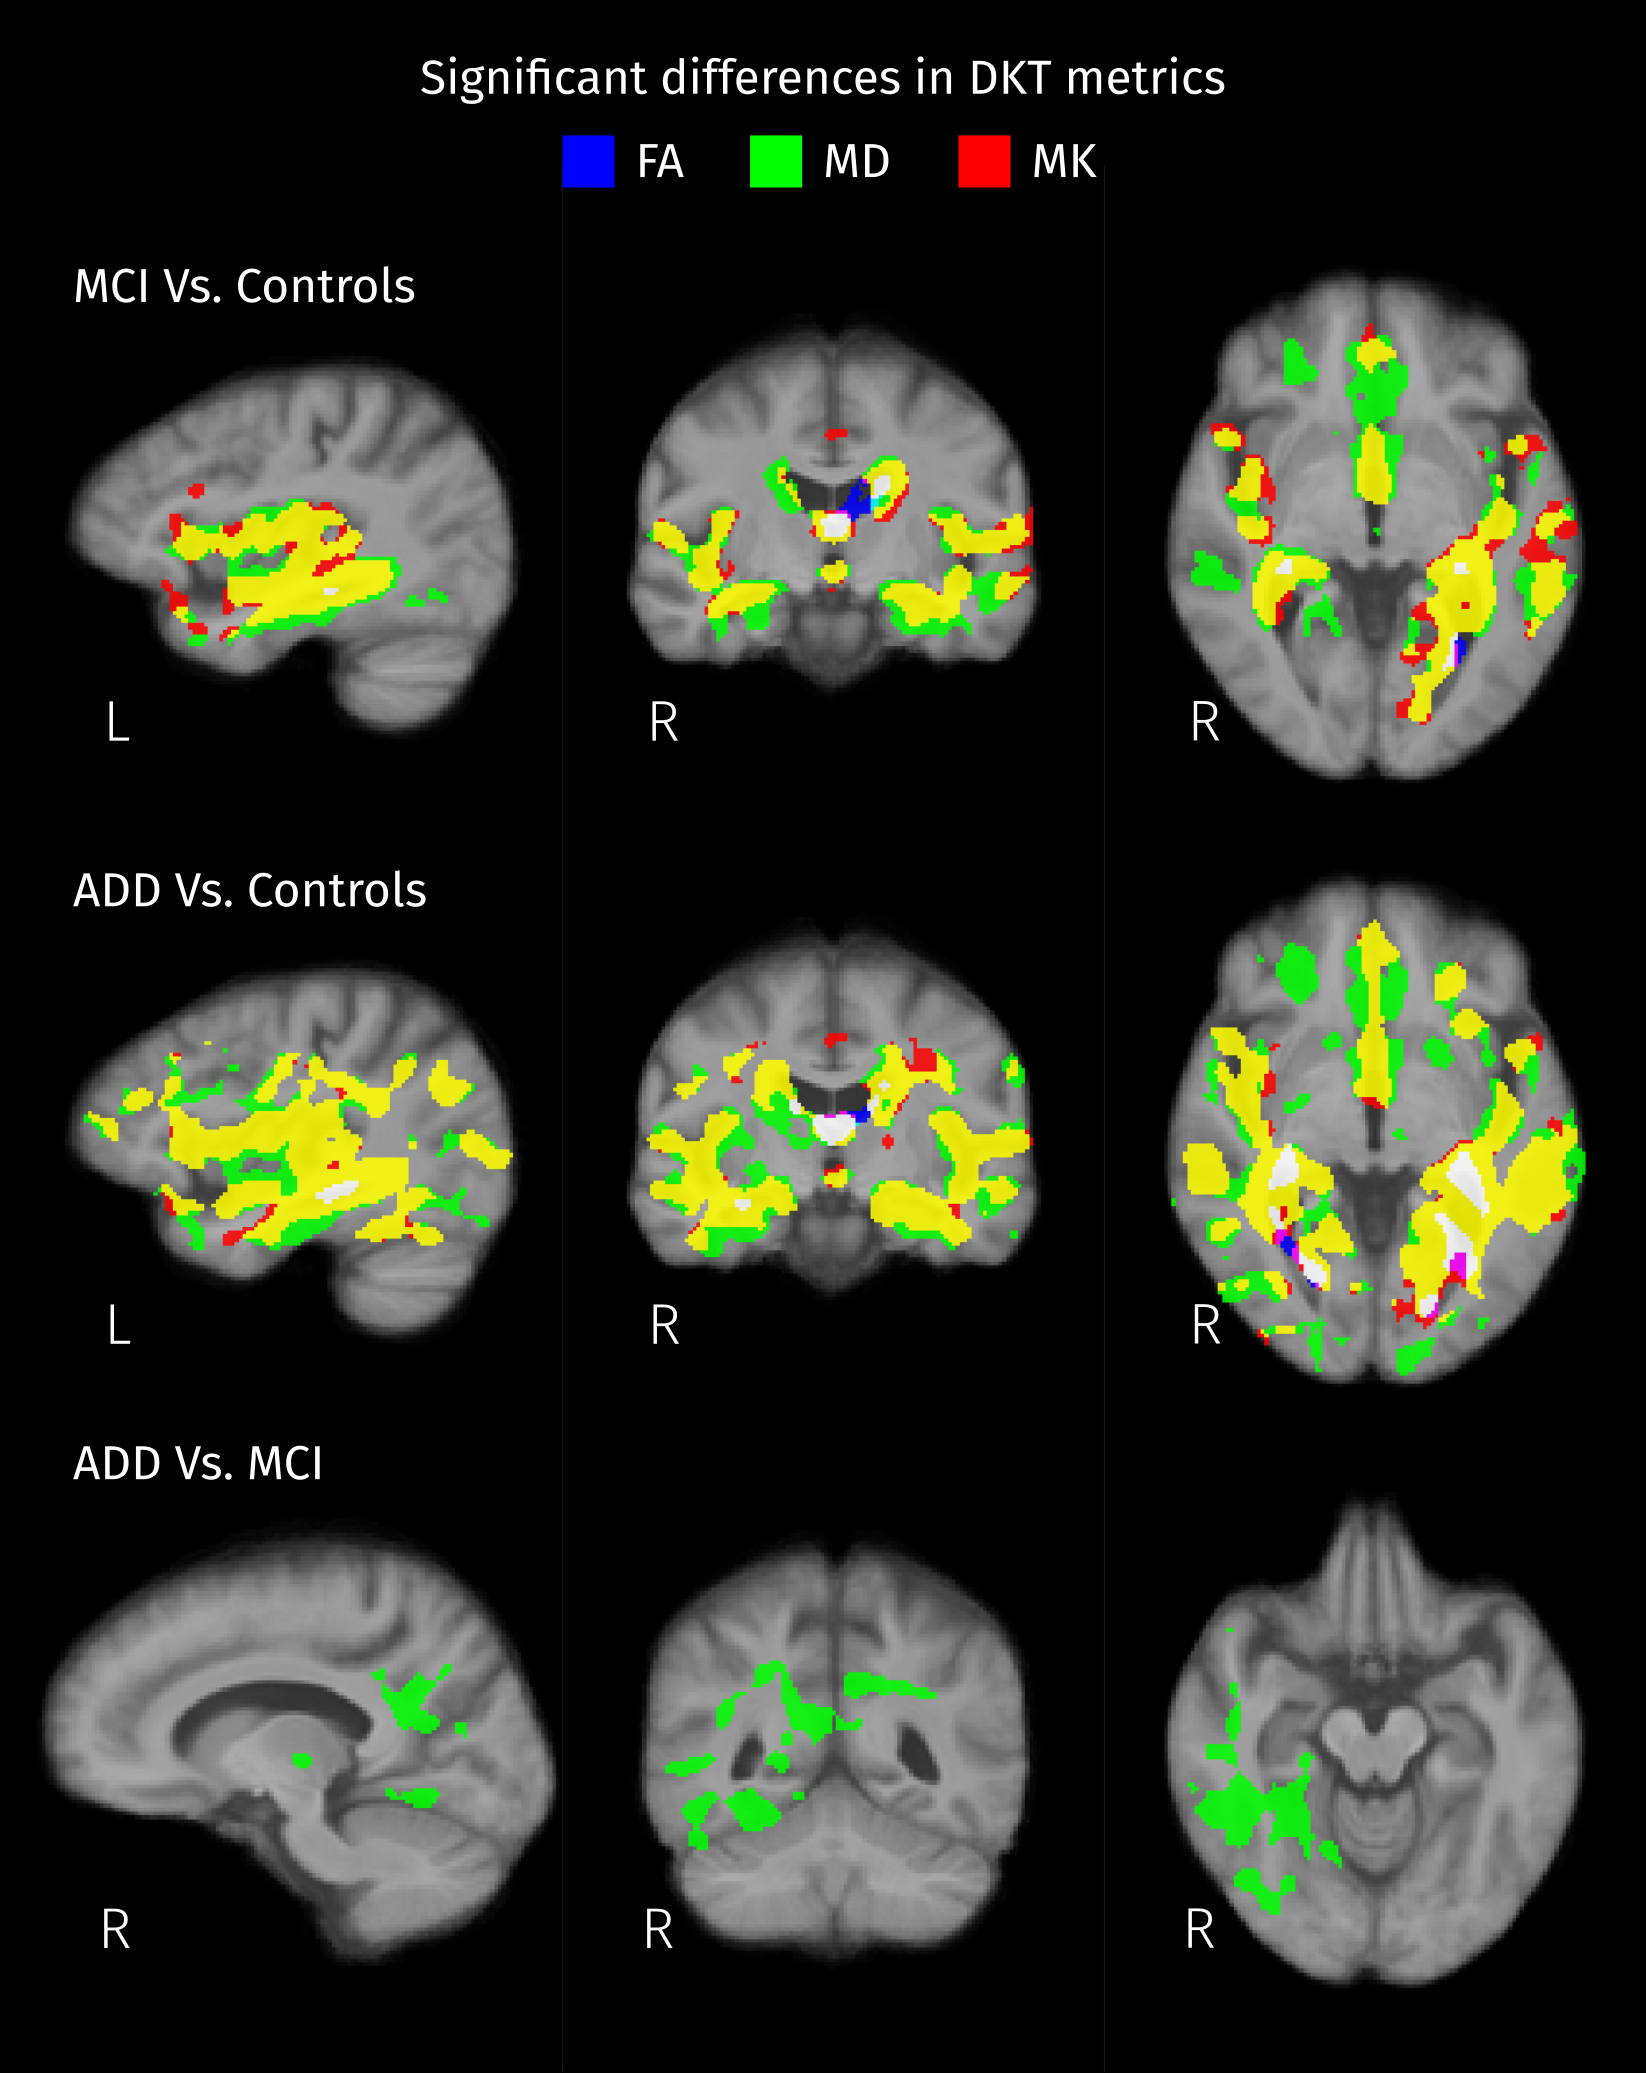
Areas that show significant differences (strong FWE-corrected p < 0.05) of Diffusion Kurtosis Tensor (DKT) metrics between pairs of groups. Each metric is represented by a color channel: blue for decreased Fractional Anisotropy (FA), green for increased Mean Diffusivity (MD), and red for decreased Mean Kurtosis (MK). According to this color-coding, yellow indicates that significant differences in both MD and MK were detected, and white indicates differences in the three metrics.
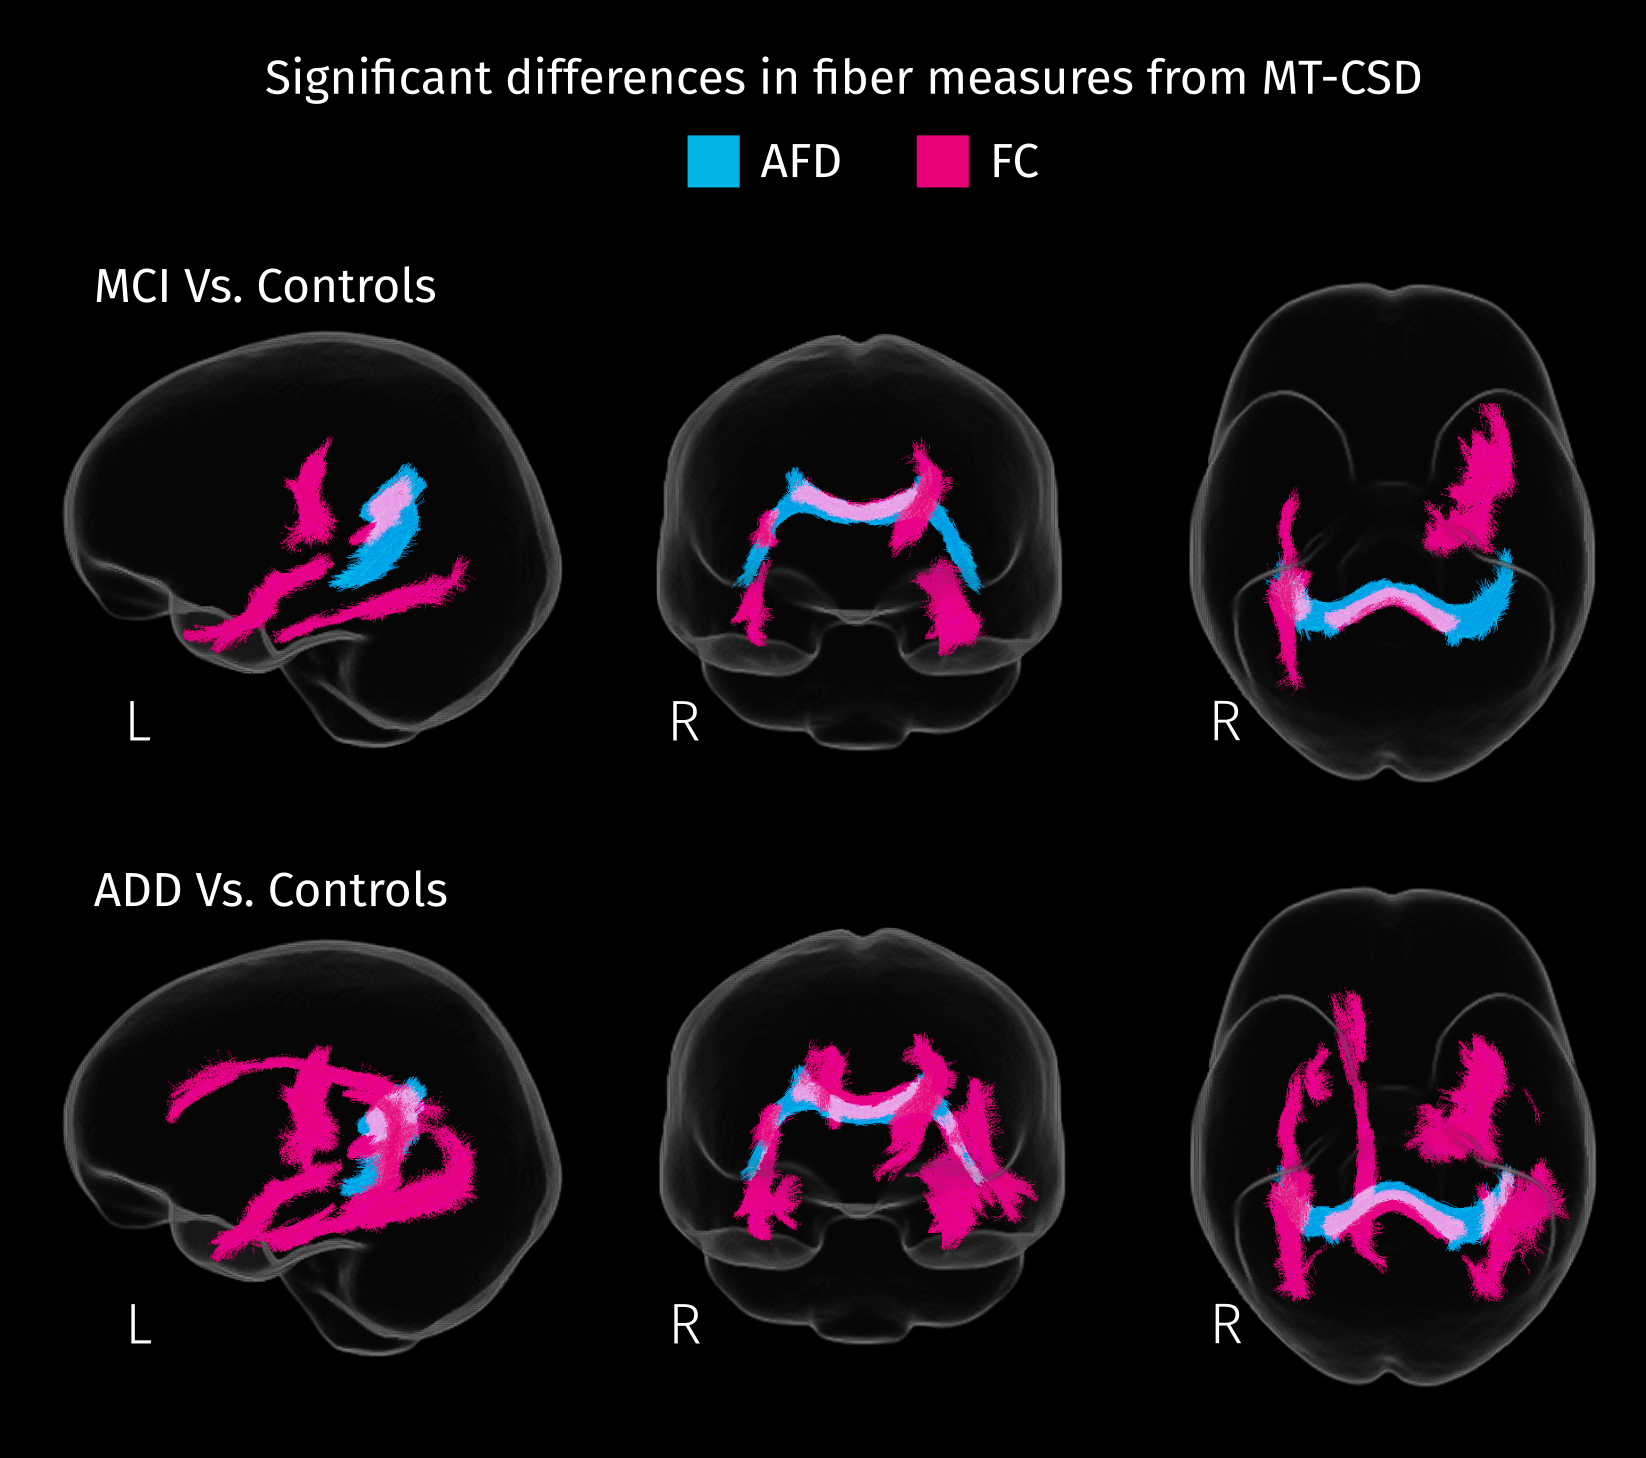
White matter tracts where patients exhibit significant decreases (strong FWE-corrected p < 0.05) in each fiber-specific measure of integrity. Apparent Fiber Density (AFD) and fiber cross-sectional area (FC) were derived from spatially normalized fODF, obtained with MT-CSD.
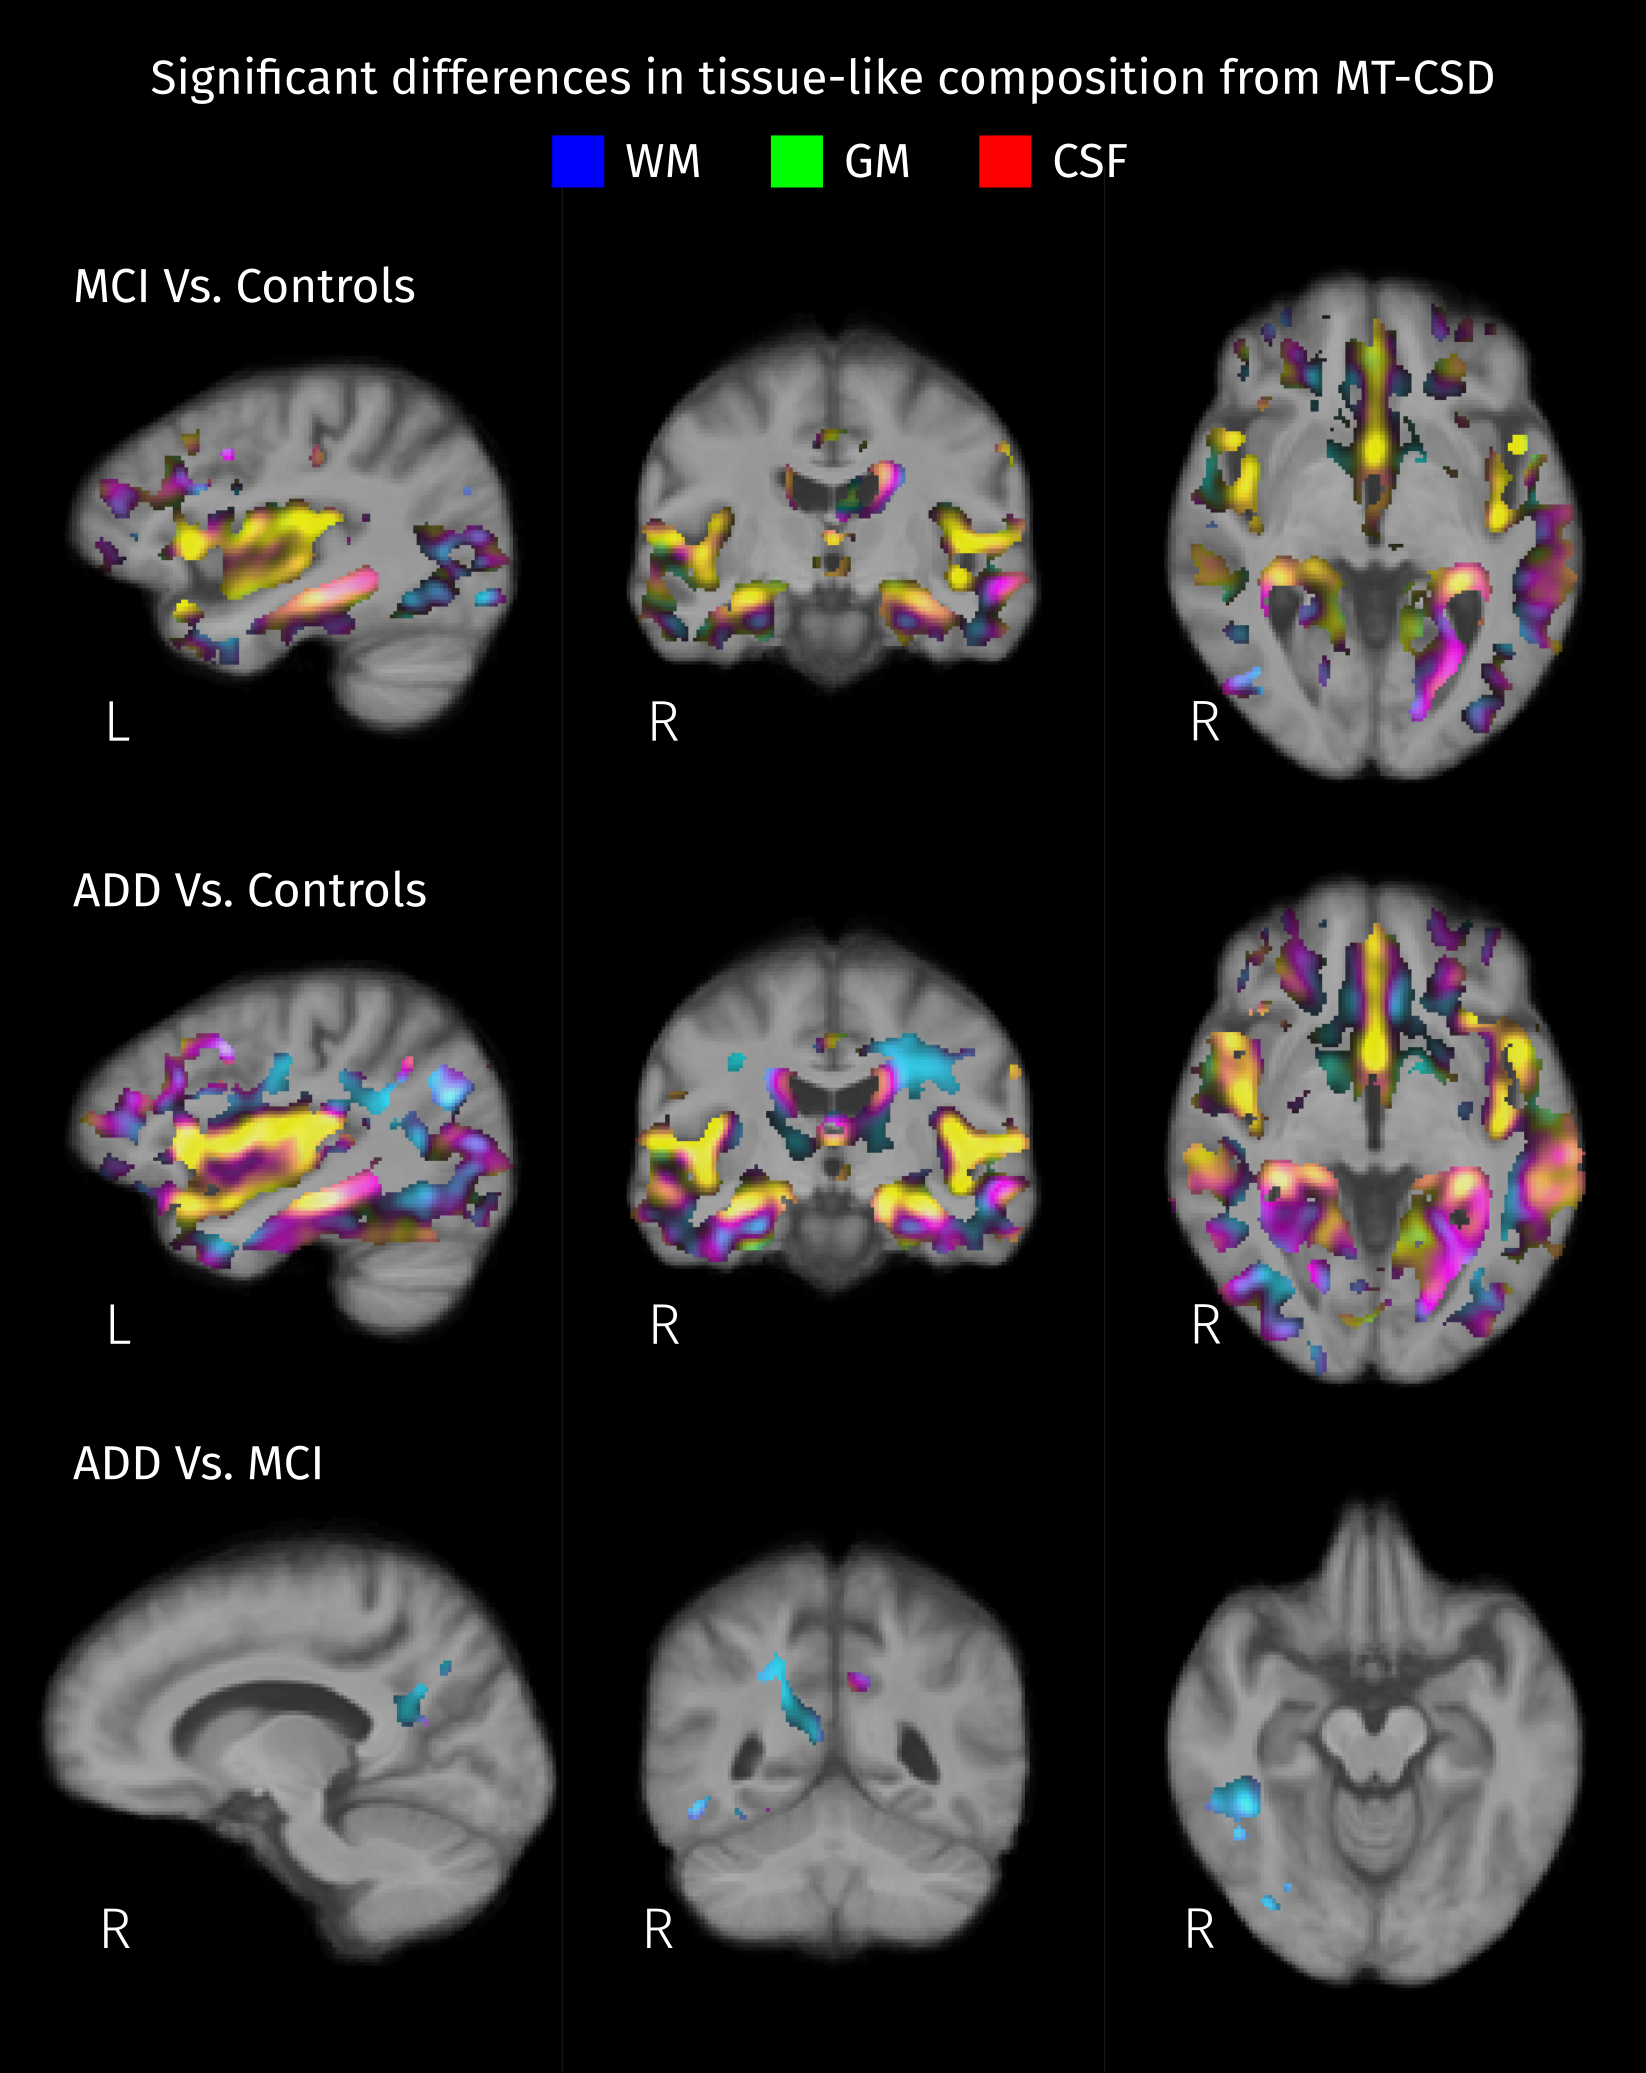
Areas with significant differences (strong FWE-corrected p < 0.05) in the relation between tissue-like fractions between pairs of groups. Absolute mean differences between groups are color-coded: red for CSF, green for gray matter (GM), and blue for white matter (WM). Then, resulting colors correspond to distinct types of changes in tissue-like composition: yellow for differences in GM/CSF, cyan for differences in WM/GM, and magenta for differences in WM/CSF.
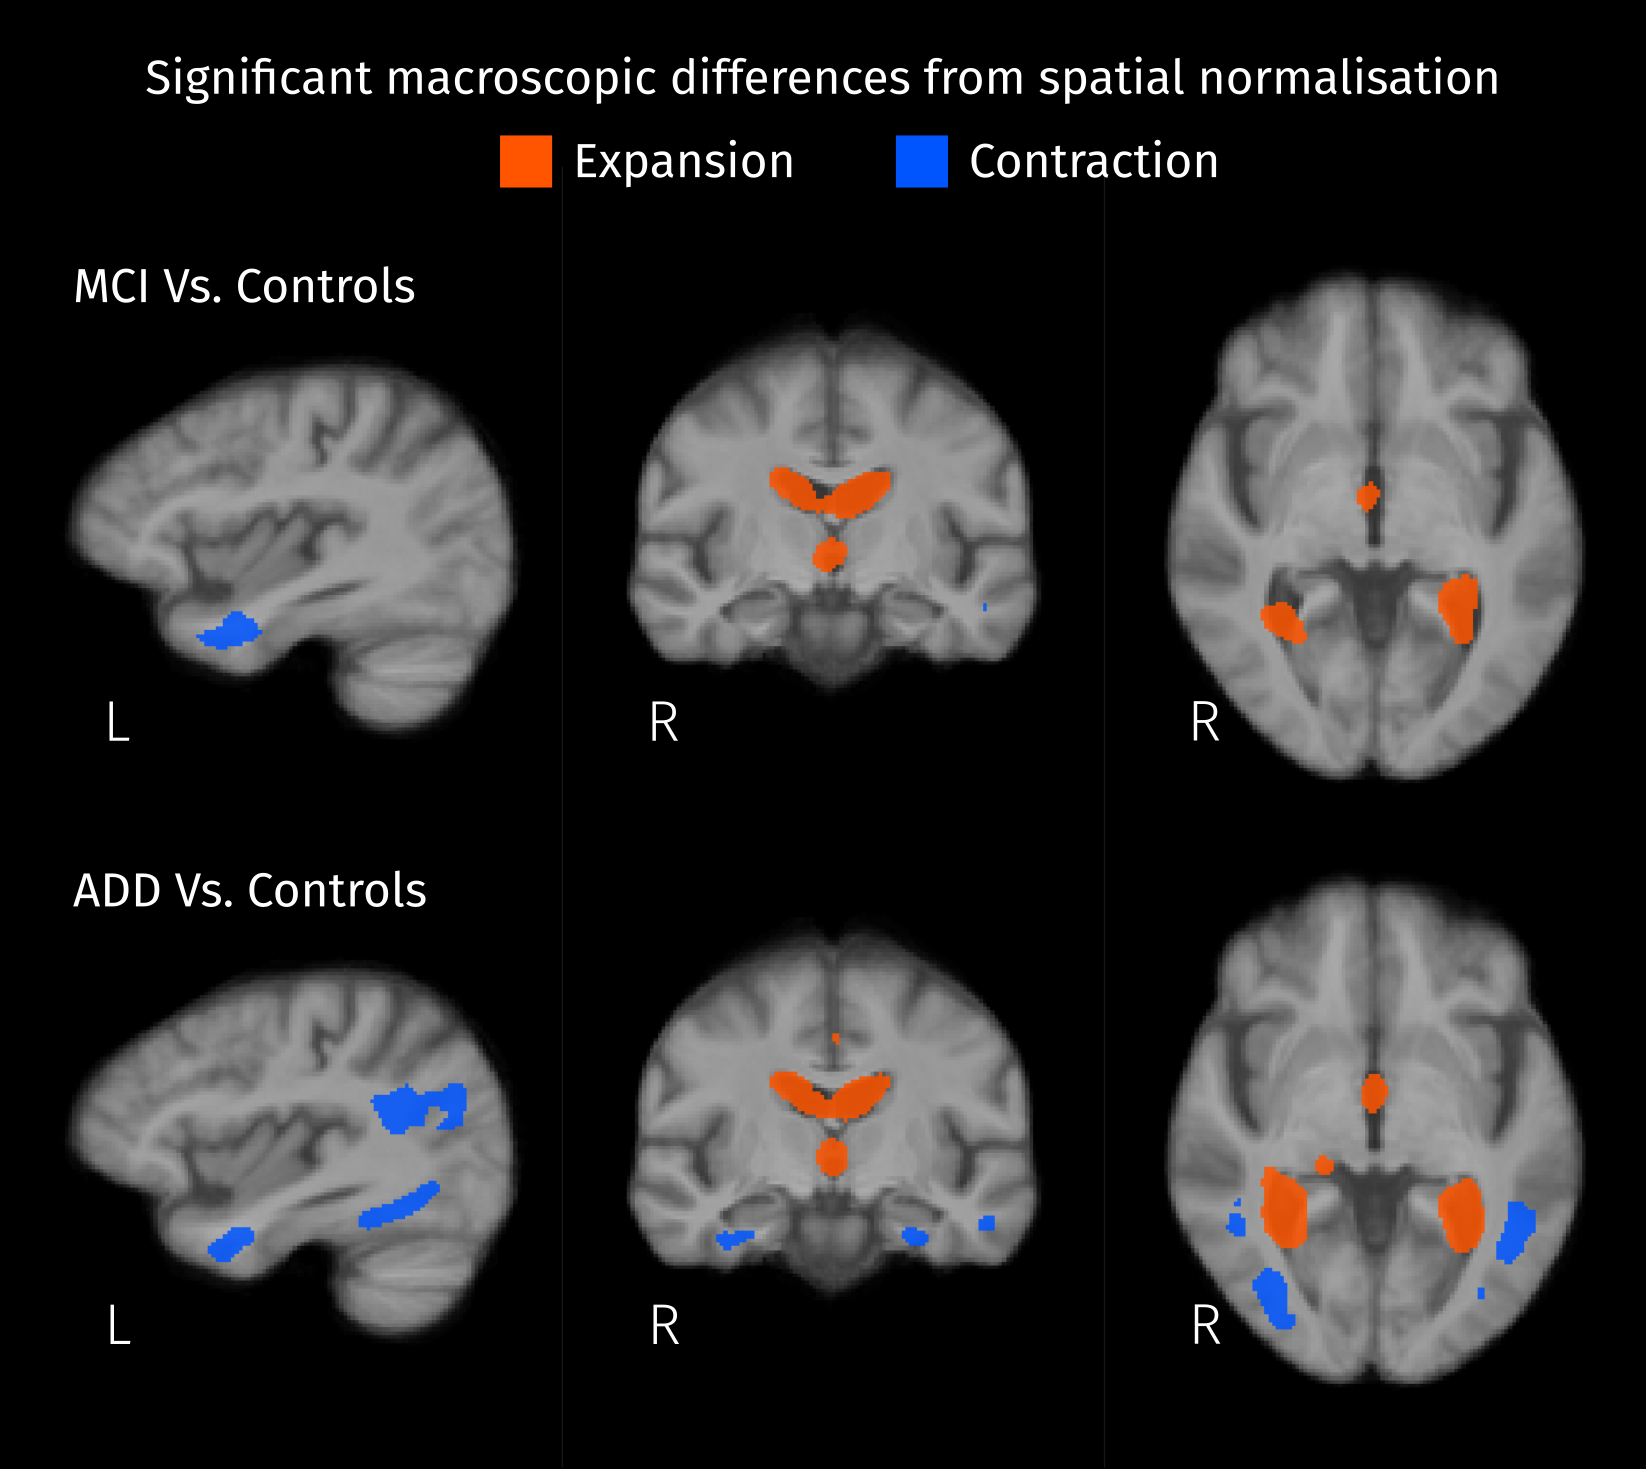
Significant differences (strong FWE-corrected p < 0.05) between patients and controls were detected by comparing local volumetric changes induced by the spatial normalization. Expansion of the ventricles and shrinkage inside the left temporal lobe are observed in both MCI and AD compared to controls.
DOI: https://doi.org/10.58530/2023/3039