3038
Comparison of High-Frequency Conductivity in the Brains of Alzheimer’s Disease Patients and Cognitively Normal Elderly Controls
Geon-Ho Jahng1, Soonchan Park1, Sue Min Jung2, Mun Bae Lee3, Hak Young Rhee4, Chang-Woo Ryu1, A- Rang Cho5, and Oh In Kwon3
1Radiology, Kyung Hee University Hospital at Gangdong, Seoul, Korea, Republic of, 2Biomedical Engineering, Kyung Hee University, Yongin-si, Korea, Republic of, 3Mathematics, Konkuk University, Seoul, Korea, Republic of, 4Neurology, Kyung Hee University Hospital at Gangdong, Seoul, Korea, Republic of, 5Psychiatry, Kyung Hee University Hospital at Gangdong, Seoul, Korea, Republic of
1Radiology, Kyung Hee University Hospital at Gangdong, Seoul, Korea, Republic of, 2Biomedical Engineering, Kyung Hee University, Yongin-si, Korea, Republic of, 3Mathematics, Konkuk University, Seoul, Korea, Republic of, 4Neurology, Kyung Hee University Hospital at Gangdong, Seoul, Korea, Republic of, 5Psychiatry, Kyung Hee University Hospital at Gangdong, Seoul, Korea, Republic of
Synopsis
Keywords: Alzheimer's Disease, Electromagnetic Tissue Properties
The objective of this study was to investigate high-frequency conductivity (HFC) obtained using magnetic resonance electrical property tomography (MREPT) in participants with Alzheimer’s disease (AD), amnestic mild cognitive impairment (MCI), and cognitively normal (CN) elderly controls. High-frequency conductivity (HFC) values in the brain are significantly increased in Alzheimer’s disease (AD) patients compared to cognitively normal (CN) elderly people, are negatively associated with Mini-Mental State Examination (MMSE) scores, and therefore can be used as an imaging biomarker to improve the differentiation of AD from CN.Introduction
Previous studies reported increased concentrations of metallic ions (1,2) and imbalanced Na+ and K+ ions in patients with Alzheimer’s disease (AD) (3,4) and the increased mobility of protons by microstructural disruptions in AD (5,6). Conductivity values vary according to water content, cell shape and size, the mobility of ions and cell membranes, and pathological conditions (7,8). Magnetic resonance electrical property tomography (MREPT) is a technique to derive in vivo internal electrical conductivity using a standard MRI system without applying externally mounted electrodes or currents (9,10). The purposes of this study were: 1)to apply a high-frequency conductivity (HFC) mapping technique using a clinical 3T MRI system, 2) to compare HFC values in the brains of participants with AD, amnestic mild cognitive impairment (MCI), and cognitively normal (CN) elderly people, 3)to evaluate the relationship between HFC values and cognitive decline, and 4)to explore the usefulness of HFC values as an imaging biomarker to evaluate the differentiation of AD from CN.Methods
Participants: This prospective study included 74 participants (23 AD patients, 27 amnestic MCI patients, and 24 CN elderly people) to explore the clinical application of HFC mapping in the brain.MRI acquisition: MRI was performed using a 3.0 Tesla MRI system equipped with a 32-channel sensitivity encoding head coil (Ingenia, Philips Medical System, Best, The Netherlands). For the brain MREPT images, a multi-echo turbo spin-echo pulse sequence was used. The imaging parameters were as follows: repetition time (TR) = 3200 ms, first echo time (TE) = 12 ms with 12 ms intervals, flip angle (FA) = 90°, number of echoes (NE) = 6, number of average (NSA) = 1, slice thickness = 5 mm, number of slices = 20 without a gap between the slices, slice orientation = transverse, fold-over direction = anterior-posterior (AP), fat shift direction = left, acquired voxel size = 2 × 2 × 5 mm3, reconstructed voxel size = 1 × 1 × 5 mm3, acquisition matrix = 112×112, reconstruction matrix = 224 x 224, field-of-view (FOV) = 224 × 224 mm2, SENSE factor = 0, TSE factor = 6, RF shim =”adaptive”, B0 shim = “PB-volume”, slice scan order = interleaved, and regional saturation slab = 45 mm at the feet direction. The scan time of the MREPT sequence was 6 min and 5 seconds. Real and imaginary images were saved for reconstructing the conductivity map.
Imaging processing: A homemade software was used to map the HFC at the Larmor frequency of 128 MHz at 3T (9). The MREPT formula based on a convection reaction equation was derived by adding the regularization coefficient (11). To solve the convection reaction partial differential equation, we used the 2-dimensional finite-difference method. The MREPT formula based on a convection reaction equation can be derived by adding the regularization coefficient c. MREPT depends upon the relatively weak phase signal by a secondary RF magnetic field from the induced electrical current by the time-varying RF field. To evaluate HFC maps among the three participant groups, the post-processing was performed using Statistical Parametric Mapping version 12 (SPM12) software (http://www.fil.ion.ucl.ac.uk/spm/software/spm12/).
Statistical analyses: With both voxel-based and region-of-interest (ROI) methods, we performed statistical analyses to 1) compare HFC maps between the three participant groups, 2) to evaluate the association of HFC maps with Mini-Mental State Examination (MMSE) scores, and 3) to evaluate the differentiation between the participant groups for HFC values for some brain areas.
Results
We obtained a good HFC map noninvasively. Figure 1 shows the results of voxel-based analyses of HFC map among the three groups. The result of voxel-based ANCOVA test shows that the HFC value was higher in the AD group than in the CN and MCI groups (Fig 1a). The result of voxel-based multiple regression test shows that MMSE scores were negatively associated with HFC values, but age was positively associated with HFC values (Fig 1b). Figure 2 shows the results of correlation analyses between age or MMSE scores and HFC values obtained from specific ROI areas. The HFC value in the insula has a high area under the ROC curve (AUC) value to differentiate AD patients from the CN participants (Sensitivity (SE) = 82, Specificity (SP) =97, AUC = 0.902, p < 0.0001), better than GMV in hippocampus (SE = 79, SP =83, AUC = 0.880, p < 0.0001). The classification for differentiating AD from CN was highest by adding the hippocampal GMV to the insular HFC value (SE = 87, SP = 87, AUC = 0.928, p < 0.0001).Conclusion
HFC values were significantly increased in the AD group compared to the CN group and increased with age and disease severity. HFC values of the insula along with the GMV of the hippocampus can be used as an imaging biomarker to improve the differentiation of AD from CN.Acknowledgements
The research was supported by the National Research Foundation of Korea (NRF) grants funded by the Ministry of Science and ICT (2020R1A2C1004749, G.H.J.; 2019R1A2C1004660, O.I.K.; 2020R1F1A1A01074353, M.B.L.), Republic of Korea.References
1) Zatta P, et al. Trends Pharmacol Sci 2009; 30:346-355. 2) Wang L, et al. Transl Neurodegener 2020; 9:10. 3) Vitvitsky VM, et al. Biochim Biophys Acta 2012; 1822:1671-1681. 4) Korol' TY, et al. Neurophysiology 2008; 40:385-392. 5) Amlien IK and Fjell AM. Neuroscience 2014; 276:206-215. 6) Jahng GH, et al. Neuroradiology 2011; 53:749-762. 7) Foster KR and Schwan HP. Crit Rev Biomed Eng 1989; 17:25-104. 8) Joines WT, et al. Med Phys 1994; 21:547-550. 9) Katscher U, et al. IEEE Trans Med Imaging 2009; 28:1365-1374. 10) Voigt T, et al. Magn Reson Med 2011; 66:456-466. 11) Gurler N and Ider YZ. Magn Reson Med 2017; 77:137-150.Figures
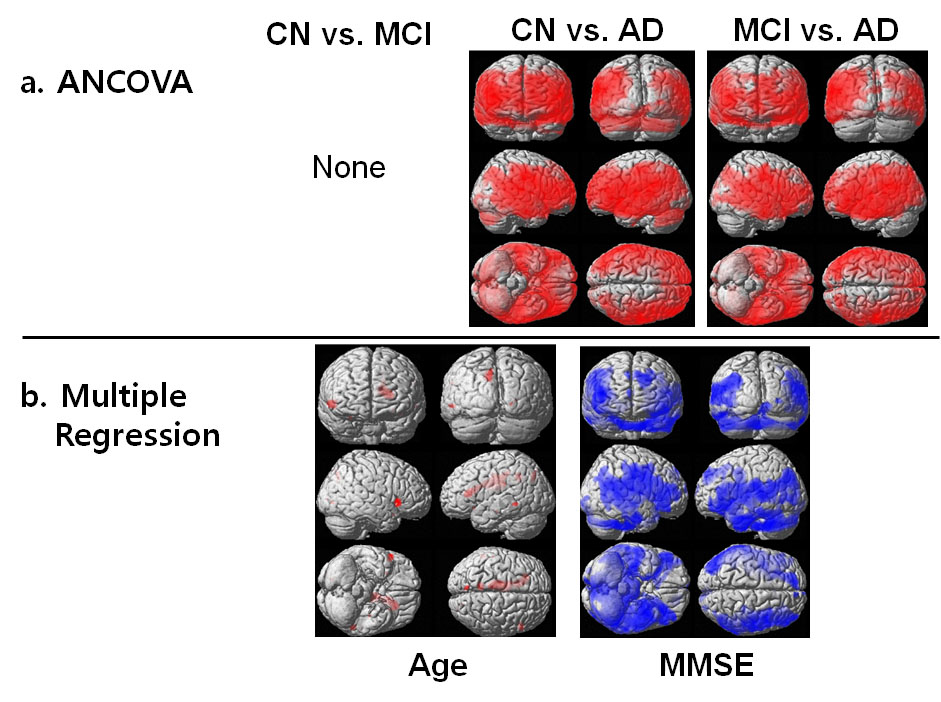
Figure
1. Results
of voxel-based analyses of high-frequency conductivity (HFC) map among the three groups.
The
result of voxel-based ANCOVA test shows that the HFC value was higher in the Alzheimer’s disease (AD) group than in the cognitively normal (CN) elderly and amnestic mild cognitive impairment (MCI) groups (Fig
1a). The result of voxel-based multiple regression test shows that Mini-Mental
State Examination (MMSE) scores were negatively associated with HFC values, but age was positively
associated with HFC values (Fig 1b).
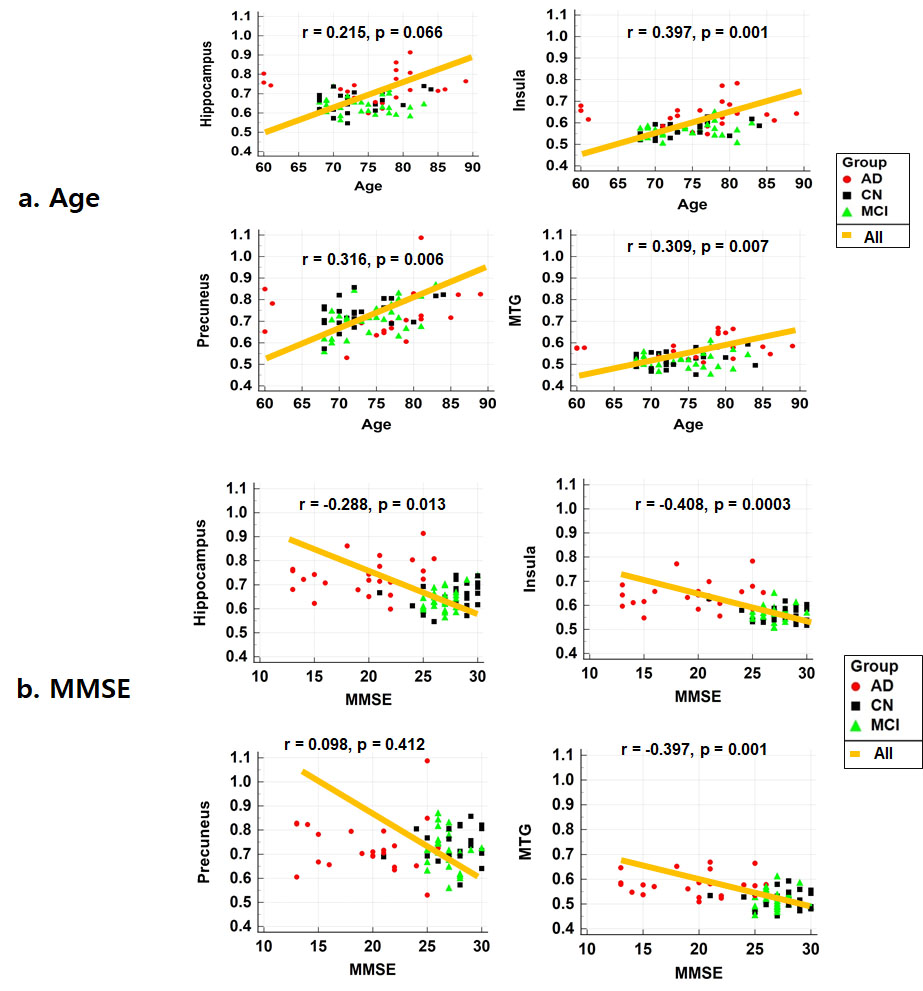
Figure
2. Results of correlation analyses
between age or Mini-Mental
State Examination (MMSE) scores and high-frequency conductivity (HFC) values obtained from specific brain areas.
DOI: https://doi.org/10.58530/2023/3038