3035
Increased Local Specialization of Structural Networks Revealed by Probabilistic Diffusion Tractography in Cerebral Small Vessel Disease1Shandong Provincial Hospital, Shandong University, Jinan, China, 2Key Laboratory of Cognition and Personality (Ministry of Education), Chongqing, China, 3School of Psychology, Southwest University, Chongqing, China, 4Research Center for Brain-inspired Intelligence, Institute of Automation, Chinese Academy of Sciences, Beijing, China, 5University of Chinese Academy of Sciences, Beijing, China, 6Shandong Provincial Hospital Affiliated to Shandong First Medical University, Jinan, China
Synopsis
Keywords: White Matter, Diffusion Tensor Imaging
We used probabilistic diffusion tractography and graph theory based on DTI to investigate the topologic organization of white matter (WM) structural networks in 54 patients with severe CSVD burden (CSVD-s), 117 patients with mild CSVD burden (CSVD-m) and 73 healthy controls. Compared with CSVD-m patients and controls, CSVD-s patients exhibited significantly increased local efficiency, normalized clustering coefficient and small world index, with partially reorganized hub distributions. In addition, the CSVD-s patients showed significantly increased nodal efficiency in some brain regions. Intriguingly, the significant correlation between node efficiency and cognitive parameters existed in CSVD-m and control groups.Introduction
Cerebral small vessel disease (CSVD) is one of the most common diseases of older adults and plays a vital role in dementia and stroke1. The pathophysiology of these deficits is still incompletely understood. Neuroimaging is considered the gold standard for detecting CSVD, which can present diverse features on MRI. Previous studies have focused on the effect of a single CSVD marker, but these features often occur simultaneously. Therefore, Pim Klarenbeek et al. proposed the concept of total CSVD burden based on four of the key neuroimaging markers to more completely estimate the severity of CSVD2. Previous neuroimaging studies have illuminated that the structural connectivity of brain white matter (WM) networks in CSVD is disrupted. However, little has been reported regarding the topological alterations of whole-brain structural connectivity in patients with different CSVD burden.Methods
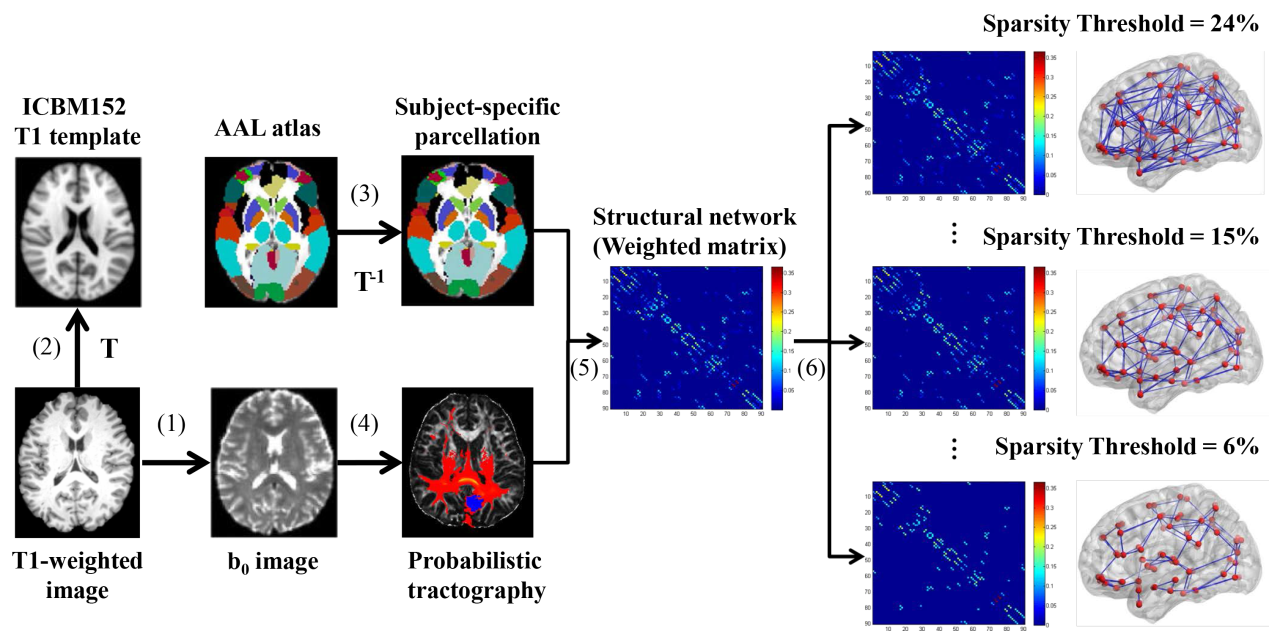
We divided our subjects into three subgroups according to the total CSVD burden, a pragmatic ordinal scale of 0-42. Subjects with scores of 0-1 were classified into the CSVD-m group, and subjects with scores of 2-4 were classified into the CSVD-s group3, 4. Probabilistic diffusion tractography and graph theory were used to investigate the topologic organization of the structural networks in 54 CSVD-s patients, 117 CSVD-m and 73 healthy controls. The WM networks were constructed by estimating interregional connectivity probability, and the network topological properties were characterized using graph theory. One-way analysis of covariance with LSD post hoc tests was applied for between-group comparisons of these graphic metrics, and Pearson’s correlations between the significantly altered nodal metrics and cognitive parameters were also assessed for all groups.Results
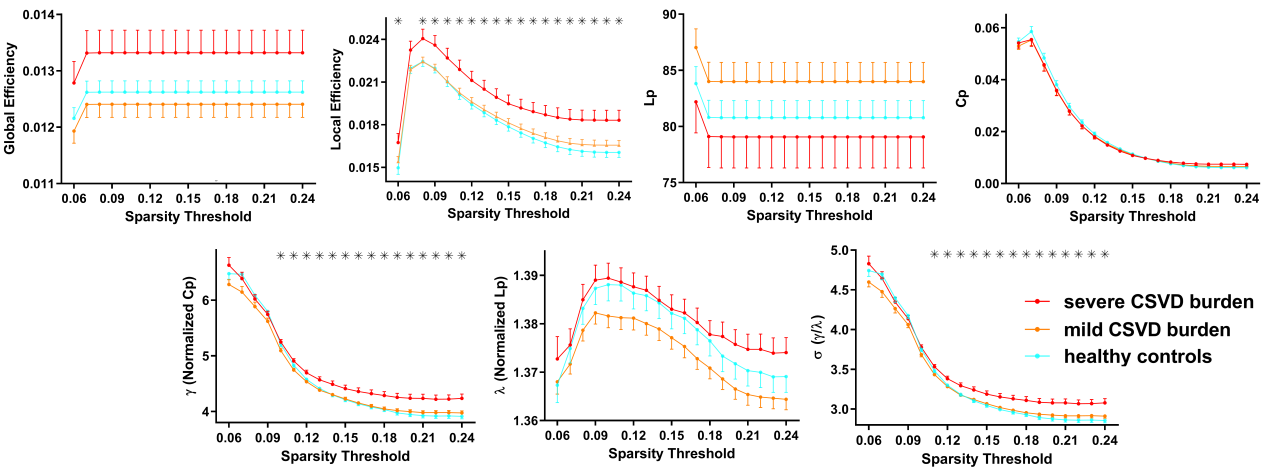
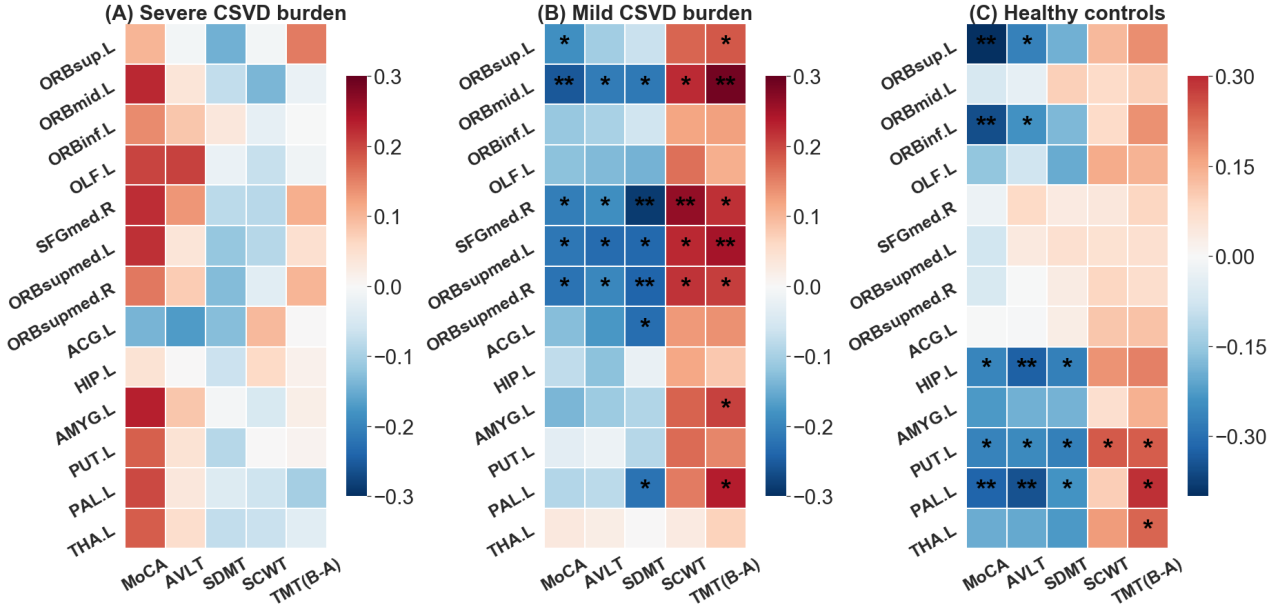
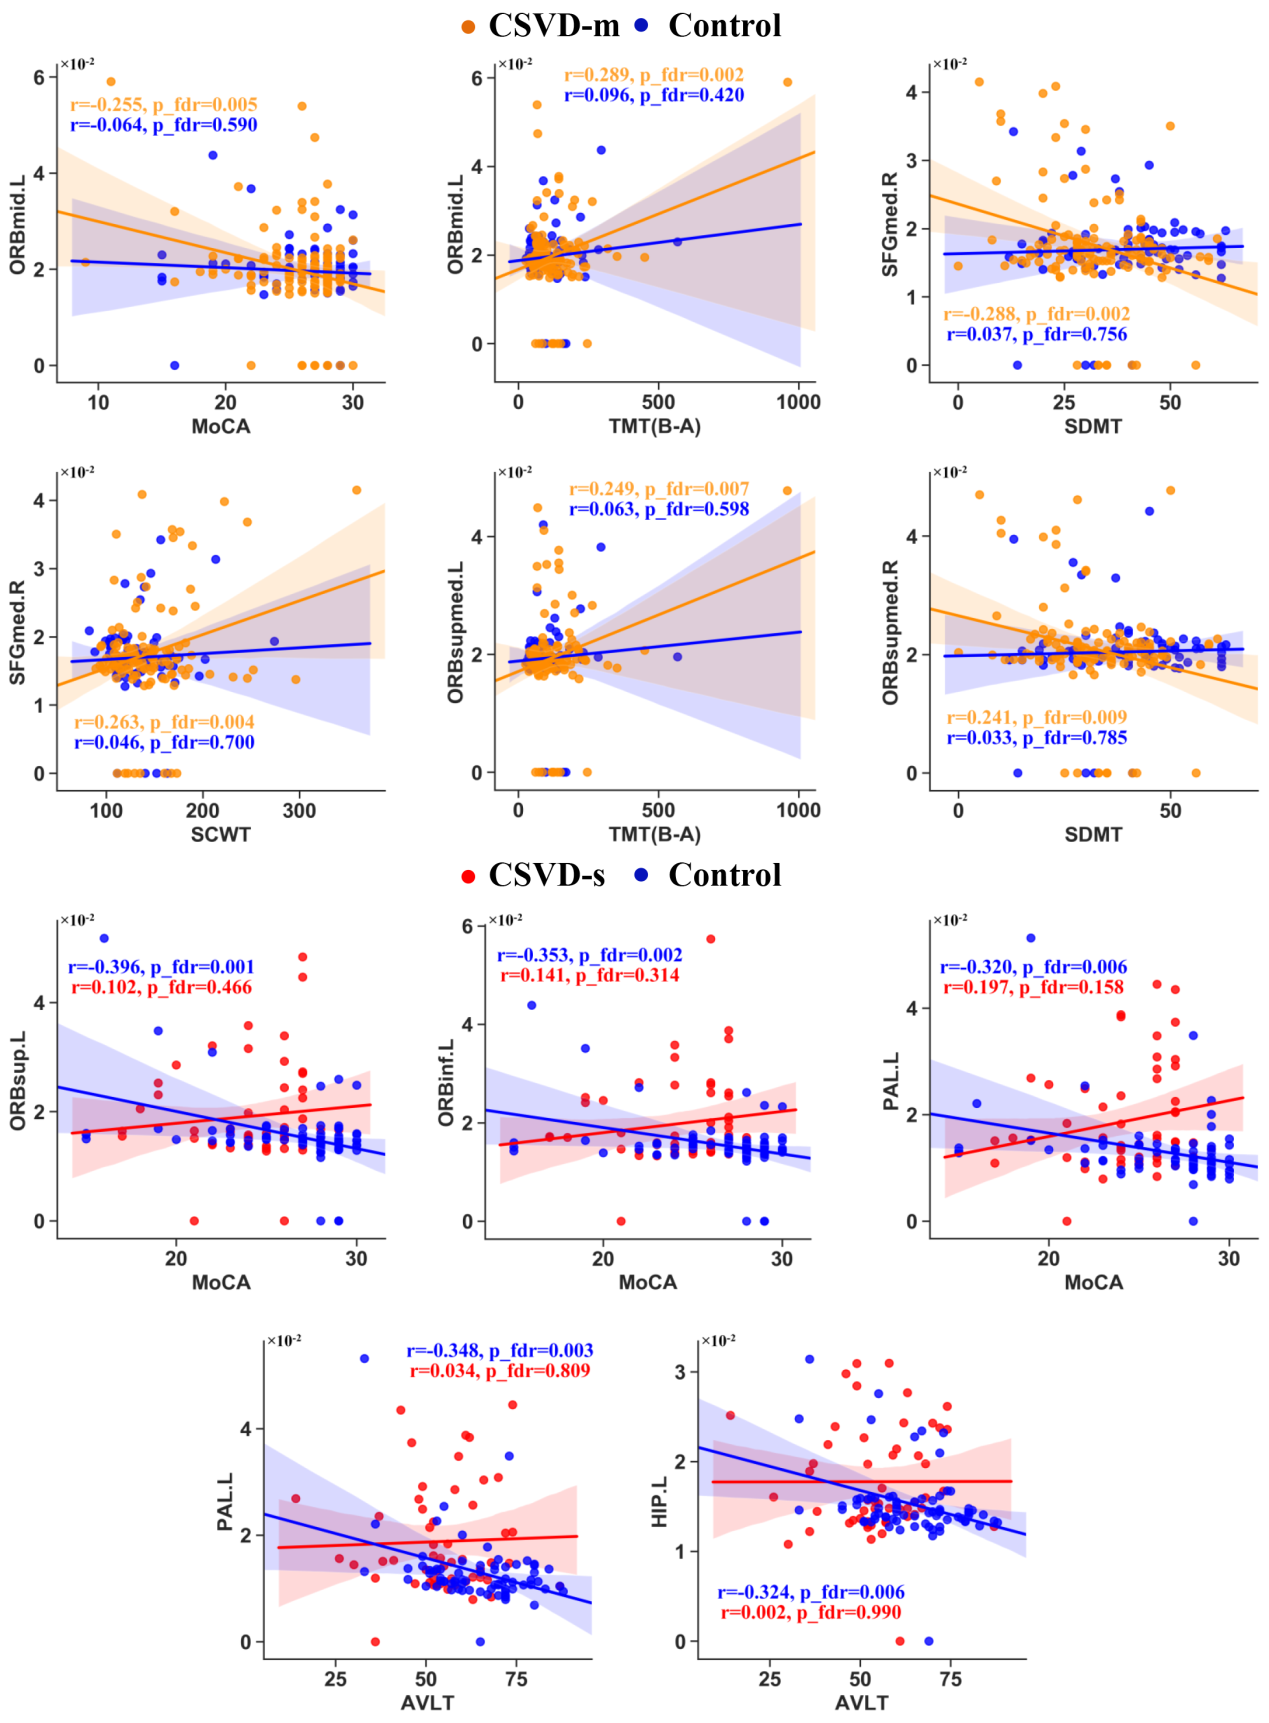
We found that both the CSVD and control groups showed efficient small-world organization in WM networks. However, compared with CSVD-m patients and controls, CSVD-s patients exhibited significantly increased local efficiency, normalized clustering coefficient and small world index, with partially reorganized hub distributions, indicating increased local specialization and disrupted balance between local specialization and global integration in WM networks. In addition, the CSVD-s patients showed significantly increased nodal efficiency in the left orbital frontal gyrus, hippocampus, thalamus, basal ganglia, involved with the default mode network (DMN) and attention related functional modules. Intriguingly, although no significant global and regional topological alterations were found in CSVD-m patients, the nodal efficiency in the medial orbital superior frontal gyrus, orbital middle frontal gyrus, amygdala, pallidum and anterior cingulate gyrus was significantly correlated with cognitive parameters, while no significant Pearson’s correlation between nodal metrics and cognitive dysfunction was found in CSVD-s patients.Discussion
In this study, all groups showed small-world properties which suggests that the basic brain organization was conserved in CSVD and small-world networks can tolerate developmental or disease-induced brain structural alterations to some extent5. However, different from the other two groups, the CSVD-s group exhibited significantly increased Eloc, γ and σ over a wide range of sparsity thresholds. In our previous study, we used graph theory to investigate the topological organization of the functional networks in CSVD patients and revealed significantly decreased Eloc and γ in CSVD patients with cerebral microbleeds6. We speculated that CSVD led to a decreased efficiency of information processing and transmission in the functional networks, the structural networks of CSVD patients needed to be adaptively restructured and optimized for the normal operation of brain function.The three groups had highly similar hub distributions, supporting the view that the key regions of the structural network are conserved throughout the development process7. In addition, compared with the other two groups, the CSVD-s group exhibited additional and absent hub region. This may be due to the undergoing changes in the brain structural networks during the course of the disease in the CSVD-s group, which affect the optimal paths of information transmission and ultimately lead to alterations in the hub distribution.
Significantly increased node efficiency in thirteen brain regions in CSVD-s group indicated that the ability to transmit information between nodes in these regions increased. The reason may be that various risk factors lead to damage in the cerebral endothelium of the blood–brain barrier (BBB),and destruction of the integrity of the BBB leads to damage to neurons1, resulting in the destruction of brain structures and impaired brain function. Then, gliocytes proliferate at the site of damage to the central nervous system, and brain remodeling occurs, and the ability to transmit information is repaired to improve the efficiency of the nodes, so that brain function can be maintained.
There was no Pearson’s correlation between nodal efficiency and cognitive parameters in CSVD-s group due to CSVD-s patients have more severe brain structure damage, resulting in the correlations between the two being no longer simple linear relationships. In addition, although nodal efficiency was significantly correlated with cognitive function in both the CSVD-m and control groups, there were differences in related regions between the two groups, suggesting that CSVD caused the transfer of key brain regions related to cognition.
Conclusion
The alterations of structural networks in patients with different CSVD burden provide insights into understanding the altered topological properties in relation to disease severity of CSVD. Cognitive correlations with topological properties suggest their potential use as markers to assess the risk of CSVD.Acknowledgements
We thank all of the volunteers and patients for their participation in our study.References
1. Pantoni L. Cerebral small vessel disease: from pathogenesis and clinical characteristics to therapeutic challenges. The Lancet Neurology. 2010;9(7):689-701.
2. Klarenbeek P, van Oostenbrugge R J, Rouhl R P, et al. Ambulatory blood pressure in patients with lacunar stroke: association with total MRI burden of cerebral small vessel disease. Stroke. 2013;44(11):2995-9.
3. Chen H, Wan H, Zhang M, et al. Cerebral small vessel disease may worsen motor function, cognition, and mood in Parkinson's disease. Parkinsonism & related disorders. 2021;83:86-92.
4. Zhang Y, Zhang Z, Zhang M, et al. Correlation Between Retinal Microvascular Abnormalities and Total Magnetic Resonance Imaging Burden of Cerebral Small Vessel Disease in Patients With Type 2 Diabetes. Frontiers in neuroscience. 2021;15:727998.
5. He Y, Dagher A, Chen Z, et al. Impaired small-world efficiency in structural cortical networks in multiple sclerosis associated with white matter lesion load. Brain : a journal of neurology. 2009;132(Pt 12):3366-79.
6. Xin H, Wen H, Feng M, et al. Disrupted topological organization of resting-state functional brain networks in cerebral small vessel disease. Human brain mapping. 2022.
7.Wen H, Liu Y, Rekik I, et al. Disrupted topological organization of structural networks revealed by probabilistic diffusion tractography in Tourette syndrome children. Human brain mapping. 2017;38(8):3988-4008.
Figures