3033
Aging-related Changes in Spontaneous Brain Activity in White Matter1Vanderbilt University Institute of Imaging Science, Nashville, TN, United States
Synopsis
Keywords: White Matter, Aging
Recent studies have consistently reported that BOLD effects in WM reflect neural activities, and thus represent a new window into brain function. Here we evaluate the potential value of BOLD measurements in WM as an indicator of functional changes during normal aging. We observed a widespread reduction of metrics of WM BOLD effects, suggesting changes occur in information exchange in WM with aging. Our findings converge to support the notion that WM BOLD signals in specific regions and their interactions with others have the potential to serve as imaging markers of aging.Introduction
The aging brain is characterized by declines in not only numbers of neurons but also their myelinated projections, namely white matter (WM), that provide the essential foundations for neurotransmission between neurons. Age-related alterations of WM have previously been characterized as histopathological degeneration and in MRI have been assessed by T2 FLAIR and diffusion MRI. Recent studies have consistently reported that BOLD effects in WM are similar though weaker than in gray matter (GM), reflect neural activities1,2, and thus represent a new window into brain function. We therefore conducted a comprehensive quantification of WM BOLD signals from microscopic to macroscopic scales, to validate their potential values as indicators of functional changes during normal aging.Methods
Five hundred and ten healthy individuals were selected from the OASIS-3 database (213 male and 297 female, Cognitively normal, CDR = 0, whose ages ranged between 42 and 95 years)3. All but three individuals were scanned twice so we have 1017 images in total. An automated high-performance pipeline, as detailed elsewhere4, was created to preprocess the data. Then an ICA (independent component analysis) approach was used to decompose voxels sharing similar time courses into spatially independent components (ICs). The temporal synchronizations within or among specific ICs were assessed, potentially revealing important functional communication. On a larger scale, we reconstructed a graph based on the pair-wise connectivity among ICs, modeling the WM as a complex network and producing a set of graph-theoretical metrics, i.e., cluster coefficients, efficiency, and strength, that were used to probe the topological properties underlying the network. Meanwhile, based on the hierarchical structures of the graph, we grouped ICs into three sub-circuits using the Louvain community detection approach and then assessed the within-/inter- circuit connectivities. To identify which measurements exhibit significant correlations with age, multivariate linear regression was modeled as follows;measurement = constant + b1×age+b2×age2+b3×gender+b4×headmotion
Head motion was parameterized by the framewise displacement5 derived from the preprocessing step.
Results
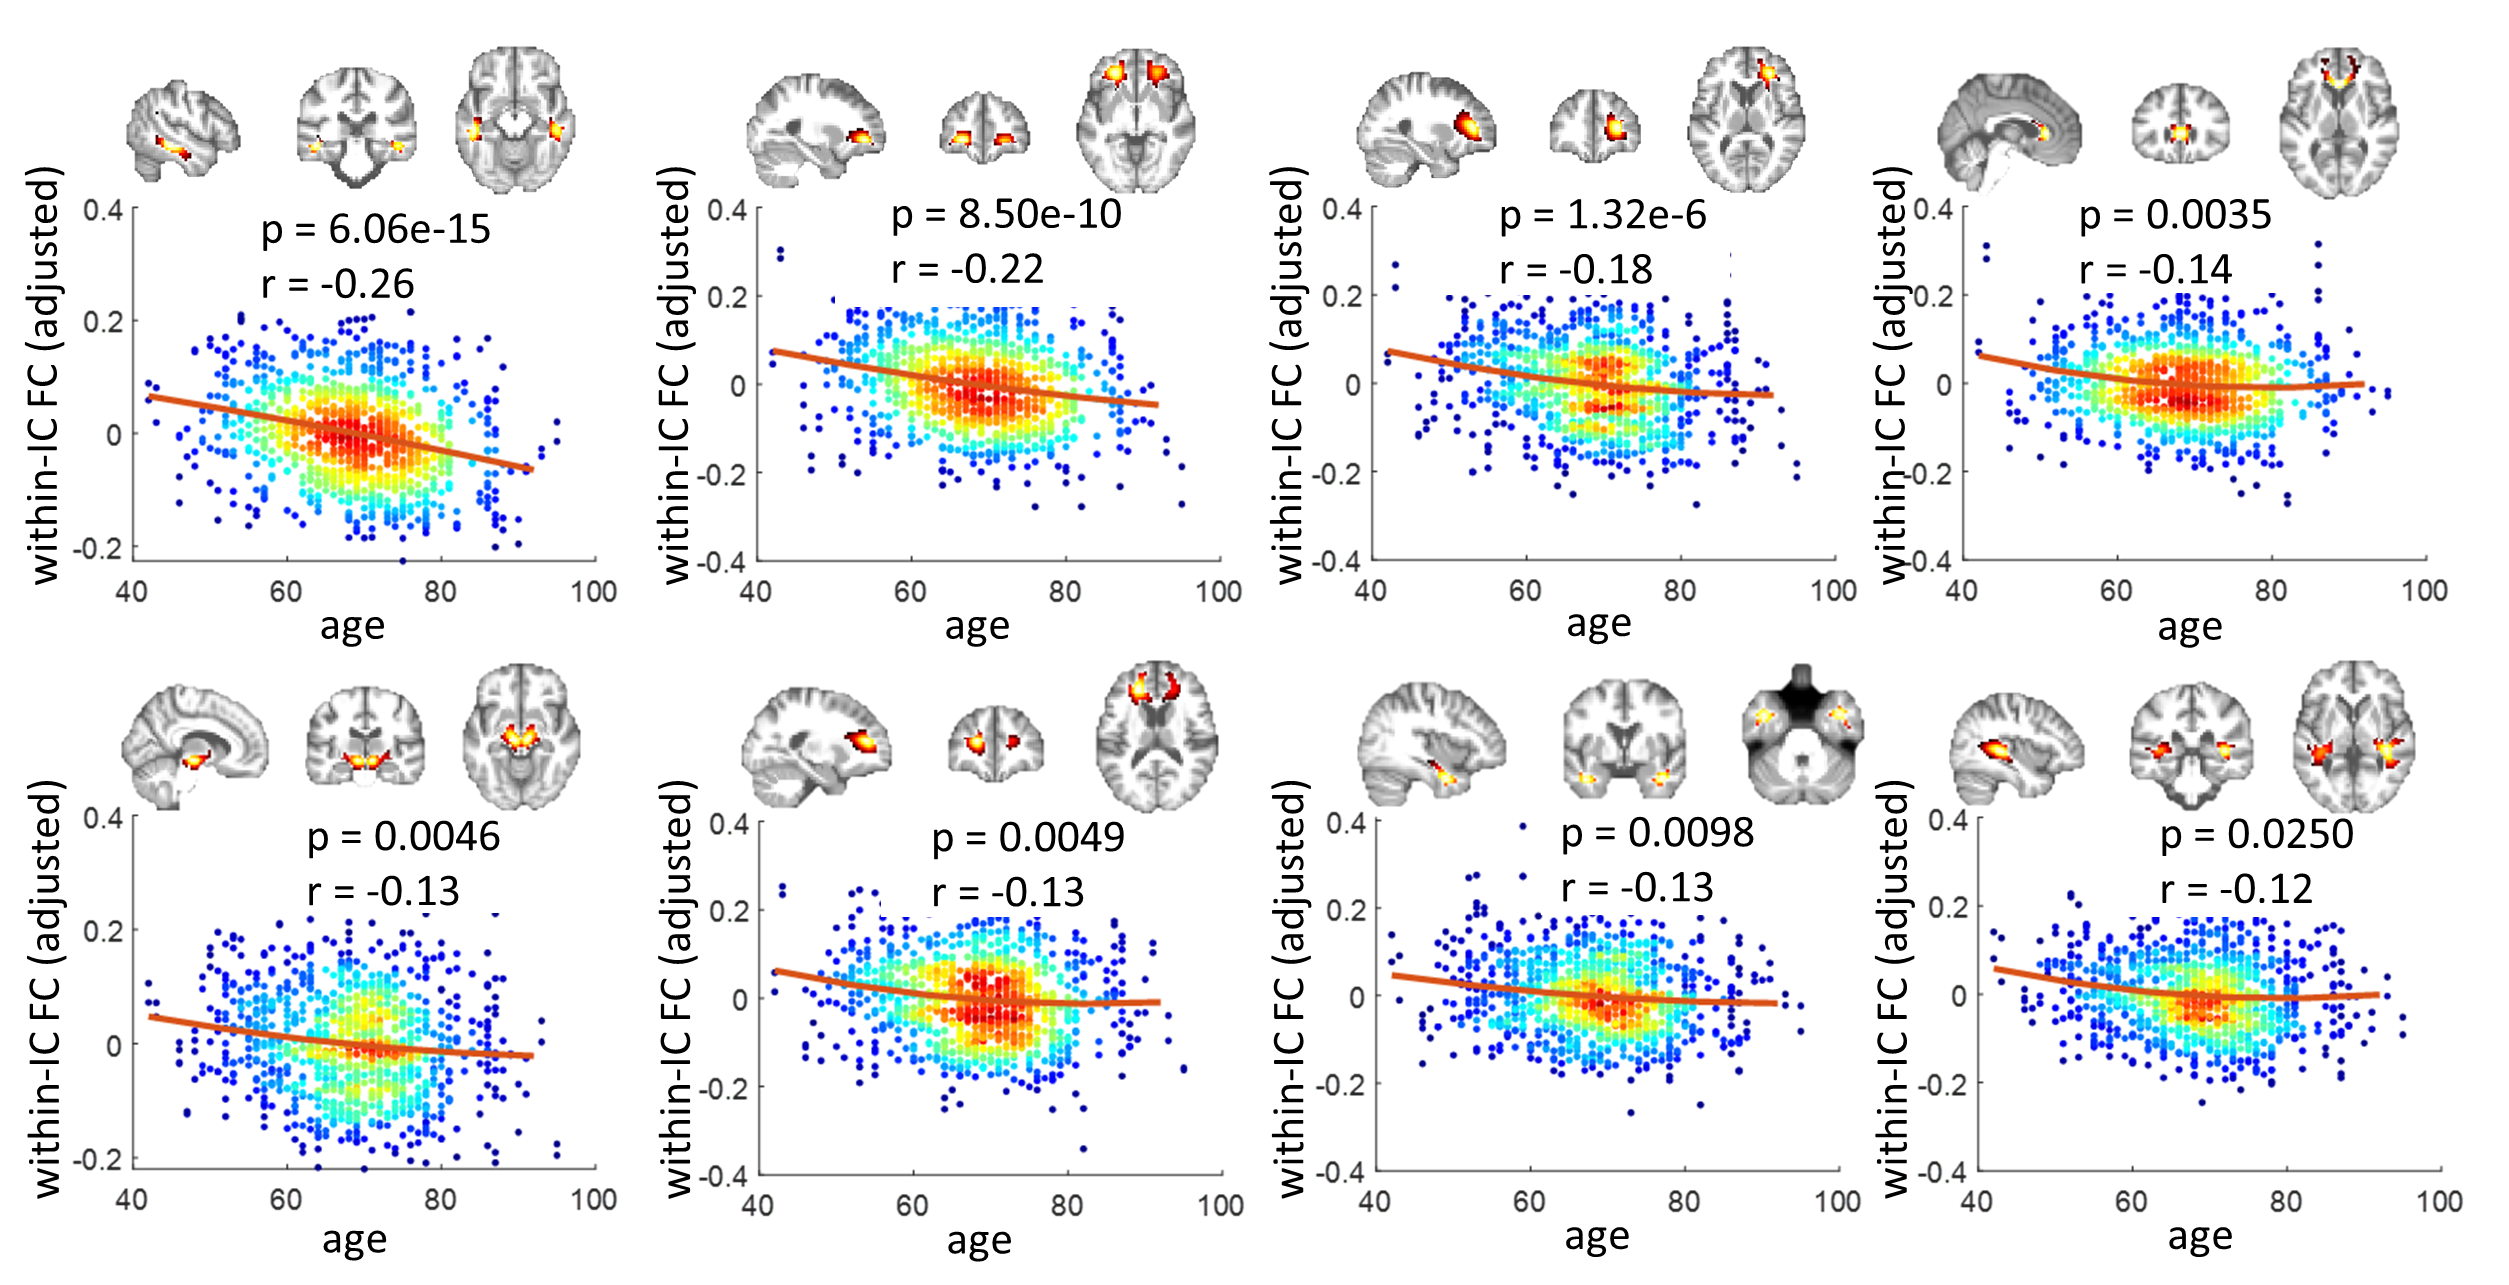
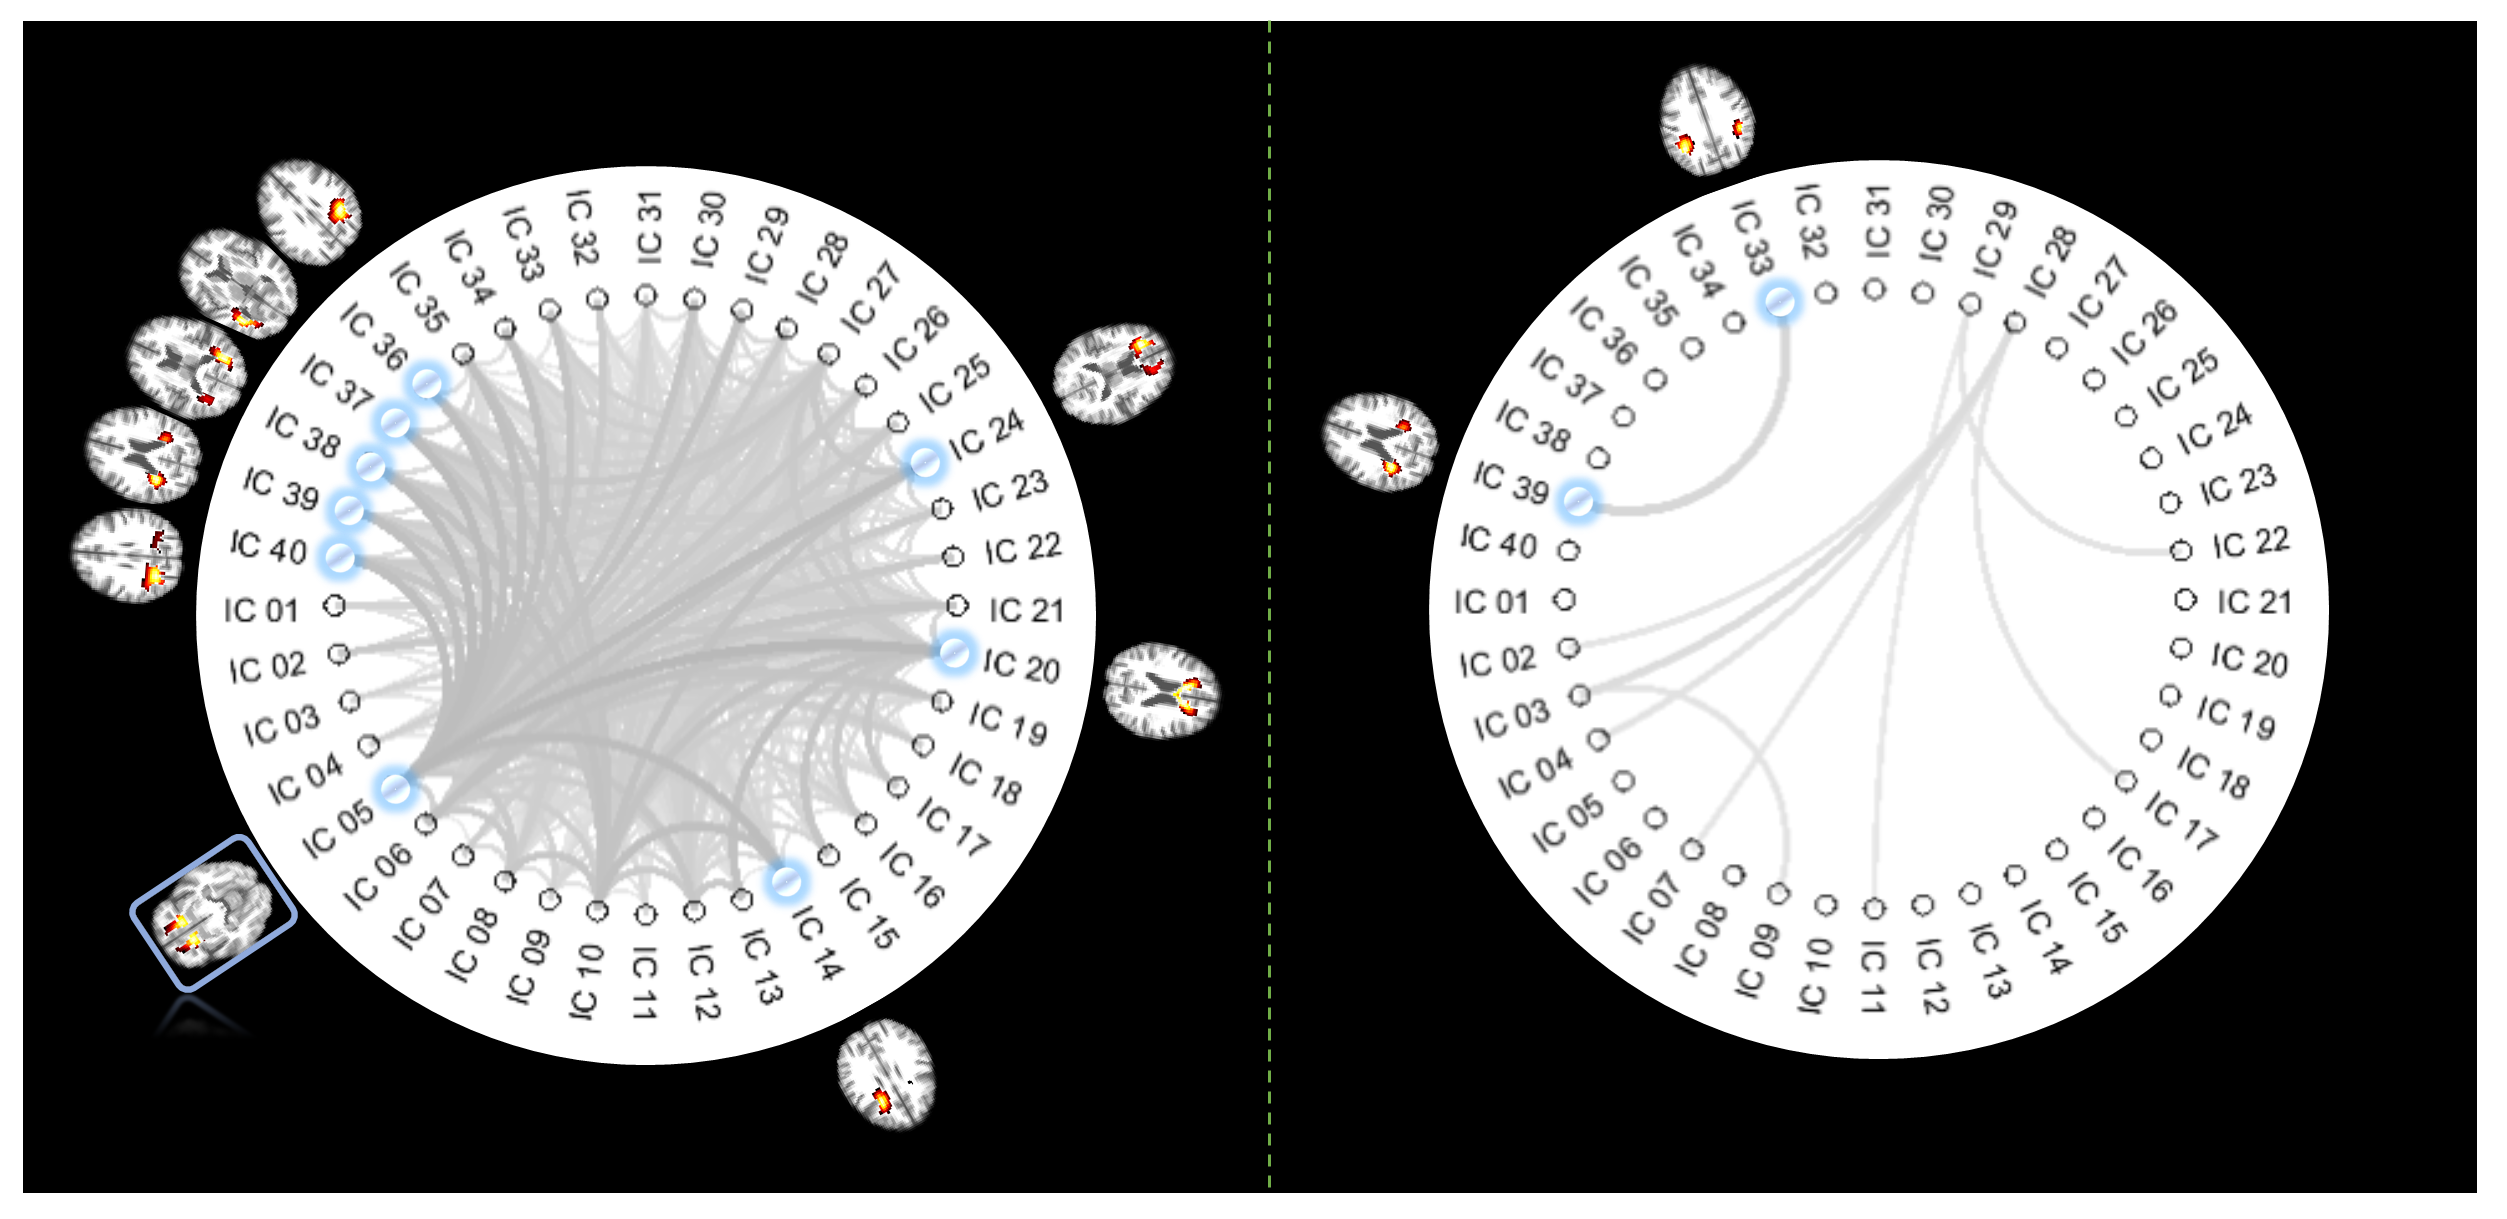
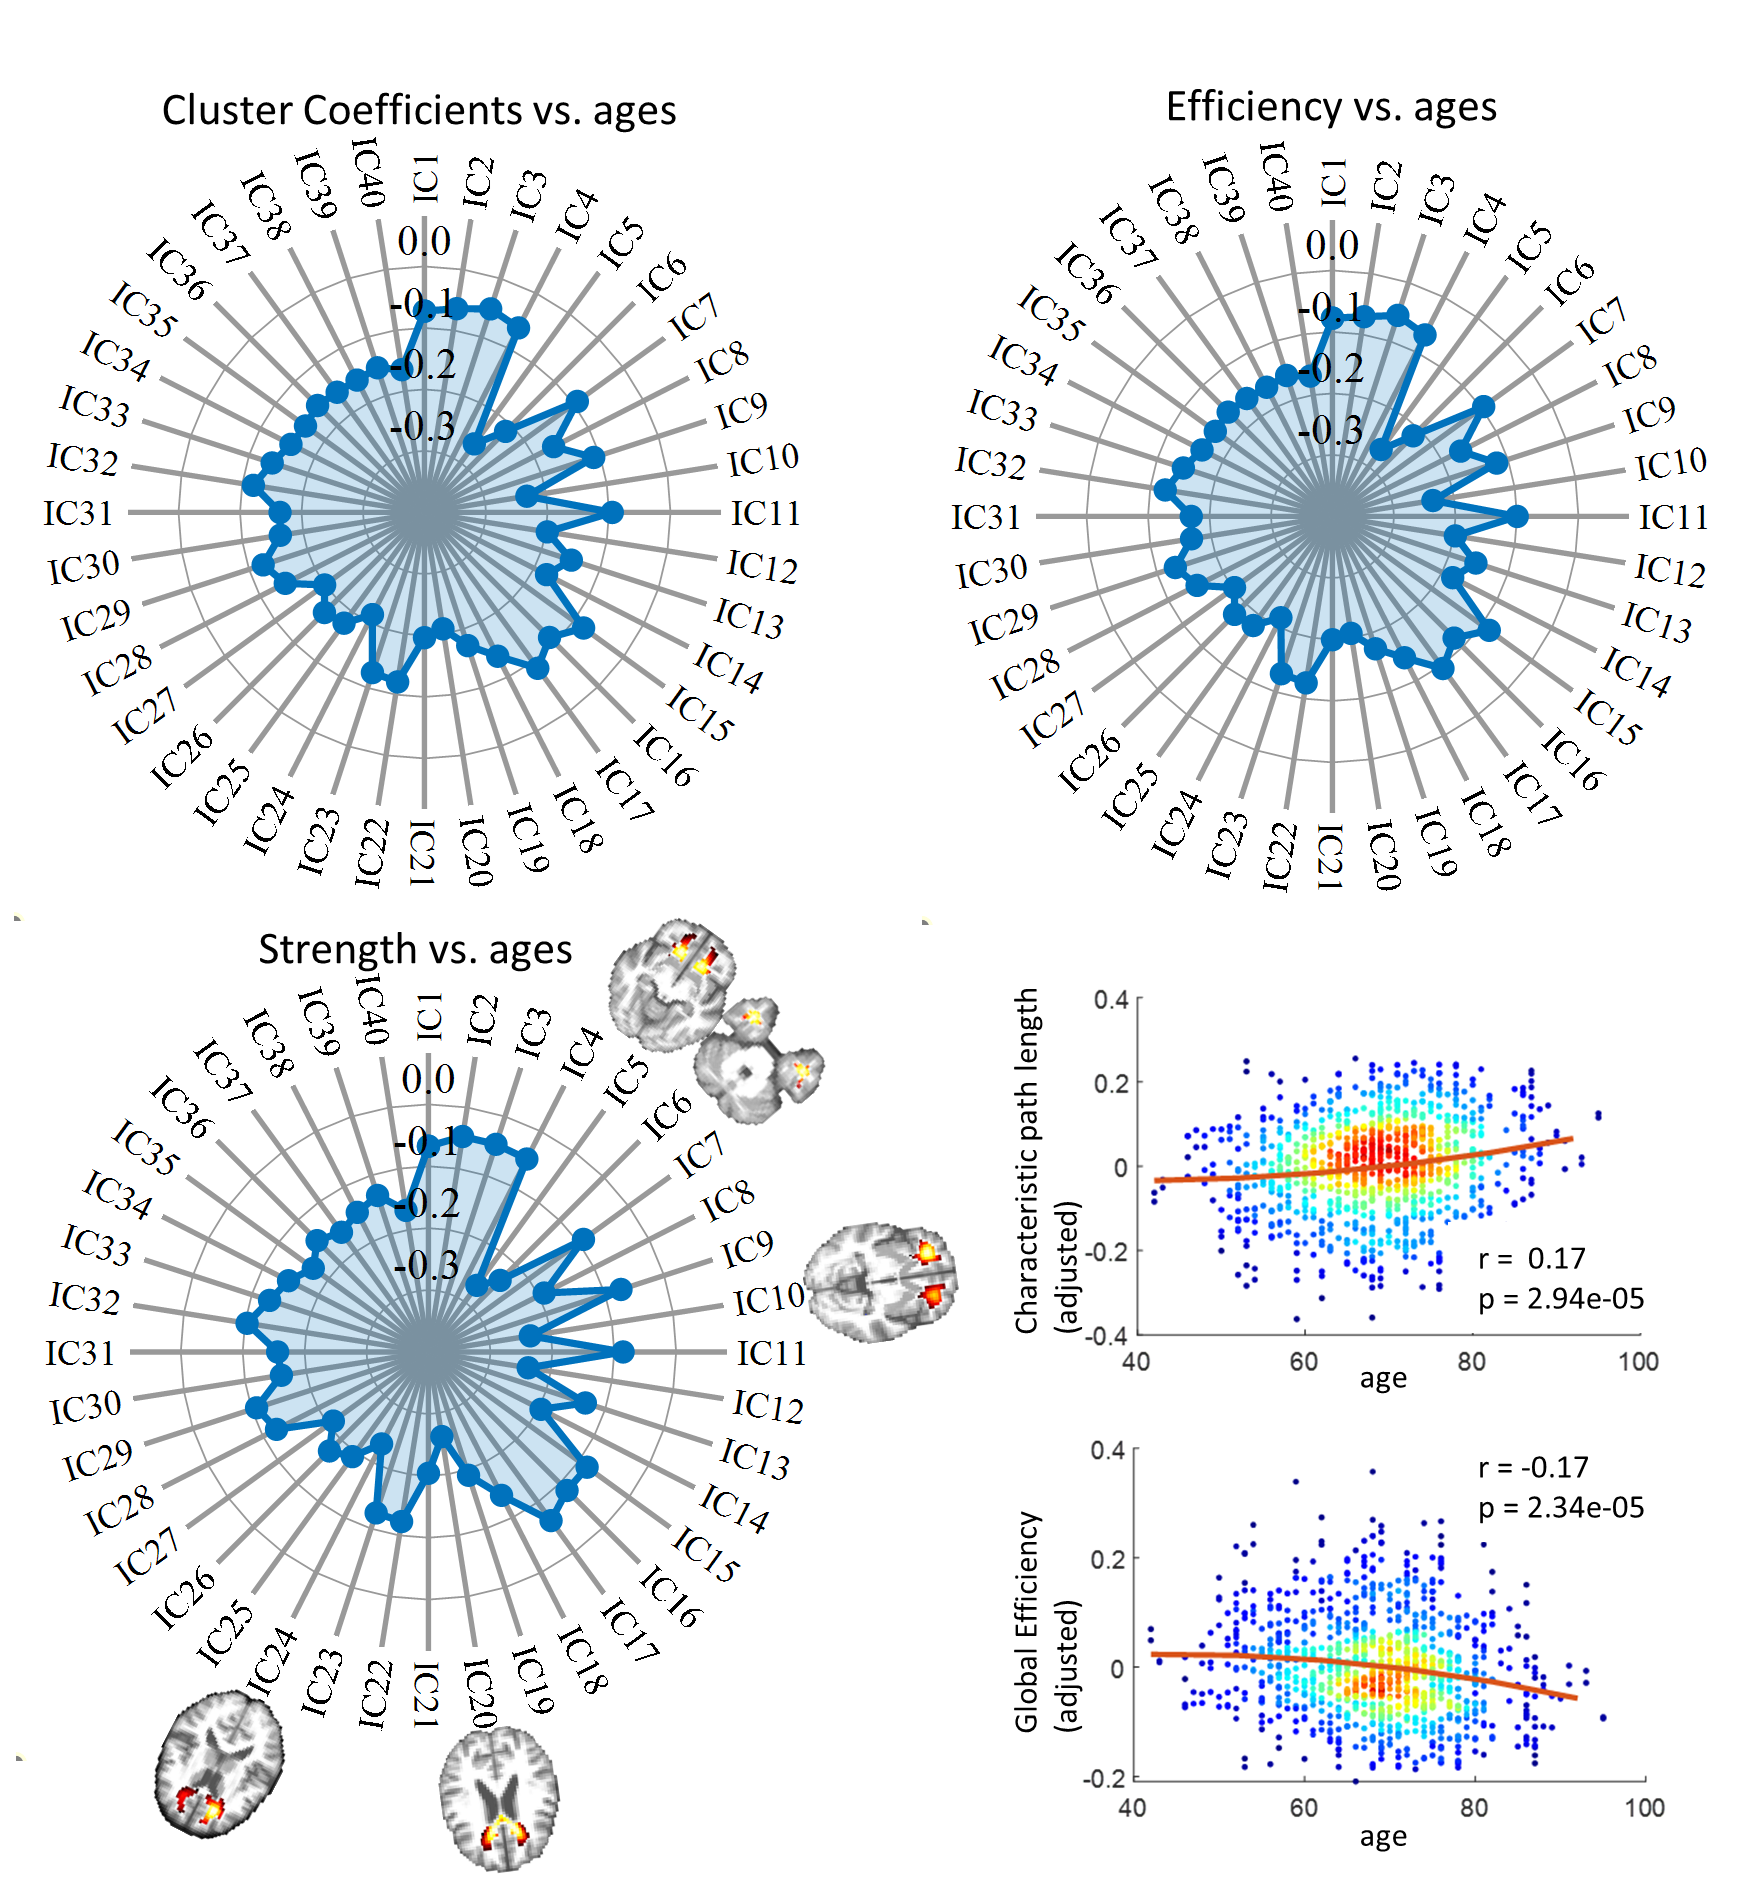
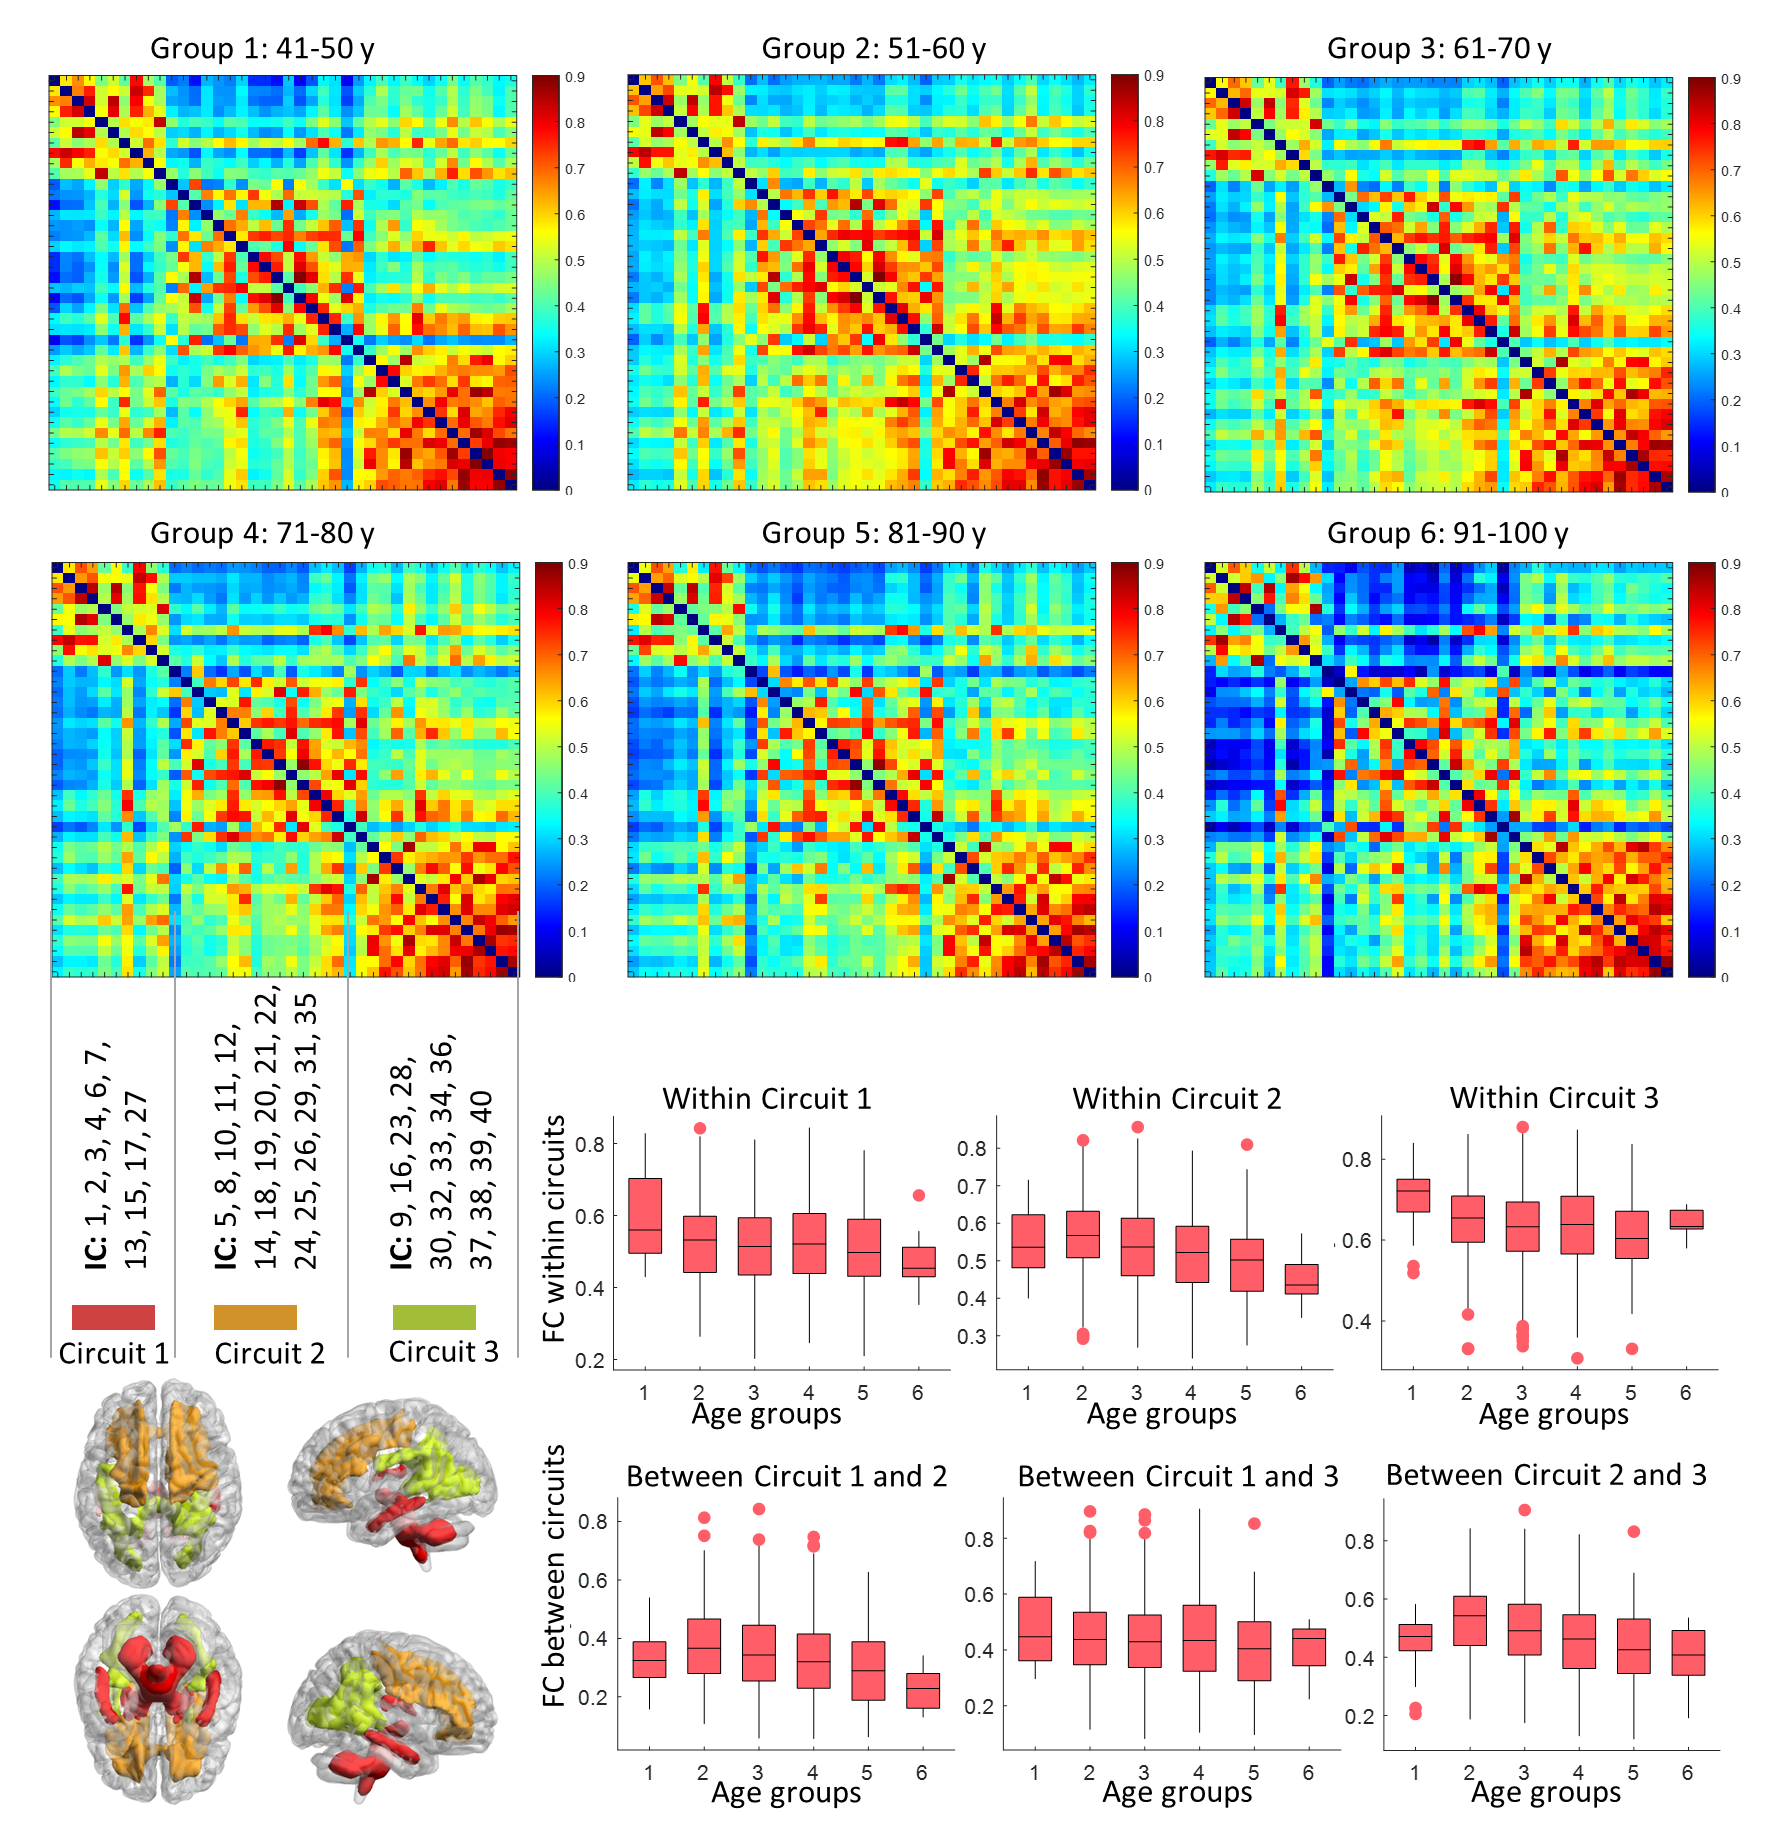
By regression, we identified eight ICs whose within-IC functional connectivities (FCs) varied significantly with age (p < 0.05, Bonferroni correction) as shown in Fig. 1. Those ICs exhibited reduced within-IC FC against aging, and are spatially distributed primarily at the temporal, frontal, the genu of the corpus callosum (CC), and midbrain areas. From 780 possible connections (upper diagonal part of the 40 × 40 FC matrix), we identified 375 pairs of ICs whose FC decreased significantly with age, as shown in the left panel of Fig. 2. Interestingly, IC 5 is involved in the top 8 connections that showed most significant reductions in FC. By contrast, there are only 9 connections characterized by increased FC over age, where the most significant change was identified between two ICs at the posterior part of the brain. The radar charts in Fig. 3 show the relationship between age and three local network metrics, including cluster coefficients, efficiency, and strength. We observed that all forty ICs exhibited reduced metrics over age, and the most significant changes are consistently identified in five ICs that are distributed at frontal areas of the brain. From the lower right panel of Fig. 3, we observed that the global efficiency of the network decreased significantly whereas the characteristic path length increased significantly over age. As shown in Fig. 4, three sub-circuits were detected by Louvain’s approach6, representing the anterior, posterior, and inferior parts of the brain. The within- and between-circuits FCs in general decreased with age but were heterogeneous in their trajectories.Discussions
The findings regarding the within-IC FC suggest that the frontal and temporal WM regions are more affected by aging. Previous works have reported that age-related changes showed the greatest effects in the frontal lobe, followed by the temporal lobe in many aspects but predominantly characterized by loss of cortical volumes7. One possible explanation is that the loss of neurons might require lower demand for communications among WM voxels, leading to the reduced within-IC FC therein. In addition, we observed that nearly half of inter-IC connections exhibit decreases in FC with aging, while only a few, predominantly short-range connections between specific posterior regions, show an increasing trend. Similarly, as reported in previous literature, FC decreased among most GM regions and increased only among those within visual networks8. On a larger scale, the graph metrics indicate a widespread reduction across nearly all regions, among which five frontal ICs appear to be most affected by aging, again confirming the sensitivity of the frontal brain to aging. Moreover, the global information exchange significantly decreases with aging, and the line fit exhibited a noticeable inflection point at around the 7th decade. This is consistent with the notion that most significant loss of neurons occurs after 70 years of age9, possibly leading to an accelerated reduction of communications between WM regions.Conclusion
We conducted a comprehensive quantification of age-related BOLD changes in WM from microscopic to macroscopic scales using a data-driven approach. We observed significant reductions in functional integrity in specific areas and widespread changes in network communication. This work provides a unique way to characterize functional changes in the process of aging and promises to be a prelude to studies of specific disorders and pathology.Acknowledgements
This work was supported by the National Institutes of Health (NIH) grant RF1 MH123201 (J.C.G & B.A.L), R01 NS113832 (J.C.G), and Vanderbilt Discovery Grant FF600670 (Y.G). Imaging data were provided by OASIS-3: Longitudinal Multimodal Neuroimaging: Principal Investigators: T. Benzinger, D. Marcus, J. Morris; NIH P30 AG066444, P50 AG00561, P30 NS09857781, P01 AG026276, P01 AG003991, R01 AG043434, UL1 TR000448, R01 EB009352.References
1. Ding, Z., Huang, Y., Bailey, S.K., Gao, Y., Cutting, L.E., Rogers, B.P., Newton, A.T., Gore, J.C., 2018. Detection of synchronous brain activity in white matter tracts at rest and under functional loading. Proceedings of the National Academy of Sciences 115, 595 LP – 600.
2. Li, M., Newton, A.T., Anderson, A.W., Ding, Z., Gore, J.C., 2019. Characterization of the hemodynamic response function in white matter tracts for event-related fMRI. Nat Commun 10, 1140.
3. LaMontagne, P.J., Benzinger, T.L.S., Morris, J.C., Keefe, S., Hornbeck, R., Xiong, C., Grant, E., Hassenstab, J., Moulder, K., Vlassenko, A.G., Raichle, M.E., Cruchaga, C., Marcus, D., 2019. OASIS-3: Longitudinal Neuroimaging, Clinical, and Cognitive Dataset for Normal Aging and Alzheimer Disease. medRxiv 2019.12.13.19014902
4. Huang, Y., Yang, Y., Hao, L., Hu, X., Wang, P., Ding, Z., Gao, J.H., Gore, J.C., 2020. Detection of functional networks within white matter using independent component analysis. Neuroimage 222, 117278.
5. Power, J.D., Mitra, A., Laumann, T.O., Snyder, A.Z., Schlaggar, B.L., Petersen, S.E., 2014. Methods to detect, characterize, and remove motion artifact in resting state fMRI. Neuroimage 84, 320–341.
6. Blondel, V.D., Guillaume, J.-L., Lambiotte, R., Lefebvre, E., 2008. Fast unfolding of communities in large networks. Journal of Statistical Mechanics: Theory and Experiment 2008, P10008.
7. Bartzokis, G., Beckson, M., Lu, P.H., Nuechterlein, K.H., Edwards, N., Mintz, J., 2001. Age-Related Changes in Frontal and Temporal Lobe Volumes in Men: A Magnetic Resonance Imaging Study.
8. Zonneveld, H.I., Pruim, R.H.R., Bos, D., Vrooman, H.A., Muetzel, R.L., Hofman, A., Rombouts, S.A.R.B., van der Lugt, A., Niessen, W.J., Ikram, M.A., Vernooij, M.W., 2019. Patterns of functional connectivity in an aging population: The Rotterdam Study. Neuroimage 189, 432–444.
9. Scahill, R.I., Frost, C., Jenkins, R., Whitwell, J.L., Rossor, M.N., Fox, N.C., 2003. A Longitudinal Study of Brain Volume Changes in Normal Aging Using Serial Registered Magnetic Resonance Imaging. Arch Neurol 60, 989–994.
Figures