3024
White matter tract integrity metrics sensitive to white matter microstructural changes and cognitive performance in type 2 diabetic patients1Shaanxi Provincial People’s Hospital, Xi’an, China, 2Philips Healthcare, Xi’an, China
Synopsis
Keywords: White Matter, Diabetes
This study aims to use white matter tract integrity (WMTI) model based on DKI to explore white matter alternations in T2DM. DTI and WMTI metrics were compared between 73 T2DM patients and 57 HCs. The widespread increased extra-axonal diffusivity with limited increased intra-axonal diffusivity in T2DM reflected different degrees of axonal edema, vasogenic edema and/or demyelination. De,⊥ (radial extra-axonal diffusivity) was demonstrated to be the most sensitive parameter in detecting the white matter microstructural changes. De,⊥ in genu of the corpus callosum was correlated with attention performance, which is expected to be a imaging marker reflecting cognitive impairment in T2DM.Introduction
Type 2 diabetes mellitus (T2DM) has emerged as an important risk factor for cognitive impairment and dementia1-2. Increasing diffusion tensor imaging (DTI) studies have demonstrated that white matter microstructural abnormalities play an important role in type 2 diabetes mellitus-related cognitive impairment3-5. However, the information provided by DTI was limited. White matter tract integrity (WMTI) is an advanced diffusion model based on diffusion kurtosis imaging (DKI) that evaluates white matter integrity through quantification of axonal water fraction (AWF), intra-axonal diffusivity (Daxon), radial diffusivity of the extra-axonal space (De,⊥), axial diffusivity of the extra-axonal space (De,∥)6. This study aims to explore whether WMTI metrics are more sensitive to white matter changes and cognitive performance in T2DM.Methods
This study was approved by the local institutional review board. Subjects: 73 T2DM patients (55.64±7.65 years old, 18 females) and 57 healthy controls (54.18±5.64 years old, 19 females) who underwent MRI were enrolled. A battery of neuropsychological tests including Montreal Cognitive Assessment(MoCA), Mini-Mental State Examination(MMSE), Trail-Making Test A (TMT-A), Trail-Making Test B (TMT-B), Auditory Verbal Learning Test (AVLT) and Clock Drawing Task (CDT) were performed. MRI acquisition: Conventional MRI and DKI were performed on a 3.0T scanner (Ingenia, Philips Medical Systems, The Netherlands). DKI protocols were: 32 directions, b value=0, 1000, 2000 s/mm2, TR/TE=6000/150ms, slice thickness= 6 mm, field of view = 224mm×224mm, matrix = 112×112, NEX = 1. Image analysis: All DKI data were processed using a custom-written program in MATLAB, and all parameters (FA=fractional anisotropy, MD=mean diffusivity, AD=axial diffusivity, RD=radial diffusivity, AWF, Daxon, De,∥ and De,⊥) were generated. FMRIB’s Software Library (FSL) with tract-based spatial statistics (TBSS, part of FSL) was used to analyze all the above diffusional metrics and compare group differences with age and gender as covariates. ROI analysis was also performed based on the Johns Hopkins University WM label atlas. The ROI-based comparison between the T2DM and the HC groups was further performed in regions that showed significant differences in the above TBSS analysis. The correlations between DTI and WMTI metrics within the resultant ROIs and neuropsychological assessment scores, disease duration and HbA1c levels in T2DM patients were analyzed by using multiple linear regression analyses, with age, sex, and years of education as the covariates. The Bonferroni correction was applied to correct for multiple comparisons. All tests were taken to be significant at P<0.05.Results
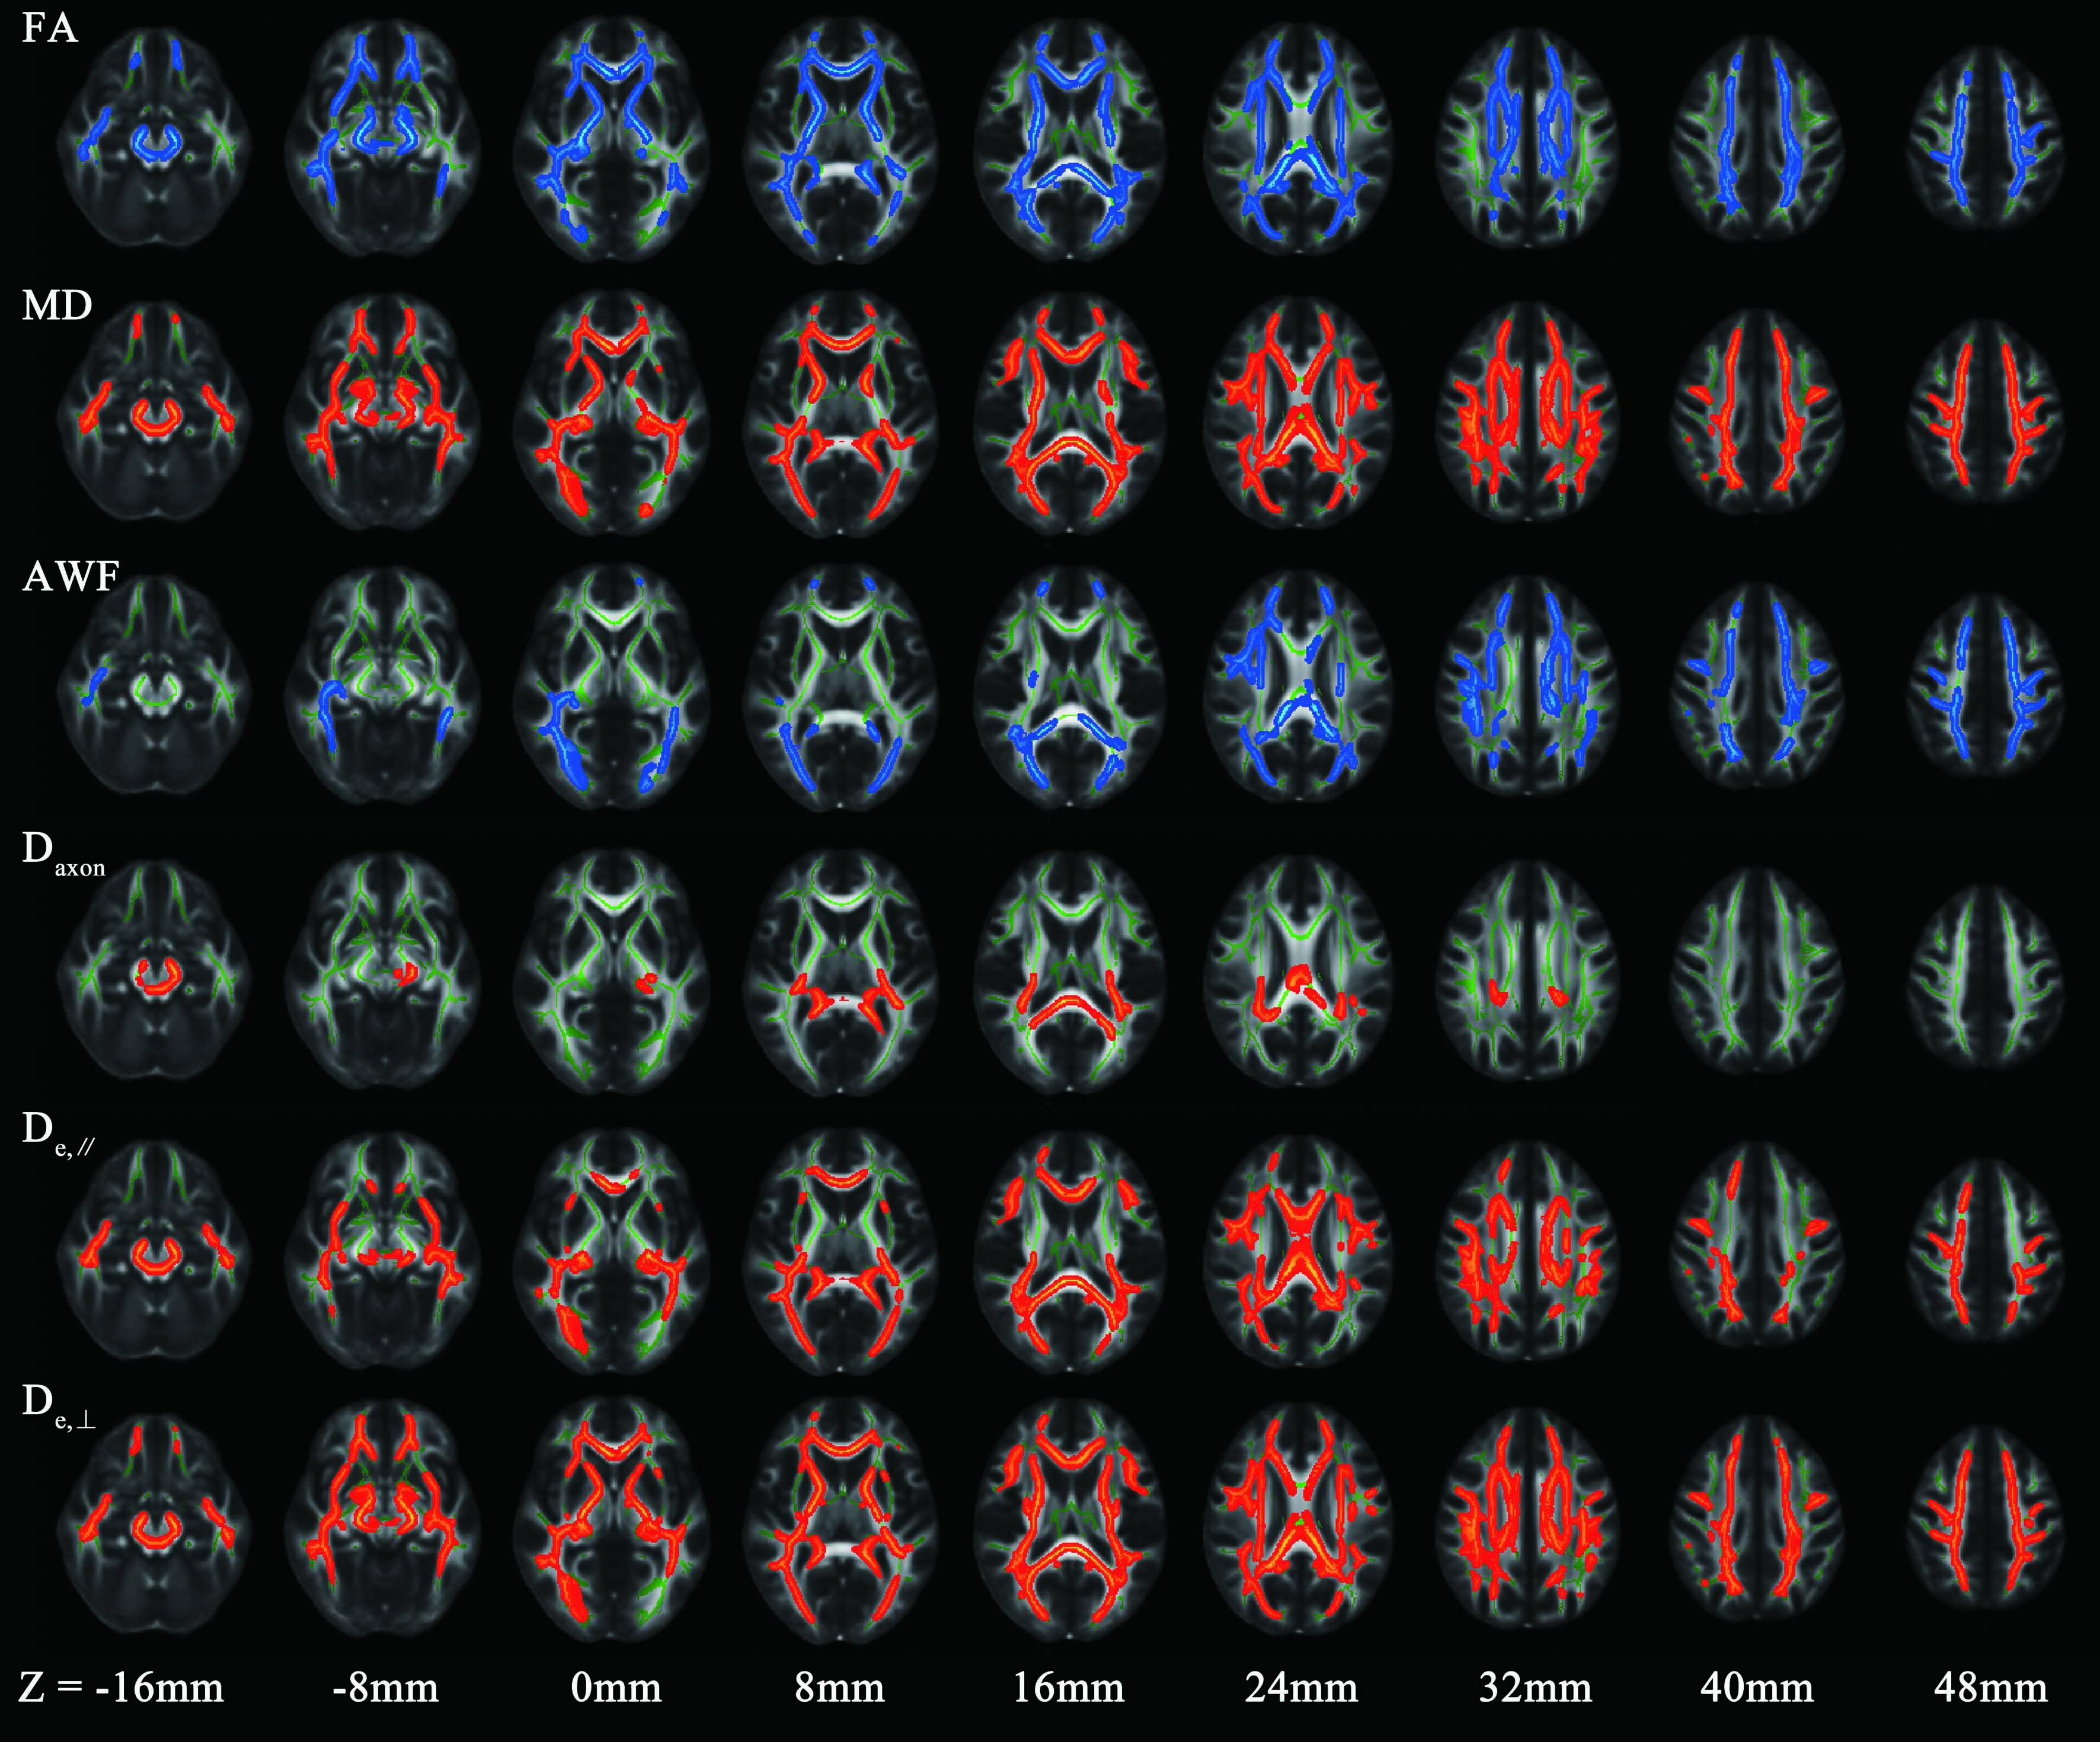
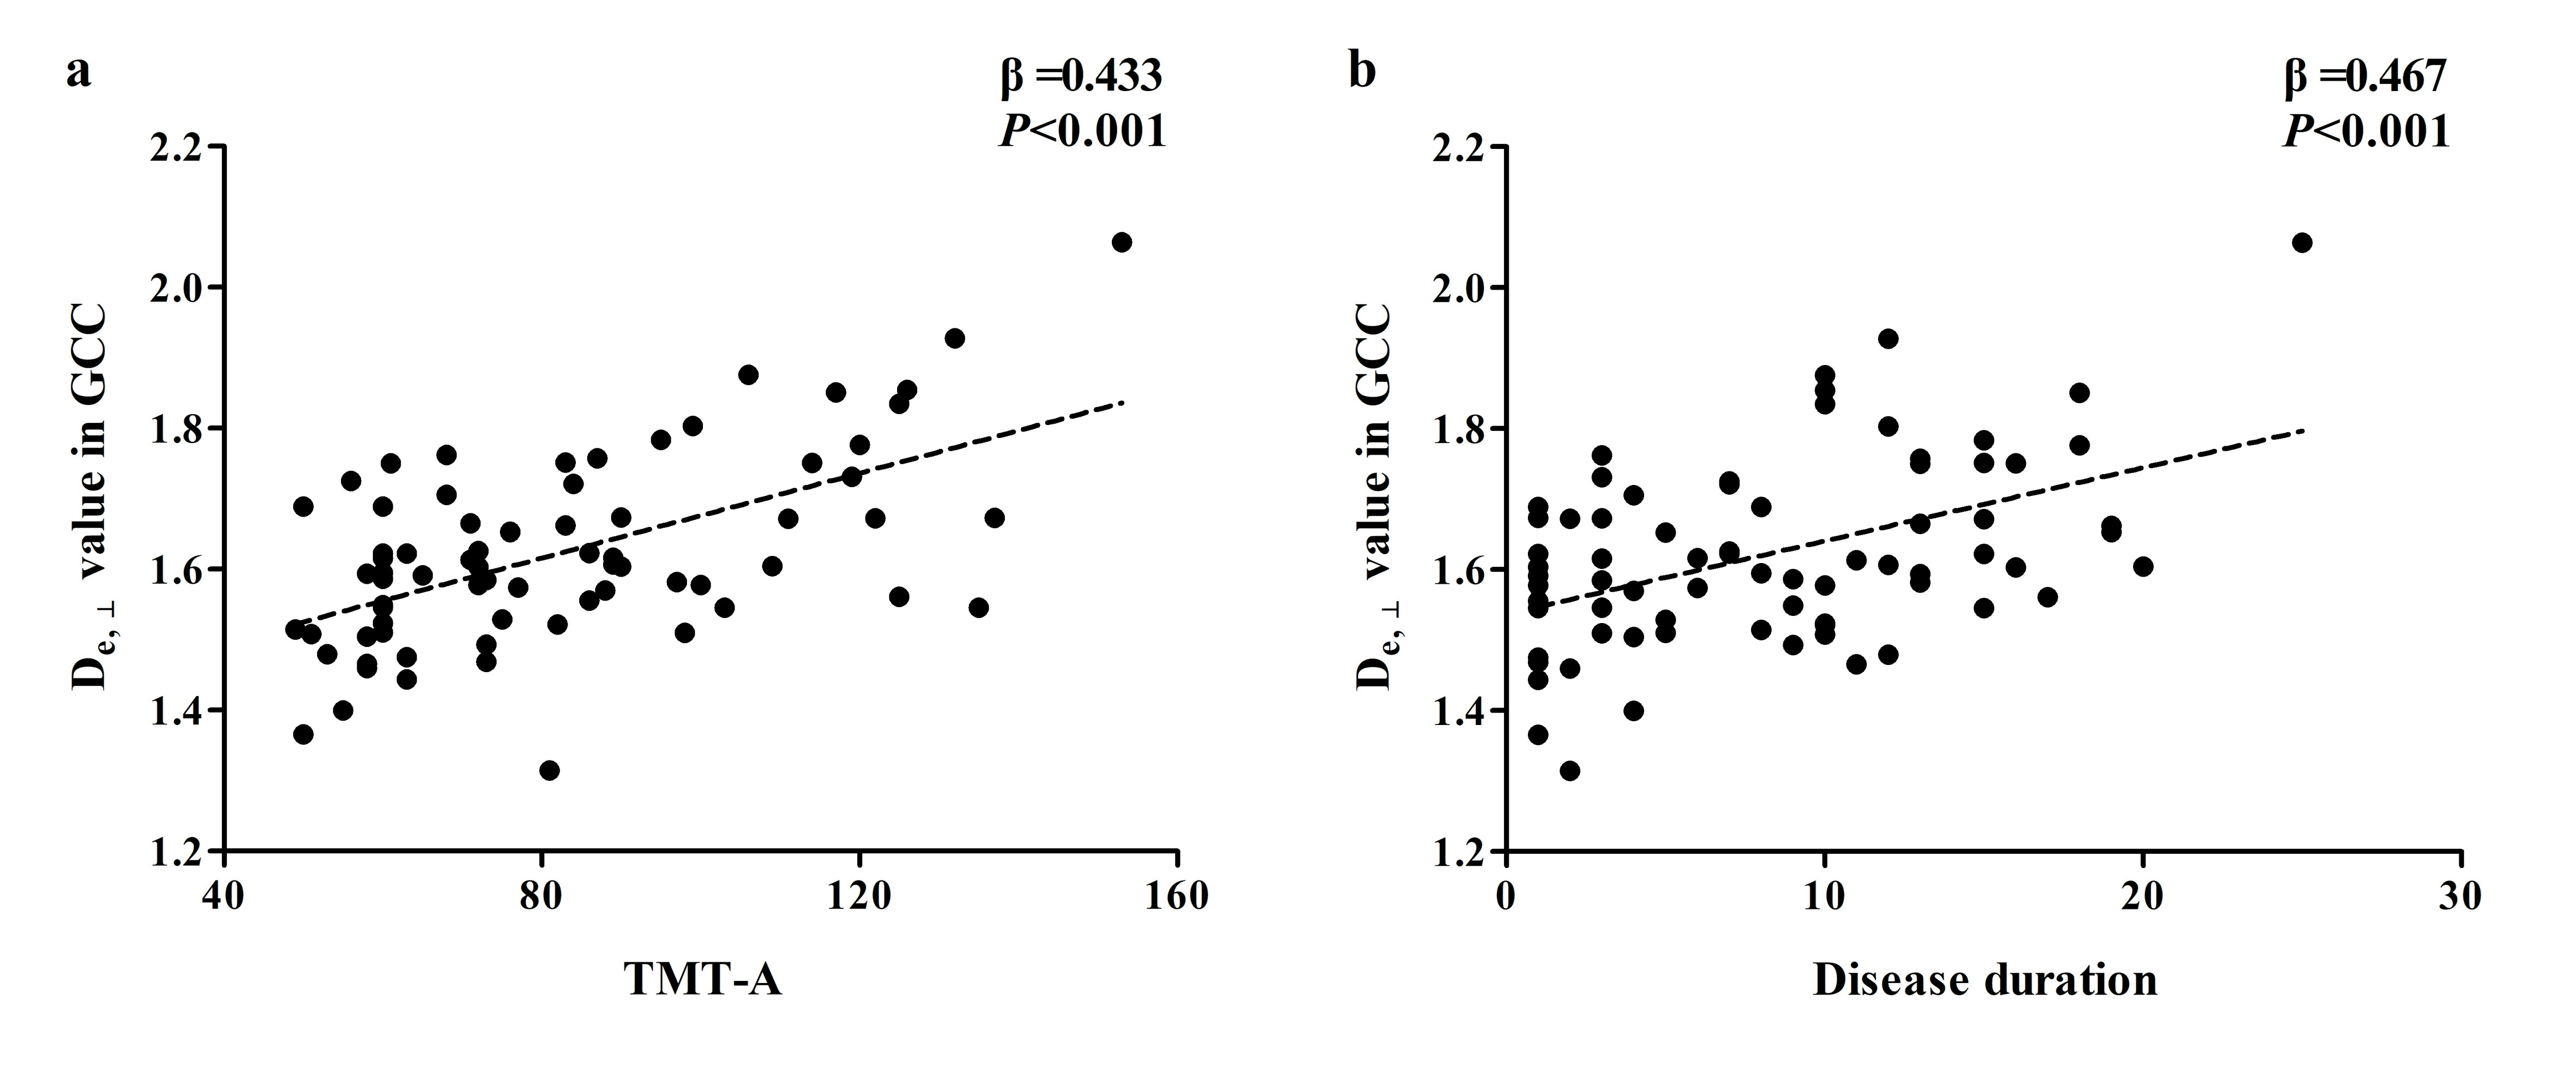
T2DM patients showed poorer performance in general cognitive function (MMSE, P=0.016; MoCA, P<0.001), and also worse cognitive domains in attention (TMT-A, P=0.035), executive function (TMT-B, P=0.006) and episodic memory (AVLT, P=0.018) than HC subjects. In TBSS analysis, the T2DM group exhibited significant deceased FA, AWF, and increased MD, Daxon, De,∥ and De,⊥ in widespread WM regions (shown in Fig.1). De,⊥ detected most WM changes(43.83%,26379/60190 voxels)), which mainly located in the whole corpus callosum, internal capsule, external capsule, corona radiata, posterior thalamic radiations, sagittal stratum, cingulum, fornix(stria terminalis), superior longitudinal fasciculus and unciform fasciculus(P< 0.05, TFCE corrected). Furthermore, the number of labeled significant tracts in De,⊥ was also more than FA and MD. Notably, some crossing fibers such as the pontine crossing tract, left superior longitudinal fasciculus and right unciform fasciculus also presented changes in De,⊥ but not in FA or MD. Correlations analysis showed higher De,⊥ in the genu of the corpus callosum (GCC) was significantly correlated with worse performance in TMT-A (β = 0.433, P<0.001) and longer disease duration (β = 0.467, P<0.001), as shown in Fig.2.Discussion
In the present study, multiple diffusional metrics were employed to detect WM microstructural changes in T2DM patients. Elevated De,∥ and De,⊥ in widespread WM regions in T2DM patients indicated an increased diffusivity from extra-axonal space, which might be due to vasogenic edema and/or demyelination changes. Whereas Elevated Daxon in some limited WM regions indicated axonal edema, which might reflect more severe or long-term damages. According to our results, WMTI metrics can detect more WM changes than DTI metrics, and De,⊥ seemed to be the most sensitive metric in revealing WM microstructural disruptions. Furthermore, our results showed correlations between increased De,⊥ in GCC and worse performance in attention and longer disease duration. It is possible that white matter structural abnormalities occur and develop as diabetes progresses. And lower scores of attention performance indicate more severe impairment, which may be caused by axon damage (increased Daxon) accompanied with demyelination (increased De,∥ and De,⊥) in GCC.Conclusion
WMTI metrics are more sensitive in detecting white matter microstructural abnormalities in T2DM than DTI metrics, especially in the crossing fibers. Changes in WMTI metrics may indicate different degrees of axonal edema, vasogenic edema and/or demyelination changes. De,⊥ is expected to be an imaging marker reflecting cognitive impairment in T2DM.Acknowledgements
This work was supported by National Natural Science Foundation of China (No. 81270416). We would like to thank Philips Applied Science Lab for their technical assistance. Finally, we thank all participants and their parents for their loyalty and cooperation.References
1. Moheet A, Mangia S, Seaquist ER. Impact of diabetes on cognitive function and brain structure. Ann N Y Acad Sci 2015; 1353:60-71.
2. Damanik J, Yunir E. Type 2 Diabetes Mellitus and Cognitive Impairment. Acta Med Indones 2021; 53(2):213-220.
3. Antal B, McMahon LP, Sultan SF, Lithen A, Wexler DJ, Dickerson B, et al. Type 2 diabetes mellitus accelerates brain aging and cognitive decline: Complementary findings from UK Biobank and meta-analyses. Elife 2022; 11: e73138.
4. Zhou C, Li J, Dong M, Ping L, Lin H, Wang Y, et al. Altered White Matter Microstructures in Type 2 Diabetes Mellitus: A Coordinate-Based Meta-Analysis of Diffusion Tensor Imaging Studies. Front Endocrinol (Lausanne) 2021; 12:658198.
5. Alotaibi A, Tench C, Stevenson R, Felmban G, Altokhis A, Aldhebaib A, et al. Investigating Brain Microstructural Alterations in Type 1 and Type 2 Diabetes Using Diffusion Tensor Imaging: A Systematic Review. Brain Sci 2021; 11(2):140.
6. Fieremans E, Jensen JH, Helpern JA. White matter characterization with diffusional kurtosis imaging. Neuroimage. 2011;58(1):177-188.
Figures