3021
Diffusion MRI tractometry findings in Dystonia: a UK Biobank Study
Claire L. MacIver1,2, Chantal M.W. Tax2,3, Derek K Jones2, Ann-Kathrin Schalkamp4, Cynthia Sandor4, Grace Bailey5, Megan Wadon5, and Kathryn J Peall5
1Neuroscience and Mental Health Research Institute,, Cardiff University, Cardiff, United Kingdom, 2Cardiff University Brain Imaging Centre, Cardiff University, Cardiff, United Kingdom, 33Image Sciences Institute, University Medical Centre Utrect, Utrect, Netherlands, 4UK Dementia Research Institute, Cardiff University, Cardiff, United Kingdom, 5Neuroscience and Mental Health Research Institute, Cardiff University, Cardiff, United Kingdom
1Neuroscience and Mental Health Research Institute,, Cardiff University, Cardiff, United Kingdom, 2Cardiff University Brain Imaging Centre, Cardiff University, Cardiff, United Kingdom, 33Image Sciences Institute, University Medical Centre Utrect, Utrect, Netherlands, 4UK Dementia Research Institute, Cardiff University, Cardiff, United Kingdom, 5Neuroscience and Mental Health Research Institute, Cardiff University, Cardiff, United Kingdom
Synopsis
Keywords: White Matter, Diffusion/other diffusion imaging techniques, movement disorders
Dystonia is a hyperkinetic disorder involving uncontrolled muscle contractions. Brain motor networks have been implicated, with heterogenous methodology and findings in the existing diffusion MRI literature. We compared diffusion findings in white matter motor pathways in dystonia (n=76) and healthy controls (n=311) derived from the UK biobank, assessing differing preprocessing and analysis approaches. An in-house pipeline identified localised tractometry MD and kurtosis differences in cerebellar peduncles, thalamic radiations and thalamo-premotor tracts in dystonia, findings not replicated using differing analysis and preprocessing approaches. Overall, localised white matter differences are implicated in dystonia, with the impact of methodology on group-level findings highlighted.Introduction
Dystonia is a hyperkinetic movement disorder involving repetitive or sustained muscle contractions, causing pain and impairing function. Pathophysiological understanding is limited, although multimodal imaging, animal models and human histopathological work has implicated key motor regions and their interconnecting pathways, with network dysfunction and impaired inhibitory processes appearing contributory. Investigations using diffusion MRI (dMRI) have varied greatly in their methodology, and resulted in mixed findings in dystonia cohorts, although differences in cerebellar white matter projections and white matter deep to the primary sensory-motor cortices are relatively consistently highlighted (cite lit review). This variability in methodology is highly relevant, with evidence of differing methodology resulting on significant differences in within-subject results obtained(1). The UK Biobank is a prospective database with >500,000 participants, with brain MRI undertaken in a proportion (n=42,565)(2). This study uses data collected by the UK biobank to compare diffusion MRI findings in key implicated white matter pathways between those diagnosed with dystonia and unaffected controls, additionally assessing whether employment of differing preprocessing and analysis approaches have a fundamental impact on findings at the group level.Methods
The dystonia cohort with dMRI data was identified from those individuals in the UK Biobank database derived using hospital (ICD-10) and primary care (Read codes) data(3), with an additional 1:4 age and gender matched control cohort. Branches of analysis (figure 1) consisted of 1)UK Biobank directly derived tract mean FA and MD (probabilistic tractography and TBSS approaches); 2) UK Biobank pre-preprocessing(4) with local analysis using FA and MD maps (tractography and tractometry), and 3) local preprocessing(5-9) and analysis including diffusion kurtosis estimation(10), tractography and tractometry (with 20 segments per tract)(11, 12)). For parts 1 and 2, FA and MD were assessed; for part 3 MK, AK and RK were additionally assessed. Tracts analysed for parts 2 and 3 are shown in figure 2, with a subset of tracts available for the directly derived parameters. A comparison between the whole cohort and healthy controls, and those with cervical dystonia and healthy controls, was undertaken using linear regression models. Bonferroni multiple comparison correction was undertaken for parameters only.Results
76 dystonia cases met the inclusion criteria, with 311 age and gender matched controls derived. Median age of the patient group was 64 (SD 8.87), and control group 64 (SD 8.91), and male to female ratio 1:1.437 for both groups (figure 3). The biggest subgroup of a specific dystonia type was cervical dystonia, with 41 individuals. No significant differences following correction for multiple comparison were seen for the TBSS or probabilistic tractography results using the UK biobank directly derived data (1a and 1b), or for the tractography analyses using the UK biobanks original preprocessing approach (2a) or utilising our bespoke preprocessing pipeline (3a). For the tractometry analysis, the following tracts demonstrated at least three contiguous segments to significant differences for our own preprocessing pipeline (3b), but not when using the UK biobank original preprocessing (2b) (see figures 4&5) in cerebellar peduncles, thalamic radiations and striato-premotor and thalamo-premotor tracts. Specifically, differences seen included: left inferior cerebellar peduncle (lower MD, AK and RK), right inferior cerebellar peduncle (lower AK), left superior cerebellar peduncle (lower MD and MK), left anterior thalamic radiation (lower AK and MK), left superior thalamic radiation (lower AK), left thalamopremotor tract (lower MD), right thalamopremotor tract (lower AK), right striatopremotor tract (lower AK), and the right optic radiation (lower RK). Amongst the cervical dystonia cohort compared to controls, there was significantly lower RK in the left inferior cerebellar peduncle.Discussion
Overall, when applying our full bespoke processing and analysis pipeline, the tractometry approach identified significant differences between groups, particularly in measures of MD and kurtosis in the cerebellar peduncles, thalamic radiations and subcortical to cortical connections. These differences were not seen for the tractography approach, or when utilising alternative preprocessing or analysis methodology. This may reflect an ability of the optimised processing and analysis pipeline to identify more subtle, microstructural abnormalities, but there exists no histopathological validation that differences borne out of this approach enhance sensitivity to tissue microstructure, and it is therefore possible that the differences are a result of systematic bias. Findings in previous cohorts of cervical dystonia have been conflicting, though there has previously been implication of the key motor pathways showing FA and MD abnormalities, particularly in white matter in cerebellar outflow regions and in the white matter subcortical to sensorimotor cortex, and grey matter work has particularly implicated the cerebellum, thalami and basal ganglia in dystonia pathogenesis, pointing to a feasibility that the differences seen have clinical relevance. From the clinical perspective, future work in the field to validate these results in another dystonia cohort, alongside measures with more microstructural biological specificity is vital. Methodologically, future work to explore the underlying reasons for the impact of differing methodology on the detection of group-level differences is important.Conclusion
There is potential that the tractometry approach, in combination with optimised preprocessing steps, may enable the detection of more localised and subtle differences to be elucidated in dystonia cohorts compared to the other approaches evaluated, with implication of lower MD and kurtosis values in white matter motor pathways.Acknowledgements
This work is supported by an ABN/ Guarantors of Brain Clinical Research Training Fellowship (520286) and a Wellcome Trust translation of concept scheme (520958).References
1. Veraart j et al. A data-driven variability assessment of brain diffusion MRI preprocessing pipelines. Proceedings of the International Society of Magnetic Resonance in Medicine. 2022;30. 2. Bycroft C, et al. The UK Biobank resource with deep phenotyping and genomic data. Nature. 2018;562(7726):203-9. 3. Bailey GA, Rawlings A, Torabi F, Pickrell O, Peall KJ. Adult-onset idiopathic dystonia: A national data-linkage study to determine epidemiological, social deprivation, and mortality characteristics. European journal of neurology. 2022;29(1):91-104. 4. Alfaro-Almagro F, et al. Image processing and Quality Control for the first 10,000 brain imaging datasets from UK Biobank. NeuroImage. 2018;166:400-24. 5. Veraart J, Novikov DS, Christiaens D, Ades-aron B, Sijbers J, Fieremans E. Denoising of diffusion MRI using random matrix theory. NeuroImage. 2016;142:394-406. 6. Sairanen V, Leemans A, Tax CMW. Fast and accurate Slicewise OutLIer Detection (SOLID) with informed model estimation for diffusion MRI data. NeuroImage. 2018;181:331-46. 7. Andersson JLR, Sotiropoulos SN. An integrated approach to correction for off-resonance effects and subject movement in diffusion MR imaging. NeuroImage. 2016;125:1063-78. 8. Bammer R, et al. Analysis and generalized correction of the effect of spatial gradient field distortions in diffusion-weighted imaging. Magnetic Resonance in Medicine. 2003;50(3):560-9. 9. Rudrapatna U, Parker GD, Roberts J, Jones DK. A comparative study of gradient nonlinearity correction strategies for processing diffusion data obtained with ultra-strong gradient MRI scanners. Magn Reson Med. 2021;85(2):1104-13. 10. Veraart J, Van Hecke W, Sijbers J. Constrained maximum likelihood estimation of the diffusion kurtosis tensor using a Rician noise model. Magn Reson Med. 2011;66(3):678-86. 11. Wasserthal J, Neher P, Maier-Hein KH. TractSeg - Fast and accurate white matter tract segmentation. NeuroImage. 2018;183:239-53. 12. Wasserthal J, Maier-Hein KH, Neher PF, Northoff G, Kubera KM, Fritze S, et al. Multiparametric mapping of white matter microstructure in catatonia. Neuropsychopharmacology. 2020;45(10):1750-7.Figures
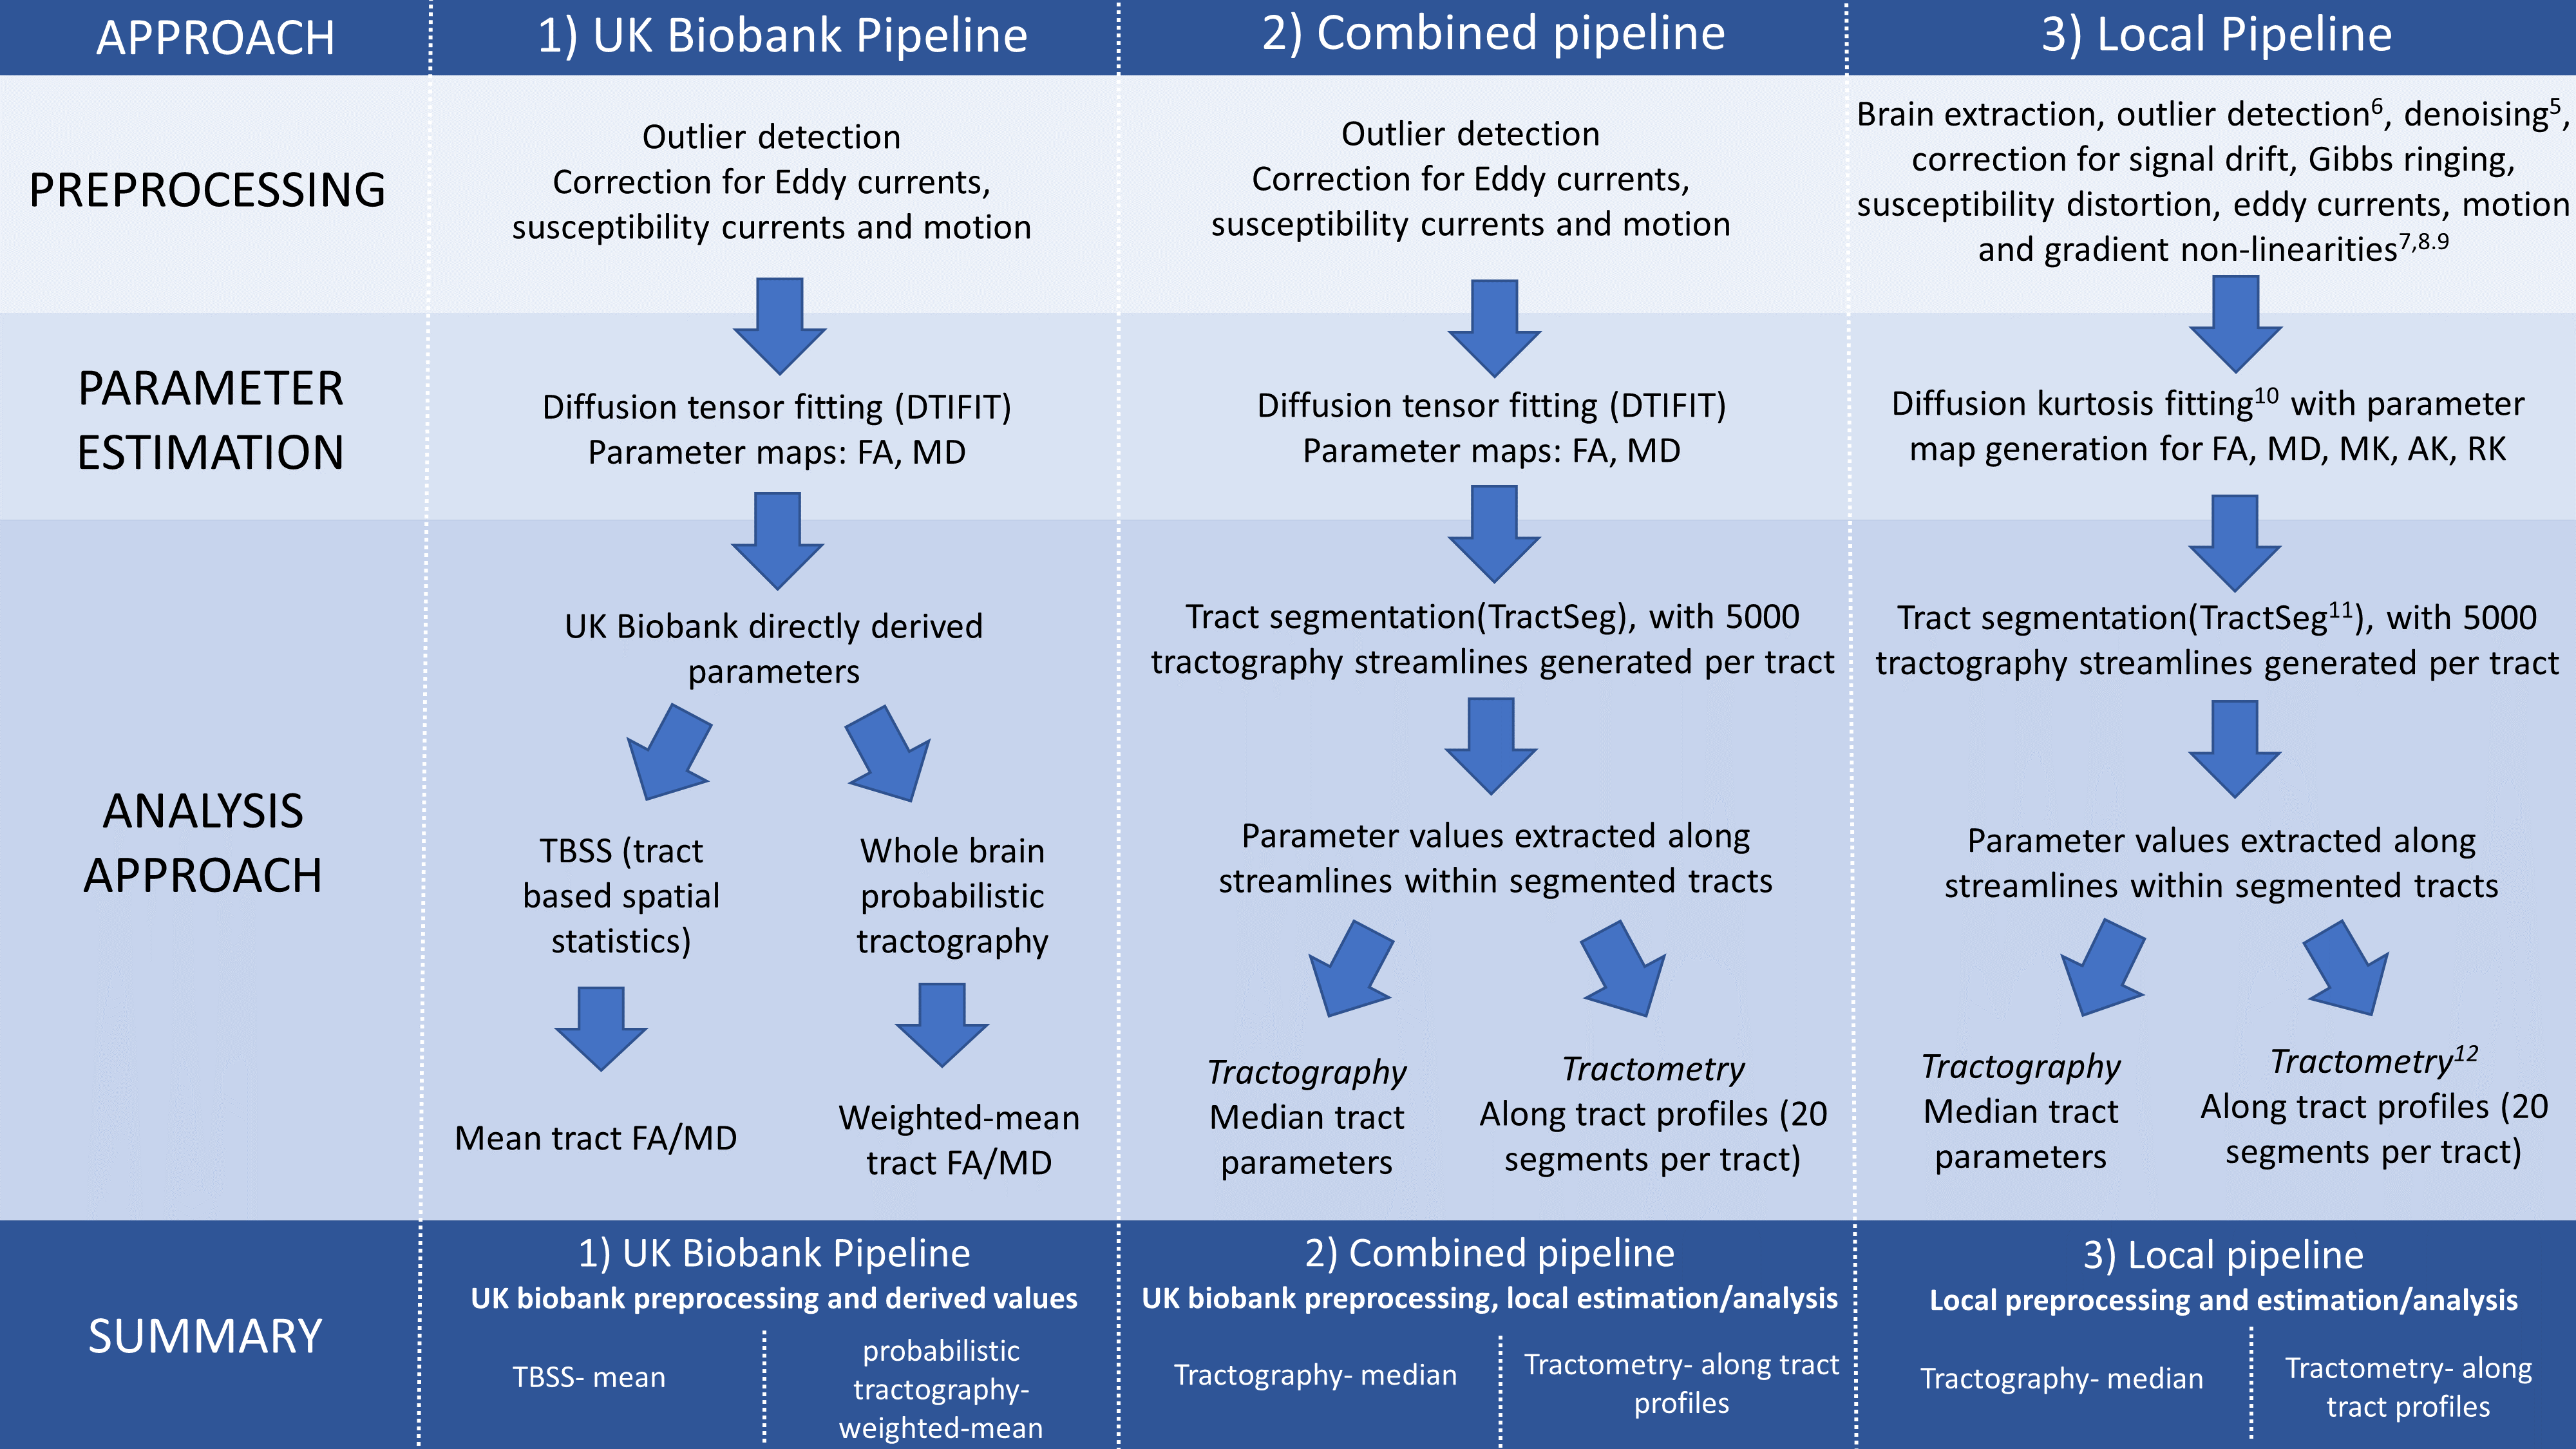
Figure 1: schematic describing the approaches assessed
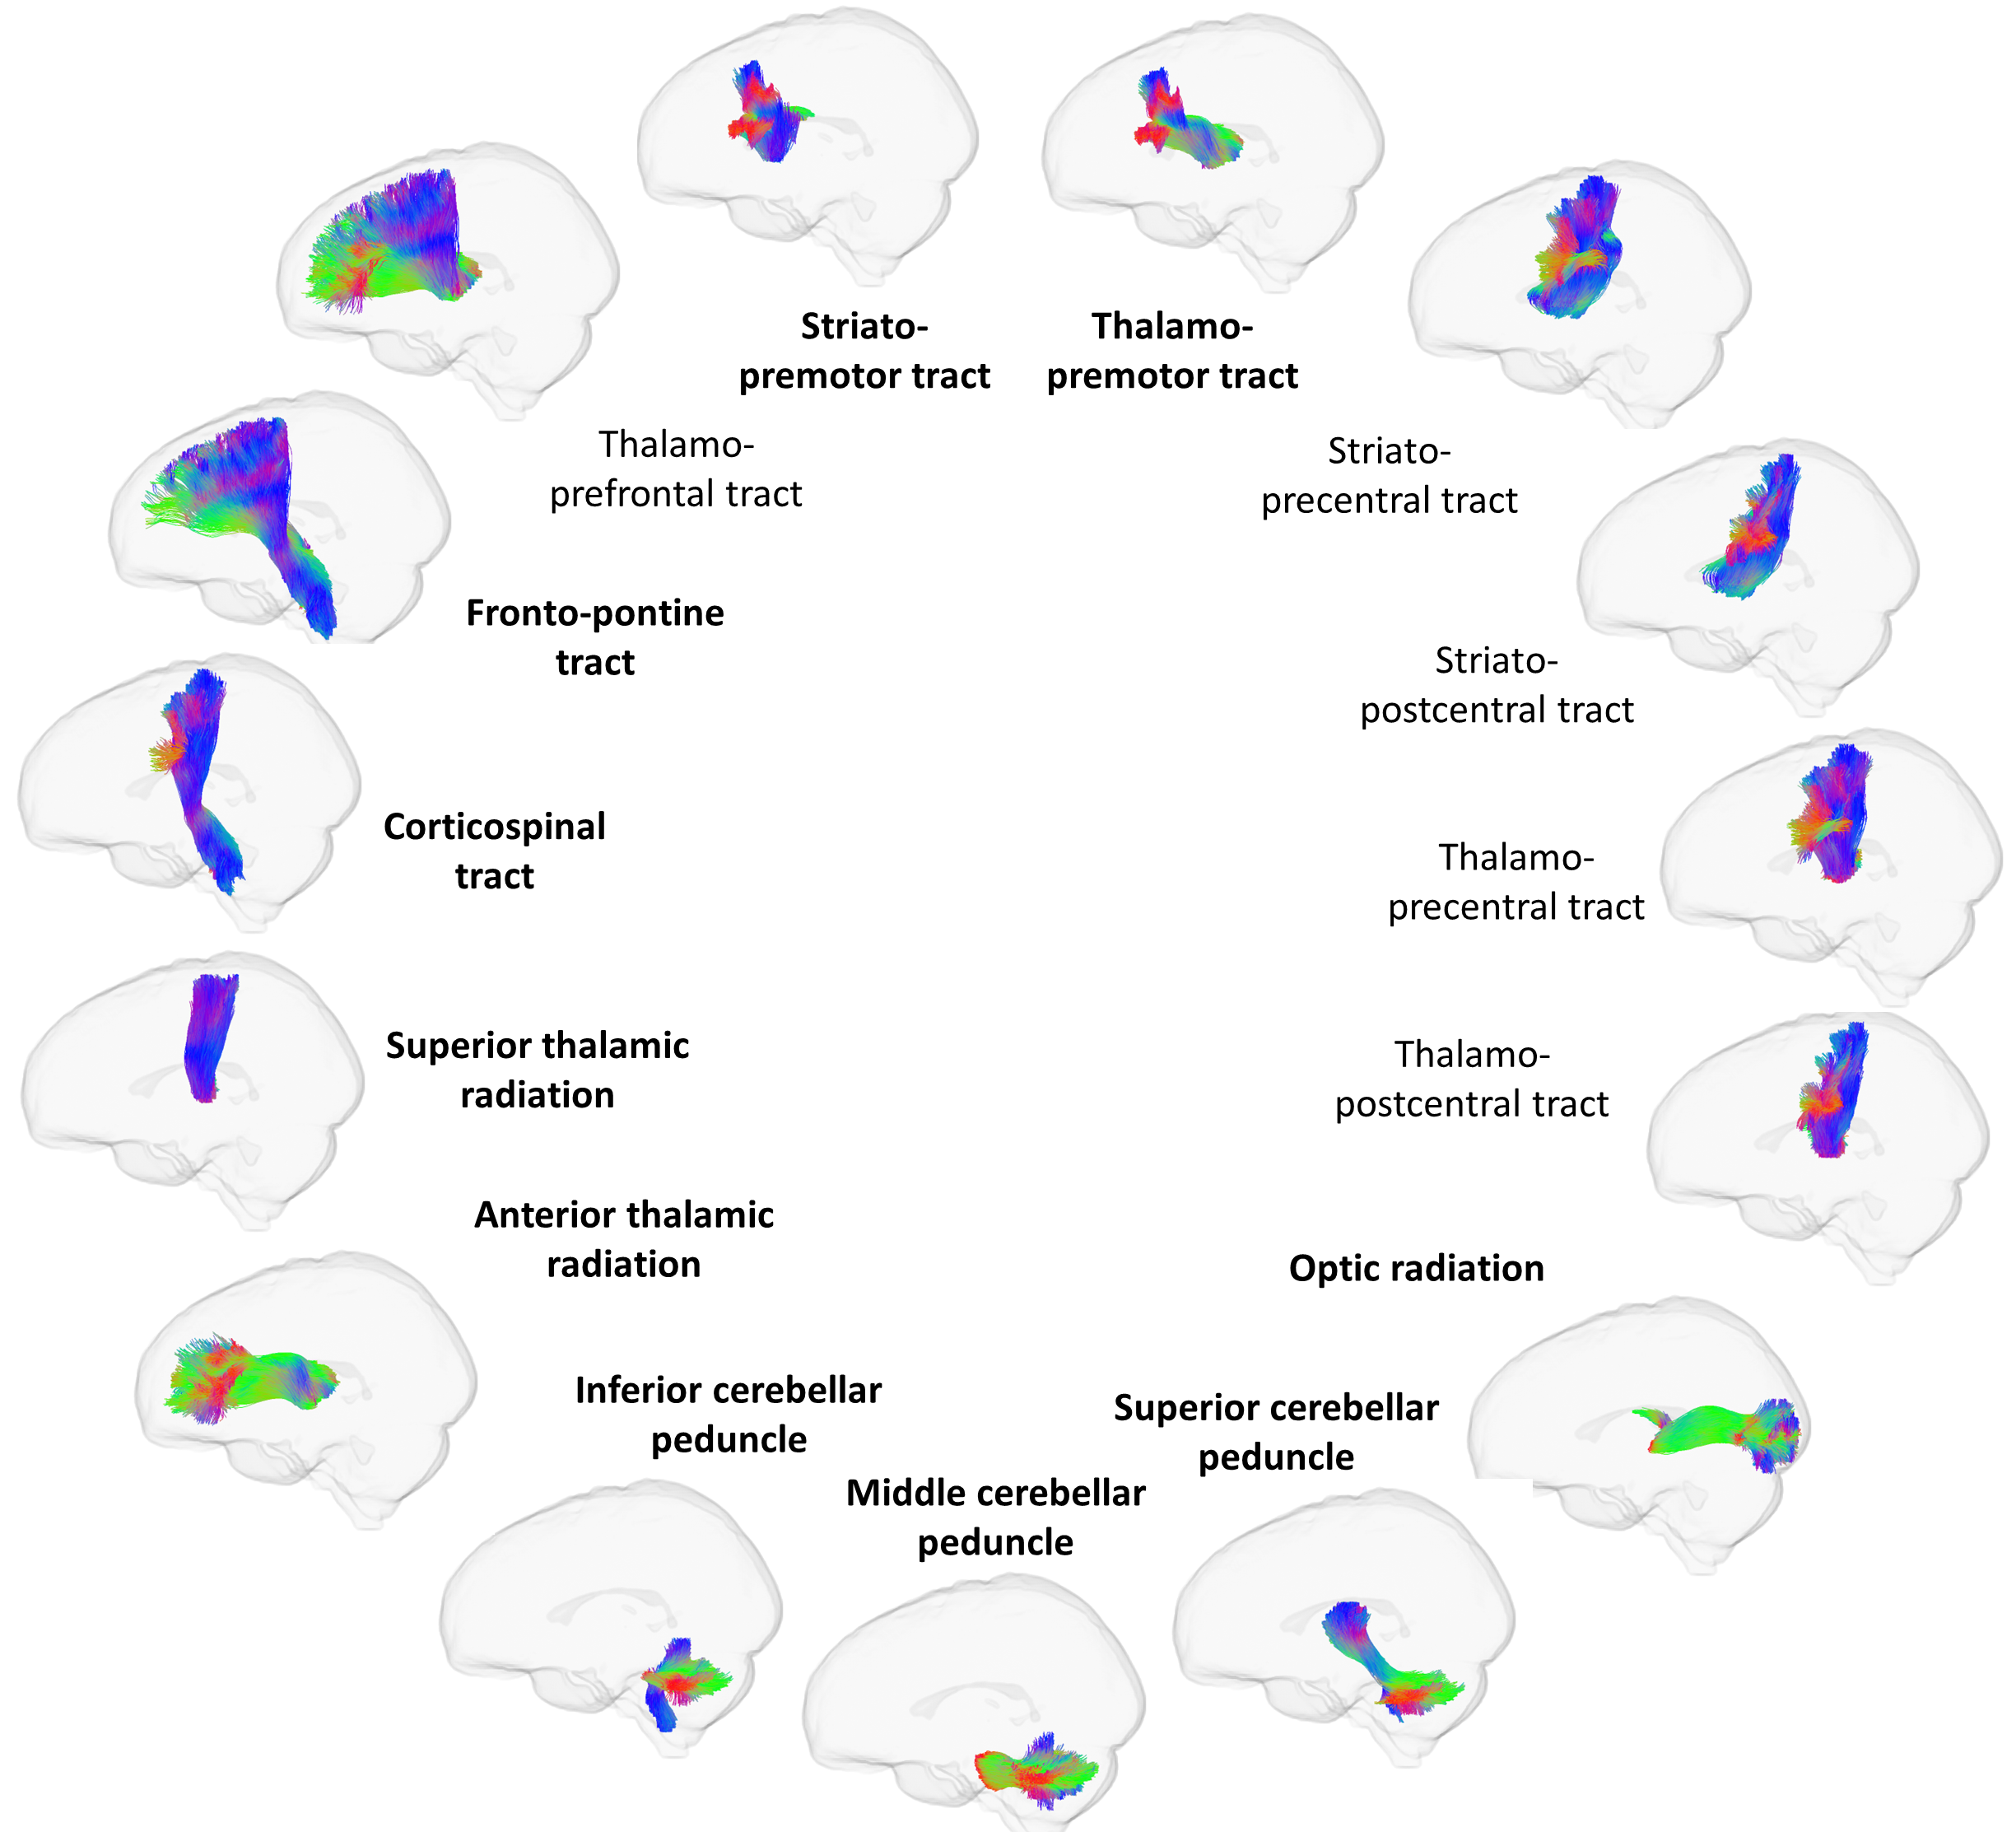
Figure 2: tracts included in analysis for tractography (all)
and tractometry (bold).
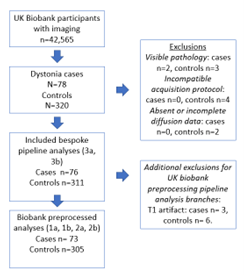
Figure 3: cohort derivation
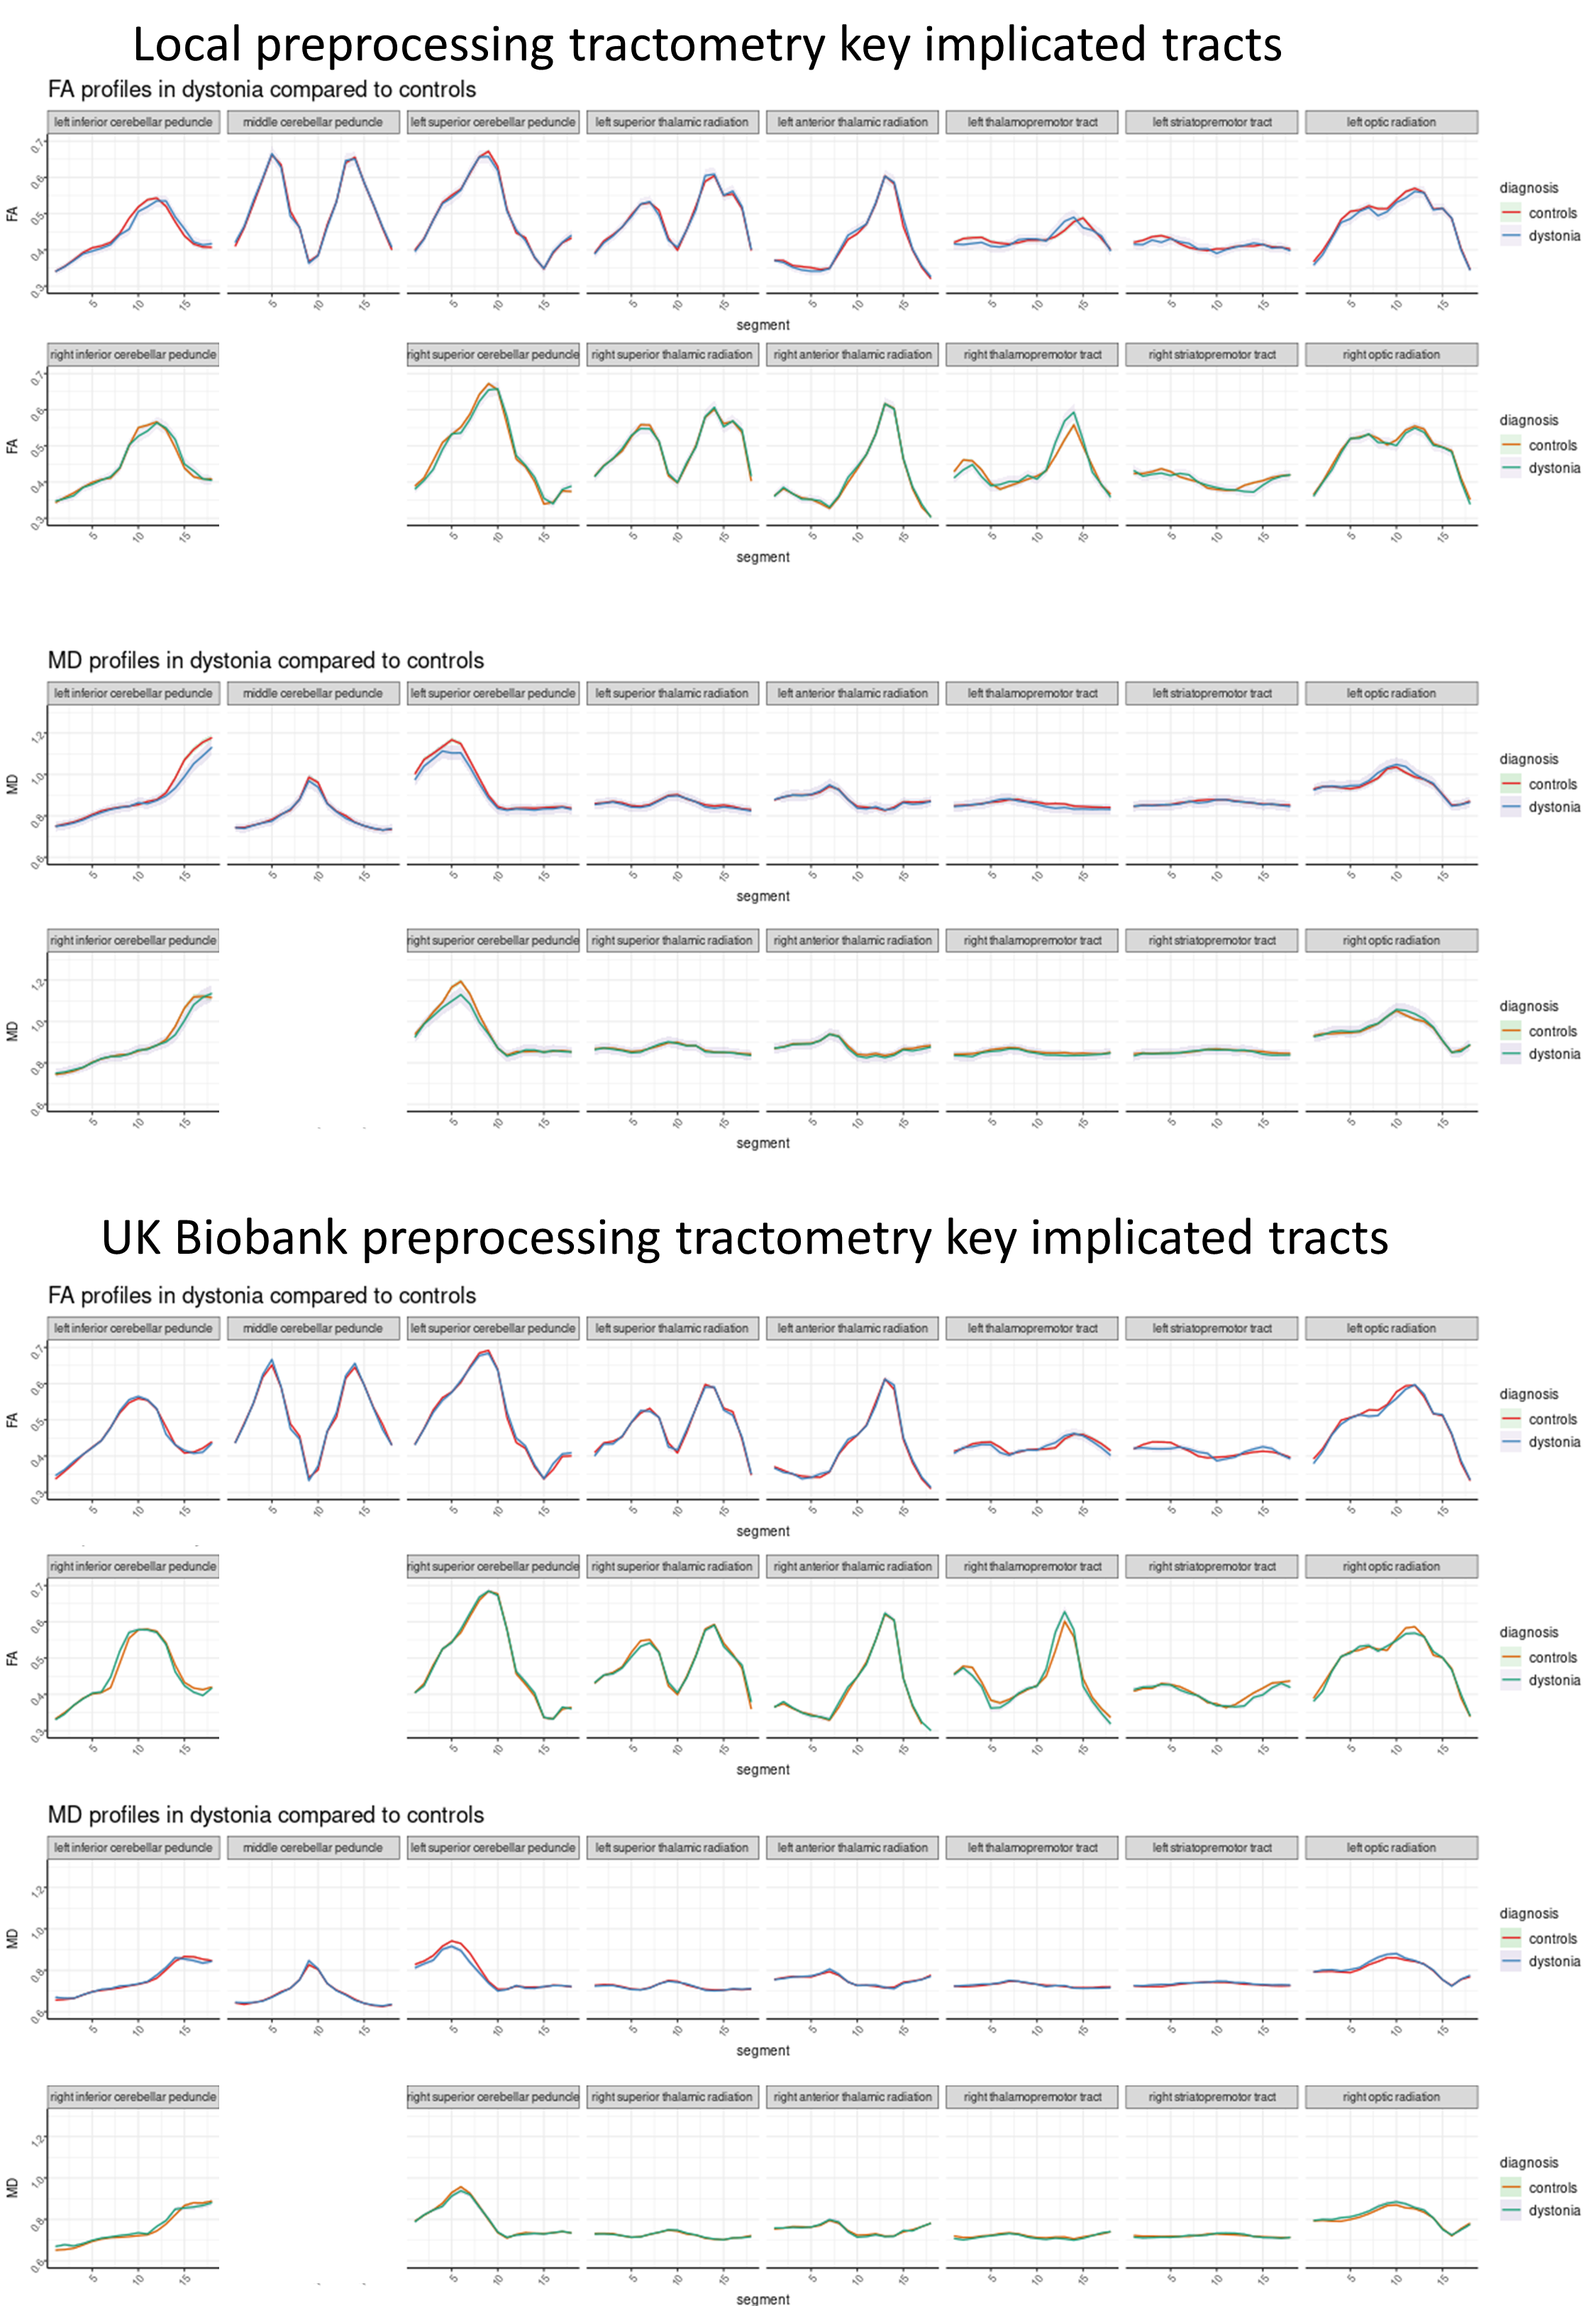
Figure 4: Tractometry FA and MD profiles for key tracts in
dystonia compared to controls using a) the original UK biobank preprocessing b)
the local preprocessing
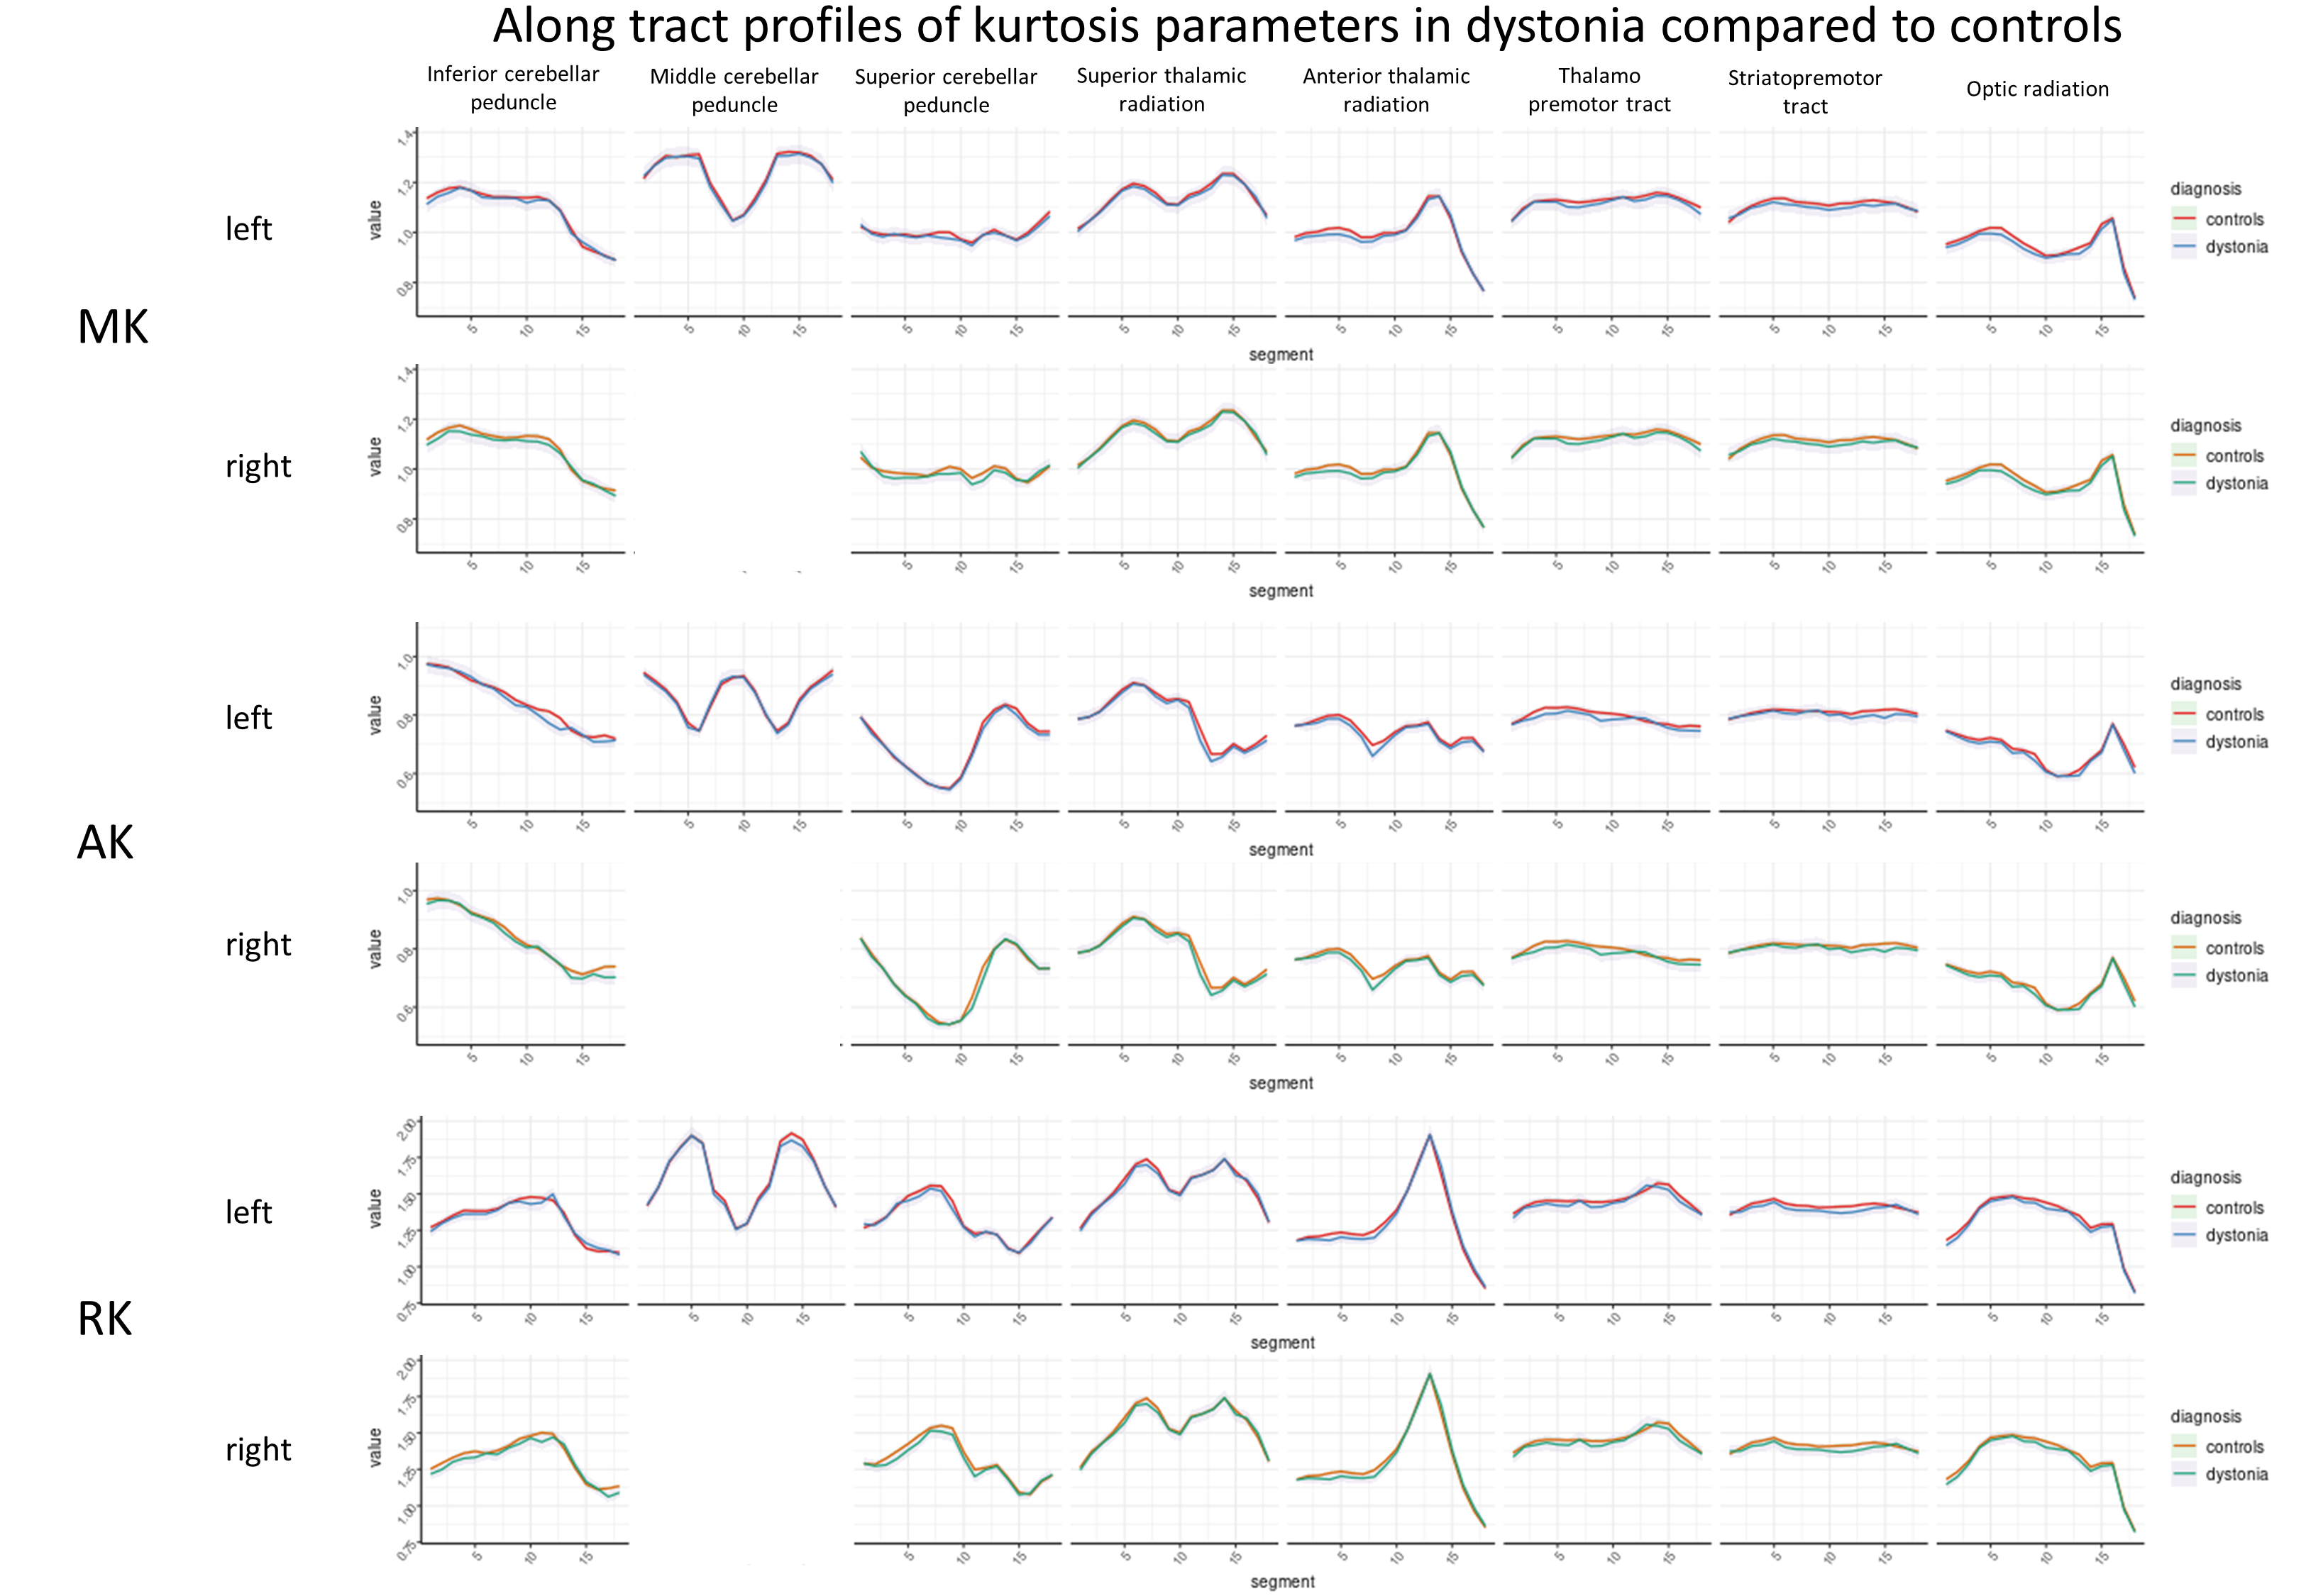
Figure 5: Tractometry diffusion kurtosis profiles for key
tracts in dystonia compared to controls using the local preprocessing
DOI: https://doi.org/10.58530/2023/3021