3020
Patients with sickle cell disease have altered brain fractional anisotropy, axial, mean and radial diffusivity quantified by 7T MRI.1Biomedical Engineering, Carnegie Mellon University, Pittsburgh, PA, United States, 2Bioengineering, University of Pittsburgh, Pittsburgh, PA, United States, 3Hematology/Oncology, University of Pittsburgh, Pittsburgh, PA, United States, 4Pittsburgh Heart, Lung and Blood Vascular Medicine Institute, University of Pittsburgh, Pittsburgh, PA, United States, 5Sickle Cell Center of Excellence, University of Pittsburgh, Pittsburgh, PA, United States, 6Radiology, University of Pittsburgh, Pittsburgh, PA, United States, 7Psychiatry, University of Pittsburgh, Pittsburgh, PA, United States, 8Neuroscience Institute, Carnegie Mellon University, Pittsburgh, PA, United States
Synopsis
Keywords: White Matter, Diffusion Tensor Imaging, Sickle cell disease
This abstract compares diffusion tensor imaging parameters between healthy controls and sickle cell disease (SCD) patients. Various softwares were utilized to obtain diffusion metrics and conduct voxelwise comparison was conducted. Fractional anisotropy (FA) and axial diffusivity (AD) values were significantly decreased in patients with SCD compared to controls, while mean diffusivity (MD) and radial diffusivity (RD) were primarily increased in patients compared to controls. Our FA and MD findings are consistent with other studies comparing diffusion metrics of individuals with SCD at a lower magnet field. We also present novel findings comparing AD and RD values for the SCD population.Introduction
Sickle cell disease (SCD) is a genetic condition that results in the formation of an abnormal hemoglobin, HbS, leading to chronic hemolysis, anemia, abnormal perfusion, and decreased oxygen delivery to various tissues. There are multiple forms of SCD with homozygous hemoglobin S (HbSS) being a more severe form. Additional subtypes include HbSC and hemoglobin S beta+ (HbSβ+) thalassemia which generally present with milder phenotypes but can still lead to complications1,2,3. SCD predominantly affects people of African descent4,5 and affects millions of people worldwide. As neurological function is correlated and/or reliant on adequate blood and oxygen delivery, it is common for neurological complications such as white matter tissue damage to arise in patients with SCD6,7,8,9,10. In this work, we use diffusion tensor imaging (DTI) MRI to compare individuals with SCD to healthy race and age matched controls. To the best of our knowledge, this is the first study to use 7T MRI data to compare diffusion metrics between adult individuals with SCD and healthy controls. We hypothesized that fractional anisotropy (FA) and axial diffusivity (AD) would be significantly decreased in patients with SCD compared to healthy controls while radial diffusivity (RD) and mean diffusivity (MD) metrics would be increased, indicating white matter tissue damage which may result from SCD.Methods
24 healthy controls (aged 38+/-15) and 24 patients with SCD (aged 35+/-13) were included. We recruited patients with various SCD genotypes (11 HbSS, 9 HbSC, and 4 HbSβ+ thalassemia). DTI data was acquired with a 7T MRI scanner (MAGNETOM, Siemens), and a customized 16Tx/32Rx head coil11,12,13. The sequence parameters were: 64 directions with b-value of 1ms/µm2, 2 acquisitions without diffusion gradients (with and without reversed phase encoding direction), TE/TR=80/10031 ms, total acquisition time 11:33 min. T1-weighted MPRAGE scans were acquired with 0.75 mm isotropic resolution, acquisition time of 5.02 mins, and TE/TR/TI=2.17/3000/1200 ms. Preprocessing of the data was conducted with the softwares MRtrix14 and FSL15. Preprocessing included denoising, removing Gibb’s ringing artifacts, and motion and distortion correction. In addition, masks were created from T1-weighted images using a five-tissue-type script (5ttgen) on MRtrix. Tensors were then calculated using the dwi2tensor and tensor2metric functions. Tract-based spatial statistics16 (TBSS) was used to compare diffusion metrics between healthy controls and patients with SCD. Voxelwise statistics on the skeletonized FA data was then conducted by creating design files for a simple t-test between controls and patients with SCD and running randomisation on FSL.Results
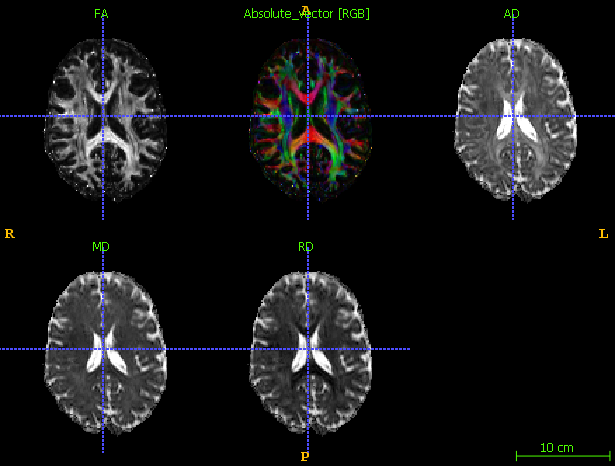
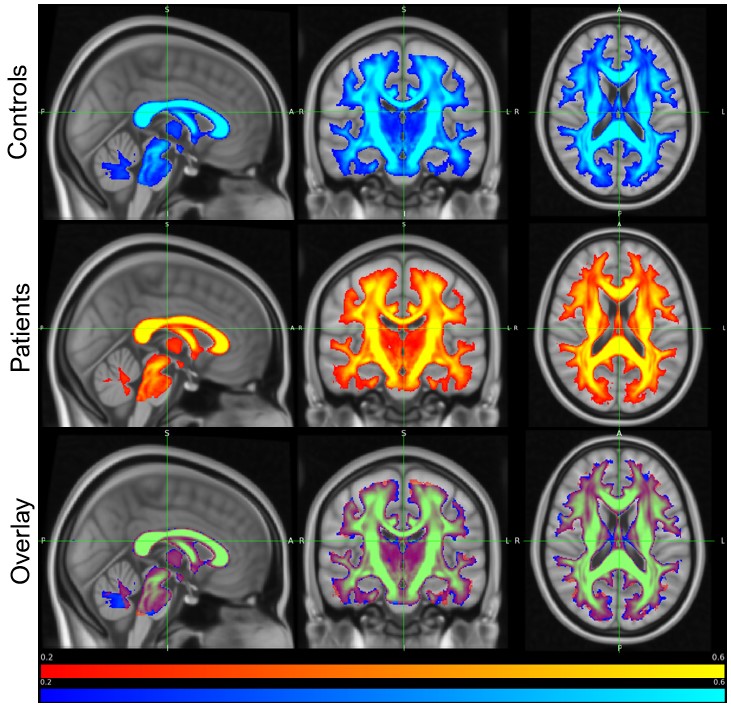
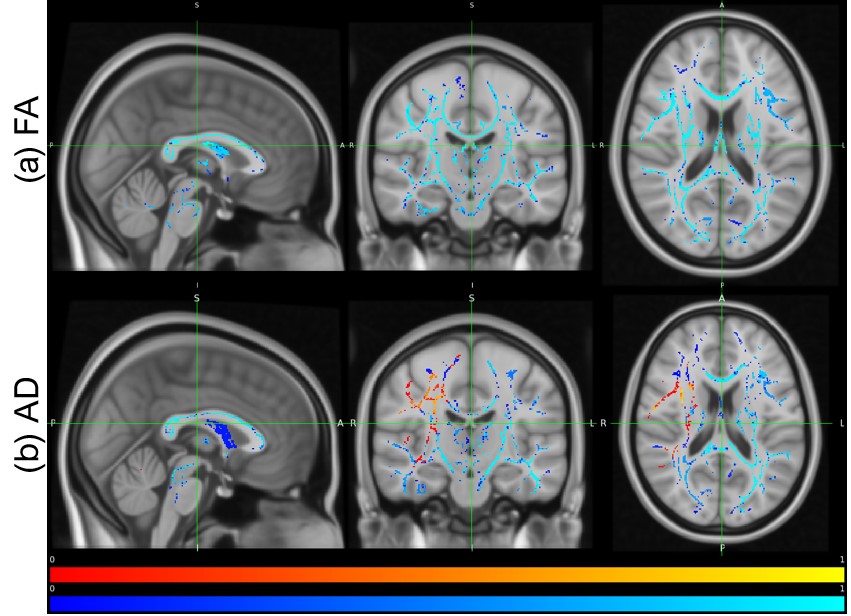
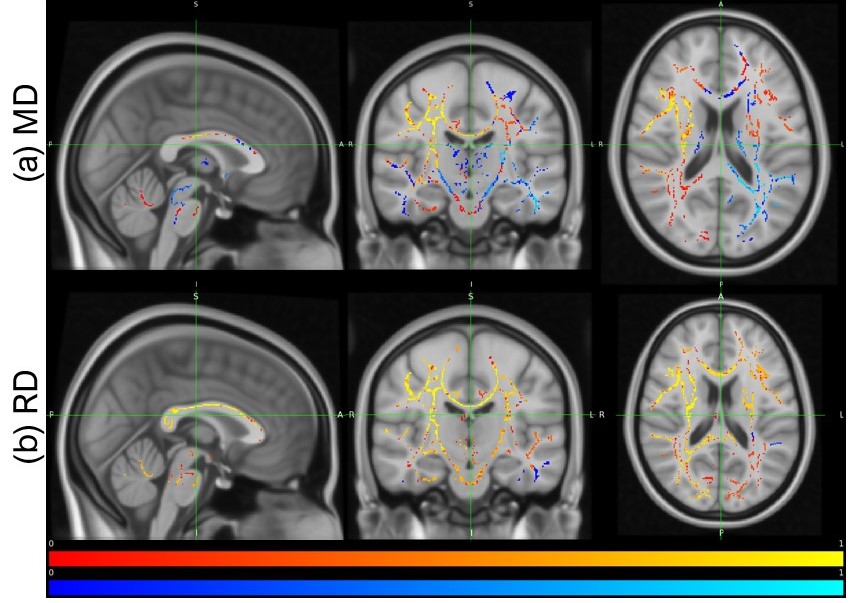
After visual inspection, 48 subjects were included in this analysis. An example of a healthy participant after preprocessing can be visualized in Figure 1. Figure 2 illustrates the mean FA maps of healthy controls and patients with SCD, both separately and overlaid. These figures were generated through TBSS and indicate where diffusion is prominent in the brain. Voxel-wise comparison of FA, MD, AD, and RD metrics indicate that various brain regions of patients are significantly different from healthy controls (p-value<0.05, Figures 3 and 4). Results indicate decreased FA values and both increased and decreased MD values in patients with SCD compared to controls. Results also indicate primarily decreased AD values and primarily increased RD values.Discussion
SCD causes stroke and potential alterations in the water diffusivity within the brain due to hypoperfusion and ischemia. Low FA has been associated with worse cognitive function17,18,19,20, a debilitating complication of SCD. Thus, the finding of lower FA values in patients with SCD compared to healthy controls is unsurprising and consistent with findings from 1.5T data21,22. MD values increase in damaged tissues due to increased, unorganized, diffusion23. Other studies have indicated that MD can be difficult to interpret in complex diseases due to brain regions experiencing unpredictable combinations of factors such as demyelination, cell proliferation, axon loss, and inflammation24. This may explain why some regions of the brain have higher MD values in patients than controls while others have lower MD values. Decreased AD values indicate that longitudinal diffusion along axons is decreased, potentially indicating decreased axonal integrity which results in unorganized diffusion throughout blood vessels. Our findings of increased RD values are consistent with our decreased AD values as it measures the water diffusion perpendicular to the fiber tracts, also indicating potential loss in axonal integrity or demyelination25. Viewed holistically, our findings indicate that there is potential white matter tissue damage in patients with SCD compared to healthy controls. These findings may help to explain the cognitive deficits experienced by patients with SCD26,27.Conclusion
Our study is indicative of white matter tissue damage in patients with SCD and is the first to use 7T DTI in adults22,28. As SCD complications generally increase with age, analyzing the effects of SCD on the aging brain is essential to develop and analyze treatment methods. Studies should be conducted to investigate the specific fiber tracts that are most affected in SCD and the differences between sickle cell disease subtypes. This will increase our comprehension of SCD and allow for correlations to be made between clinical complications of SCD and DTI metrics.Acknowledgements
This work was supported by the National Institutes of Health under award number: R01HL127107. Huge thank you to Dr. Sossena Wood for encouragement and resources.References
Da Guarda, Caroline Conceição, et al. “Sickle Cell Disease: A Distinction of Two Most Frequent Genotypes (HbSS and HbSC).” PLOS ONE, vol. 15, no. 1, 2020, https://doi.org/10.1371/journal.pone.0228399.
Figueiredo, Maria Stella. “The Compound State: HB S/Beta-Thalassemia.” Revista Brasileira De Hematologia e Hemoterapia, vol. 37, no. 3, 2015, pp. 150–152., https://doi.org/10.1016/j.bjhh.2015.02.008.
“Types of Sickle Cell.” Sickle Cell Speaks, 30 Jan. 2020, https://sicklecellspeaks.com/understanding-sickle-cell/types-of-sickle-cell/.
“Incidence of Sickle Cell Trait in the US.” Centers for Disease Control and Prevention, 14 Dec. 2020, https://www.cdc.gov/ncbddd/sicklecell/features/keyfinding-trait.html.
Lee, LaTasha, et al. “Reducing Health Care Disparities in Sickle Cell Disease: A Review.” Public Health Reports, vol. 134, no. 6, 2019, pp. 599–607., https://doi.org/10.1177/0033354919881438.
Farooq, Shama, and Fernando D Testai. “Neurologic Complications of Sickle Cell Disease.” Current neurology and neuroscience reports vol. 19,4 17. 28 Feb. 2019, doi:10.1007/s11910-019-0932-0
Lagunju, IkeOluwa A., et al. “Transcranial Doppler Screening in Nigerian Children with Sickle Cell Disease: A 10‐Year Longitudinal Study on the SPPIBA Cohort.” Pediatric Blood & Cancer, vol. 68, no. 4, 2021, https://doi.org/10.1002/pbc.28906.
Clayden, Jonathan D, et al. “Structural Connectivity Mediates the Relationship between Blood Oxygenation and Cognitive Function in Sickle Cell Anemia.” Blood Advances, 2022, https://doi.org/10.1182/bloodadvances.2021006751.
Pegelow, C. H. “Longitudinal Changes in Brain Magnetic Resonance Imaging Findings in Children with Sickle Cell Disease.” Blood, vol. 99, no. 8, 2002, pp. 3014–3018., https://doi.org/10.1182/blood.v99.8.3014.
Novelli, Enrico M., et al. “Brain Venular Pattern by 7t MRI Correlates with Memory and Haemoglobin in Sickle Cell Anaemia.” Psychiatry Research: Neuroimaging, vol. 233, no. 1, 2015, pp. 18–22.
Santini, Tales, et al. “Improved 7 Tesla Transmit Field Homogeneity with Reduced Electromagnetic Power Deposition Using Coupled Tic Tac Toe Antennas.” 2020, https://doi.org/10.1101/2020.11.06.371328.
Ibrahim, T.S.T., Raval, S., Krishnamurthy, N., Wood, S., Kim, J., Zhao, Y., Wu, X., Yacoub, E., Aizenstein, H. and Zhao, T., 2017, April. “Towards homogenous 7T neuro imaging: findings and comparisons between 7T TTT and NOVA RF coil systems.” In Proc of the 25th International Society of Magnetic Resonance in Medicine Annual Meeting; Honolulu, Hawaii, USA2017.
Krishnamurthy N, Santini T, Wood S, Kim J, Zhao T, et al. (2019) “Computational and experimental evaluation of the Tic-Tac-Toe RF coil for 7 Tesla MRI.” PLOS ONE 14(1): e0209663. https://doi.org/10.1371/journal.pone.0209663.
J.-D. Tournier, R. E. Smith, D. Raffelt, R. Tabbara, T. Dhollander, M. Pietsch, D. Christiaens, B. Jeurissen, C.-H. Yeh, and A. Connelly. “MRtrix3: A fast, flexible and open software framework for medical image processing and visualisation.” NeuroImage, 202 (2019), pp. 116–37.
S.M. Smith, M. Jenkinson, M.W. Woolrich, C.F. Beckmann, T.E.J. Behrens, H. Johansen-Berg, P.R. Bannister, M. De Luca, I. Drobnjak, D.E. Flitney, R. Niazy, J. Saunders, J. Vickers, Y. Zhang, N. De Stefano, J.M. Brady, and P.M. Matthews. “Advances in functional and structural MR image analysis and implementation as FSL.” NeuroImage, 23(S1):208-219, 2004.
S.M. Smith, M. Jenkinson, H. Johansen-Berg, D. Rueckert, T.E. Nichols, C.E. Mackay, K.E. Watkins, O. Ciccarelli, M.Z. Cader, P.M. Matthews, and T.E.J. Behrens. “Tract-based spatial statistics: Voxelwise analysis of multi-subject diffusion data.” NeuroImage, 31:1487-1505, 2006.
Pfefferbaum A, Sullivan EV. “Microstructural but not macrostructural disruption of white matter in women with chronic alcoholism.” Neuroimage 2002;15:708–18
Deutsch, Gayle K., et al. “Children's Reading Performance Is Correlated with White Matter Structure Measured by Diffusion Tensor Imaging.” Cortex, vol. 41, no. 3, 2005, pp. 354–363., https://doi.org/10.1016/s0010-9452(08)70272-7.
O'Sullivan, M. “Diffusion Tensor MRI Correlates with Executive Dysfunction in Patients with Ischaemic Leukoaraiosis.” Journal of Neurology, Neurosurgery & Psychiatry, vol. 75, no. 3, 2004, pp. 441–447., https://doi.org/10.1136/jnnp.2003.014910.
Madden, David J., et al. “Diffusion Tensor Imaging of Adult Age Differences in Cerebral White Matter: Relation to Response Time.” NeuroImage, vol. 21, no. 3, 2004, pp. 1174–1181., https://doi.org/10.1016/j.neuroimage.2003.11.004.
Jacob, Mboka, et al. “White Matter Integrity in Tanzanian Children with Sickle Cell Anemia.” Stroke, vol. 51, no. 4, 2020, pp. 1166–1173., https://doi.org/10.1161/strokeaha.119.027097.
Balci, Ali, et al. "Quantitative brain diffusion-tensor MRI findings in patients with sickle cell disease." American Journal of Roentgenology 198.5 (2012): 1167-1174.
Soares, José M., et al. “A Hitchhiker's Guide to Diffusion Tensor Imaging.” Frontiers in Neuroscience, vol. 7, 2013, https://doi.org/10.3389/fnins.2013.00031.
Alexander, Andrew L et al. “Diffusion tensor imaging of the brain.” Neurotherapeutics : the journal of the American Society for Experimental NeuroTherapeutics vol. 4,3 (2007): 316-29. doi:10.1016/j.nurt.2007.05.011.
Winklewski, Pawel J., et al. “Understanding the Physiopathology behind Axial and Radial Diffusivity Changes—What Do We Know?” Frontiers in Neurology, vol. 9, 2018, https://doi.org/10.3389/fneur.2018.00092.
Graham R Serjeant, “Sickle-cell disease”, The Lancet, Volume 350, Issue 9079, 1997, Pages 725-730, ISSN 0140-6736, https://doi.org/10.1016/S0140-6736(97)07330-3.
Okocha, Chide Emmanuel et al. “Adiponectin and Disease Severity in Sickle Cell Anemia Patients Attending a Tertiary Health Institution in Nnewi, Southeast Nigeria.” Frontiers in genetics 13 (2022): 799425–799425.
Kawadler, Jamie M et al. “White Matter Damage Relates to Oxygen Saturation in Children With Sickle Cell Anemia Without Silent Cerebral Infarcts.” Stroke vol. 46,7 (2015): 1793-9. doi:10.1161/STROKEAHA.115.008721.
Figures