3016
Hierarchical clustering analysis reveals size-dependent transport pathways of cerebrospinal fluid tracer in mouse brain1Department of Biomedical Engineering, Case Western Reserve University, Cleveland, OH, United States, 2Department of Biomedical Engineering, University of Michigan, Ann Arbor, MI, United States, 3Cardiovascular Research Institute, Case Western Reserve University, Cleveland, OH, United States, 4Department of Medicine, Case Western Reserve University, Cleveland, OH, United States, 5Department of Biostatistics, Population and Quantitative Health Sciences, Case Western Reserve University, Cleveland, OH, United States, 6Department of Radiology, Case Western Reserve University, Cleveland, OH, United States, 7Department of Pediatrics, Case Western Reserve University, Cleveland, OH, United States, 8Department of Physiology and Biophysics, Case Western Reserve University, Cleveland, OH, United States
Synopsis
Keywords: Neurofluids, Contrast Agent, Glymphatics
This study investigated the impact of molecular size on transport kinetics and distribution of intracisternal tracers in mouse brain. Three MRI contrast agents with different molecular sizes were administered via cisterna magna. Their transport in the whole brain was observed by dynamic contrast-enhanced MRI for 2 hours. Our results show that the transport of 17O-water (H217O) was significantly faster and more extensive than the two gadolinium-based tracers (Gd-DTPA and GadoSpin). Time-lagged correlation analysis and clustering analysis also showed different cluster patterns between Gd-DTPA and H217O. These observations suggest the size-dependent differences in forces that drive tracer transport in the brain.Introduction
Recent evidence suggests that the exchange of cerebrospinal fluid with the parenchymal interstitial fluid occurs via the highly regulated glymphatic system.1 Imaging intracisternal tracers by dynamic contrast-enhanced MRI (DCE-MRI) allows the evaluation of both the kinetics and distribution of tracer transport in the glymphatic system.2 Previous studies in rats have reported the size-dependent transport of MRI contrast agents along the glymphatic pathways.3,4 In this study, we compared the transport of three MRI contrast agents with different molecular weights (MW) in the mouse brain. Correlation-matrix-based hierarchical clustering analysis was employed to compare the transport kinetics and pathways of Gd-DTPA and 17O-enriched water (H217O).Methods
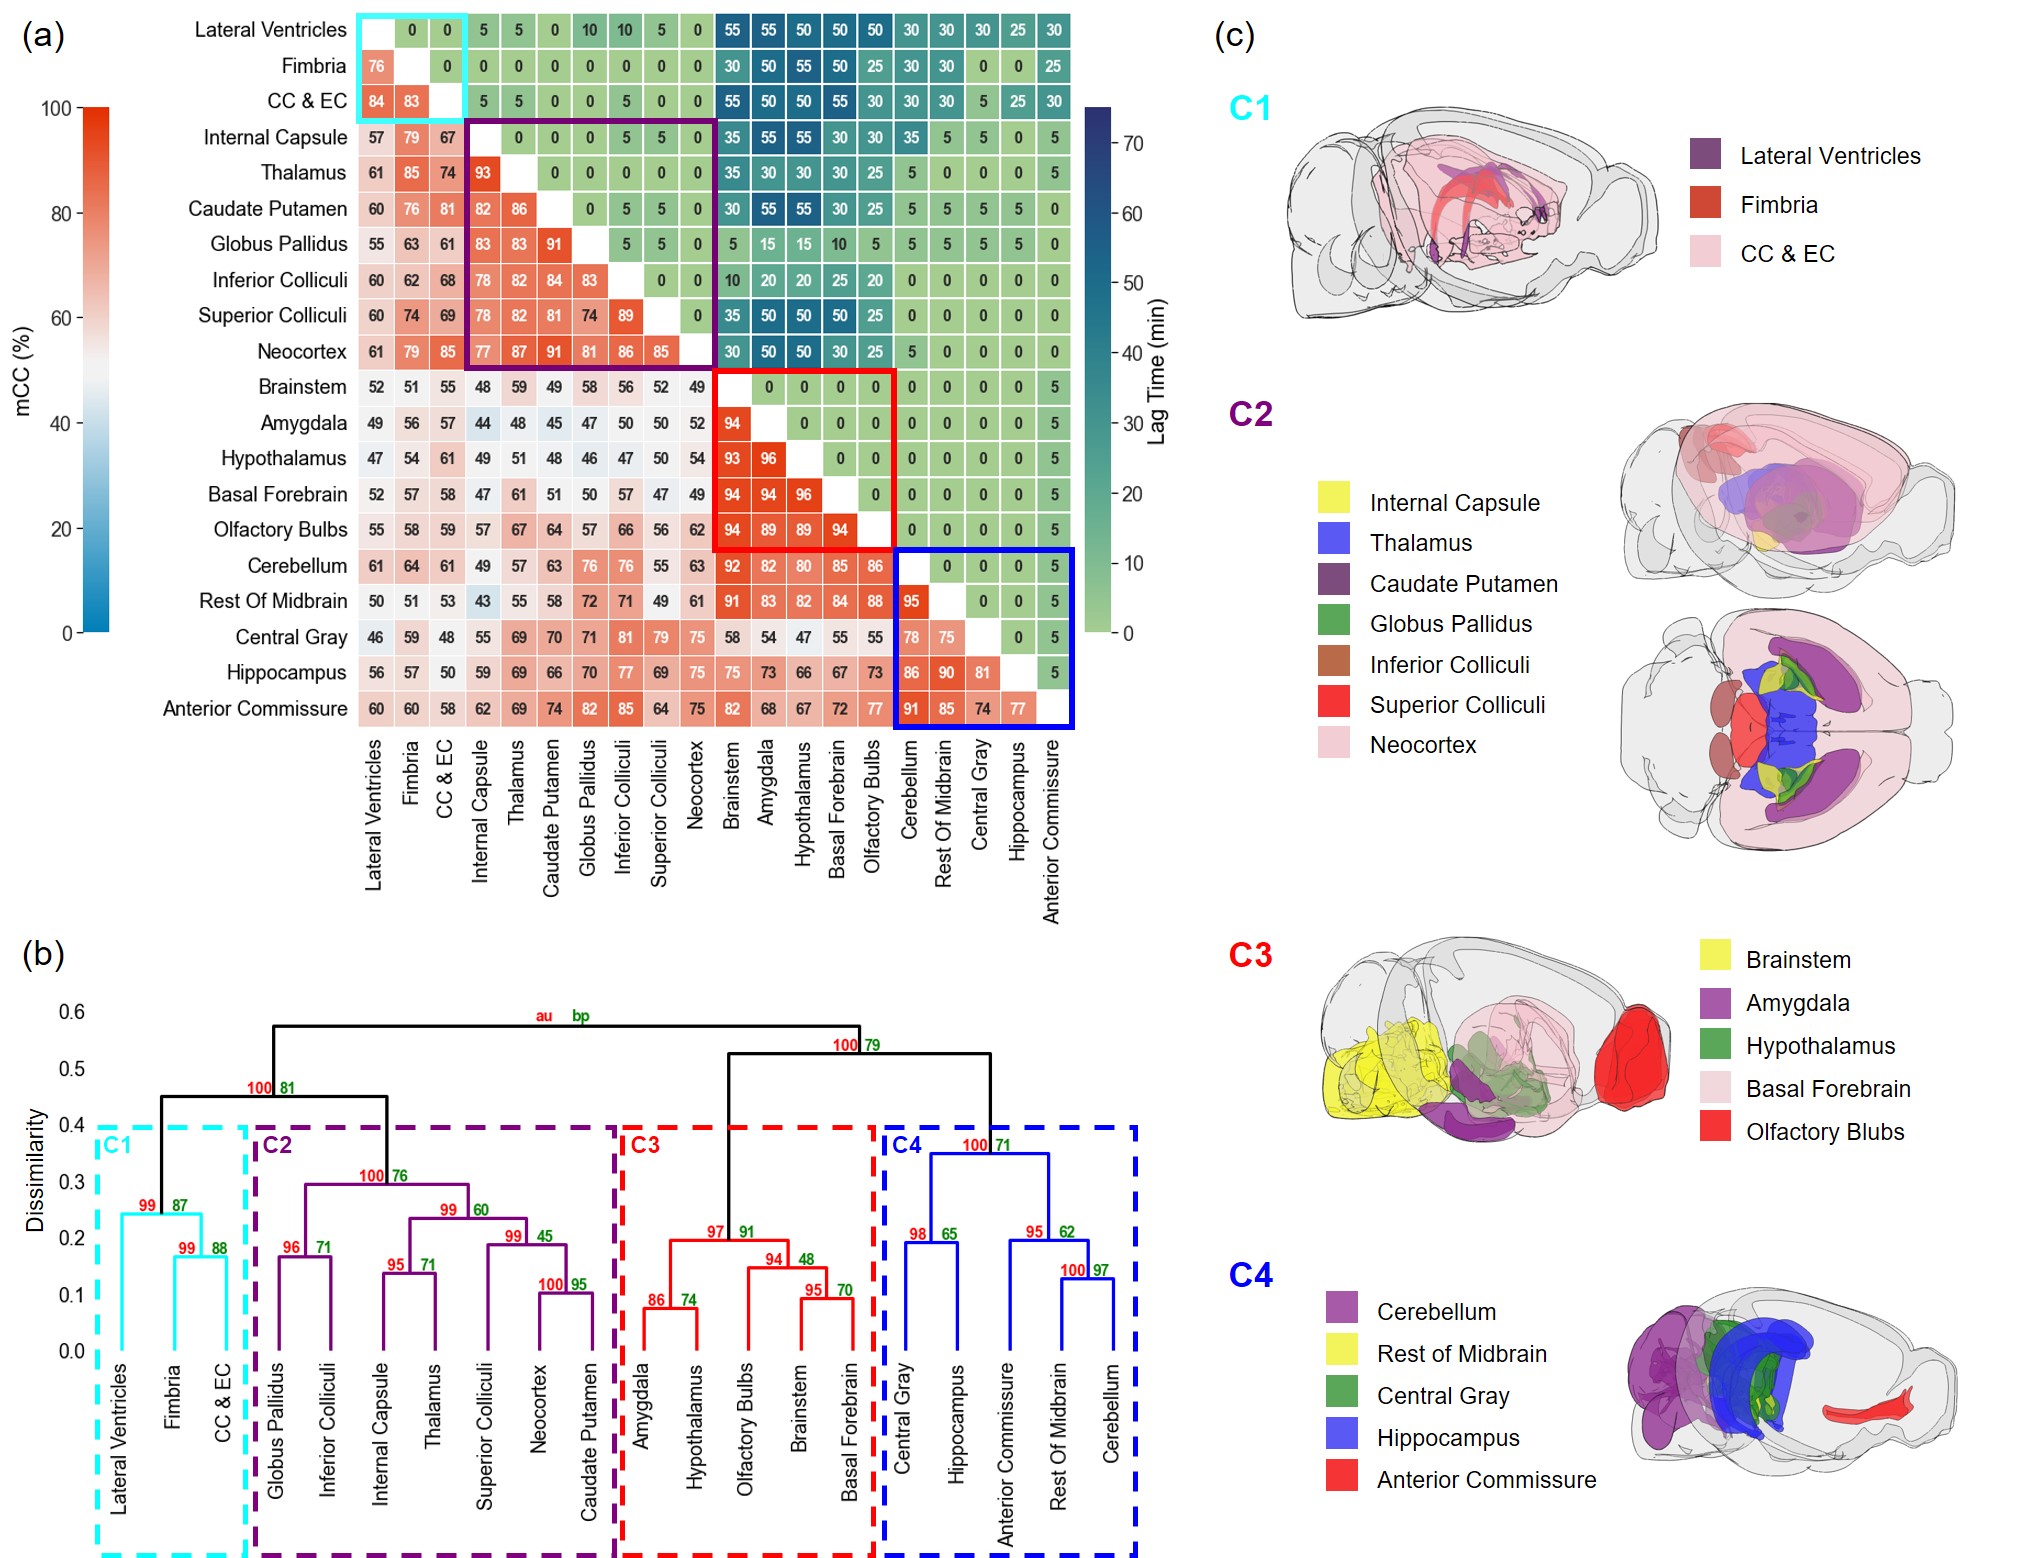
Experimental Protocol: MRI studies were performed on a Bruker 9.4T scanner with a proton volume coil. 13- to 15-week-old male C57BL/6J mice were randomly assigned to receive intracisternal infusion of 1) Gd-DTPA (n=7; MW=661.8 Da); 2) GadoSpin (n=6; MW=200 kDa); and 3) H217O (n=7; MW=19 Da). 10 μL of contrast agent was infused at 1 μL/min for 10 min. DCE-MRI data were acquired continuously for ~130 min. Gd-DTPA and GadoSpin were tracked using T1-weighted 3D FLASH sequence with 200-μm isotropic resolution and 5-min temporal resolution. H217O transport was imaged with T2-weighted multislice RARE sequence. 28 slices were acquired with 200-μm in-plane resolution and 500-μm slice thickness. Image reconstruction used 6 averages, achieving a temporal resolution of 2.5 min.Data analysis: All images were coregistered to an MRI mouse brain atlas after motion correction.5,6 20 regions of interest (ROIs) were generated and the time course of signal changes in each ROI was normalized by the maximal signal from a small region surrounding the infusion catheter. A correlation-matrix-based hierarchical clustering method was used to analyze the transport of Gd-DTPA and H217O among all ROIs.7 Specifically, time-lagged cross-correlation analysis was performed to determine the similarity between the transport kinetics in two ROIs and the lag time corresponding to the maximal cross-correlation coefficient (mCC).8 A dendrogram representing the hierarchical structure of the correlation matrix was generated from clustering analysis, using 1000 bootstrap replications to assess the uncertainty of clustering.9,10
Results
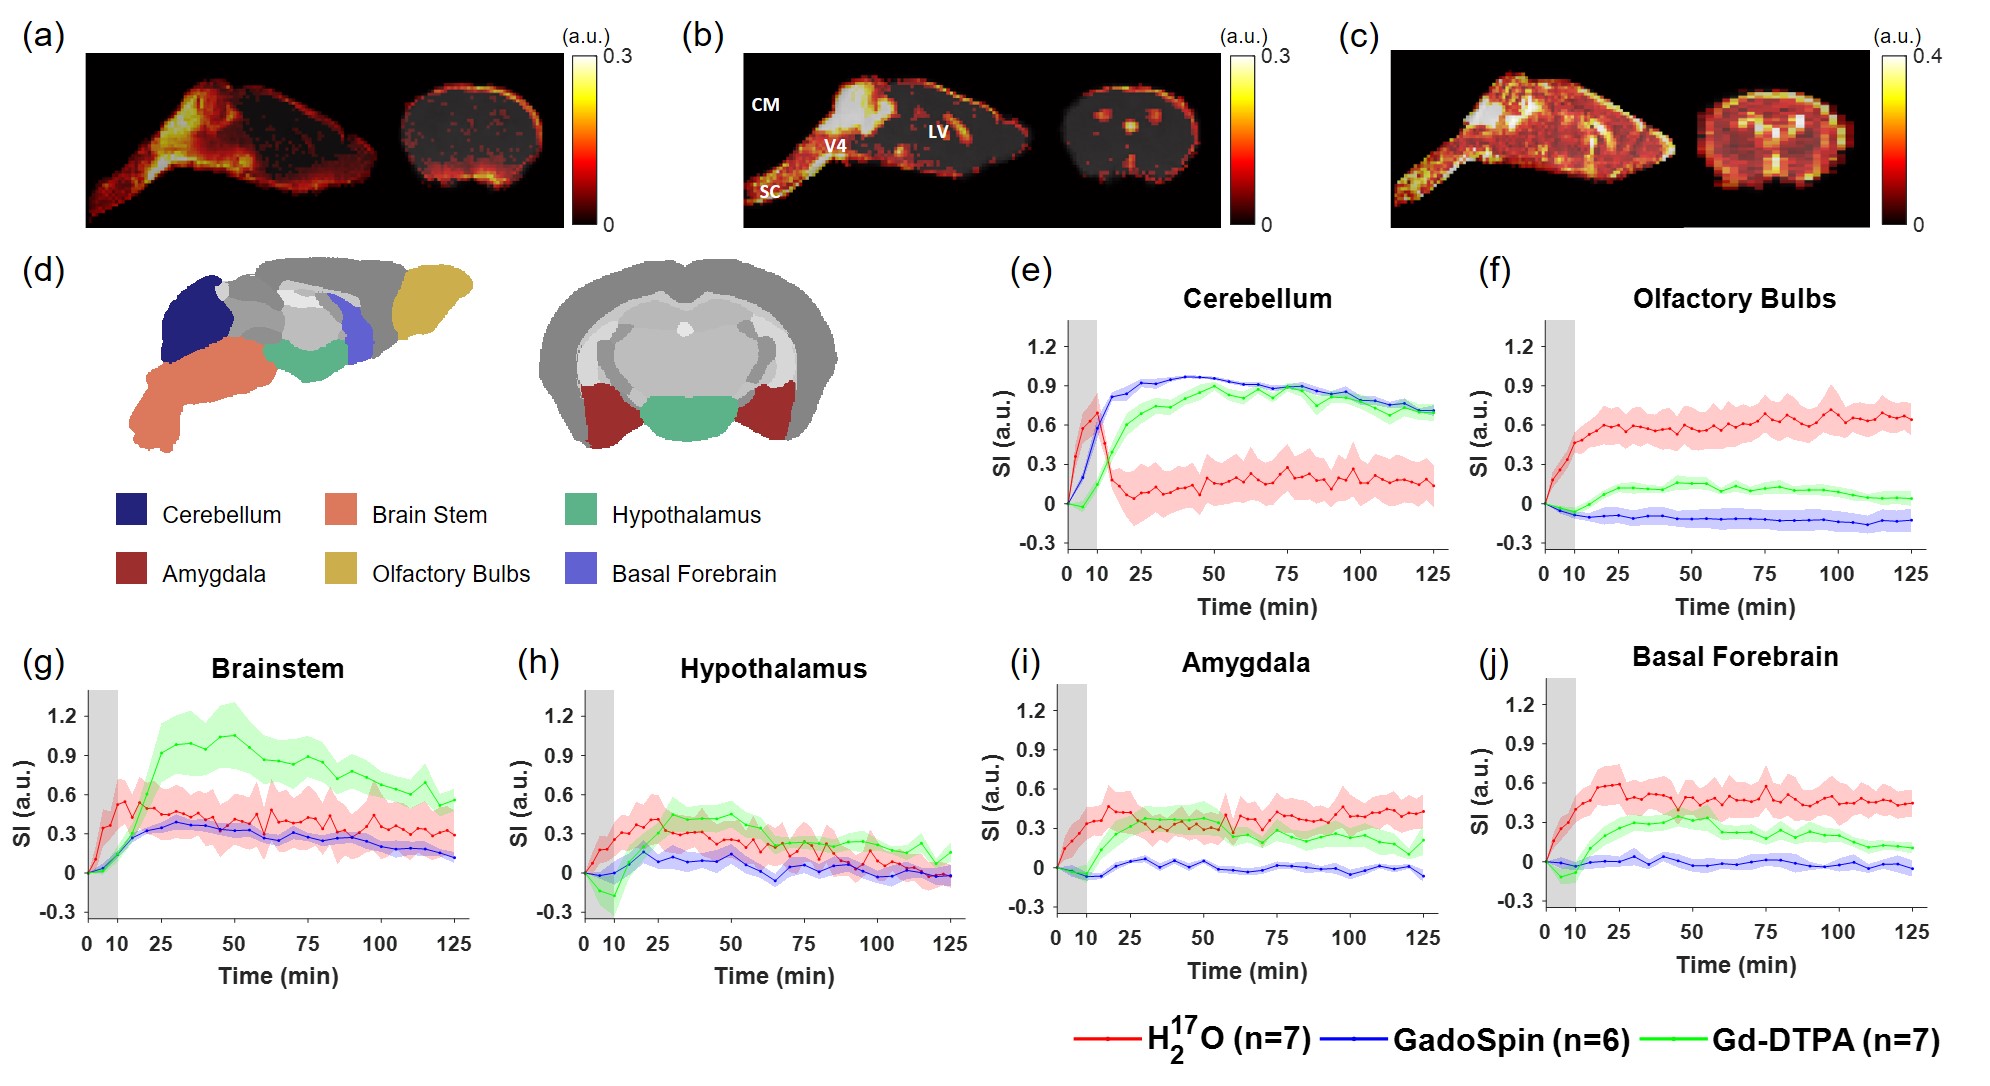
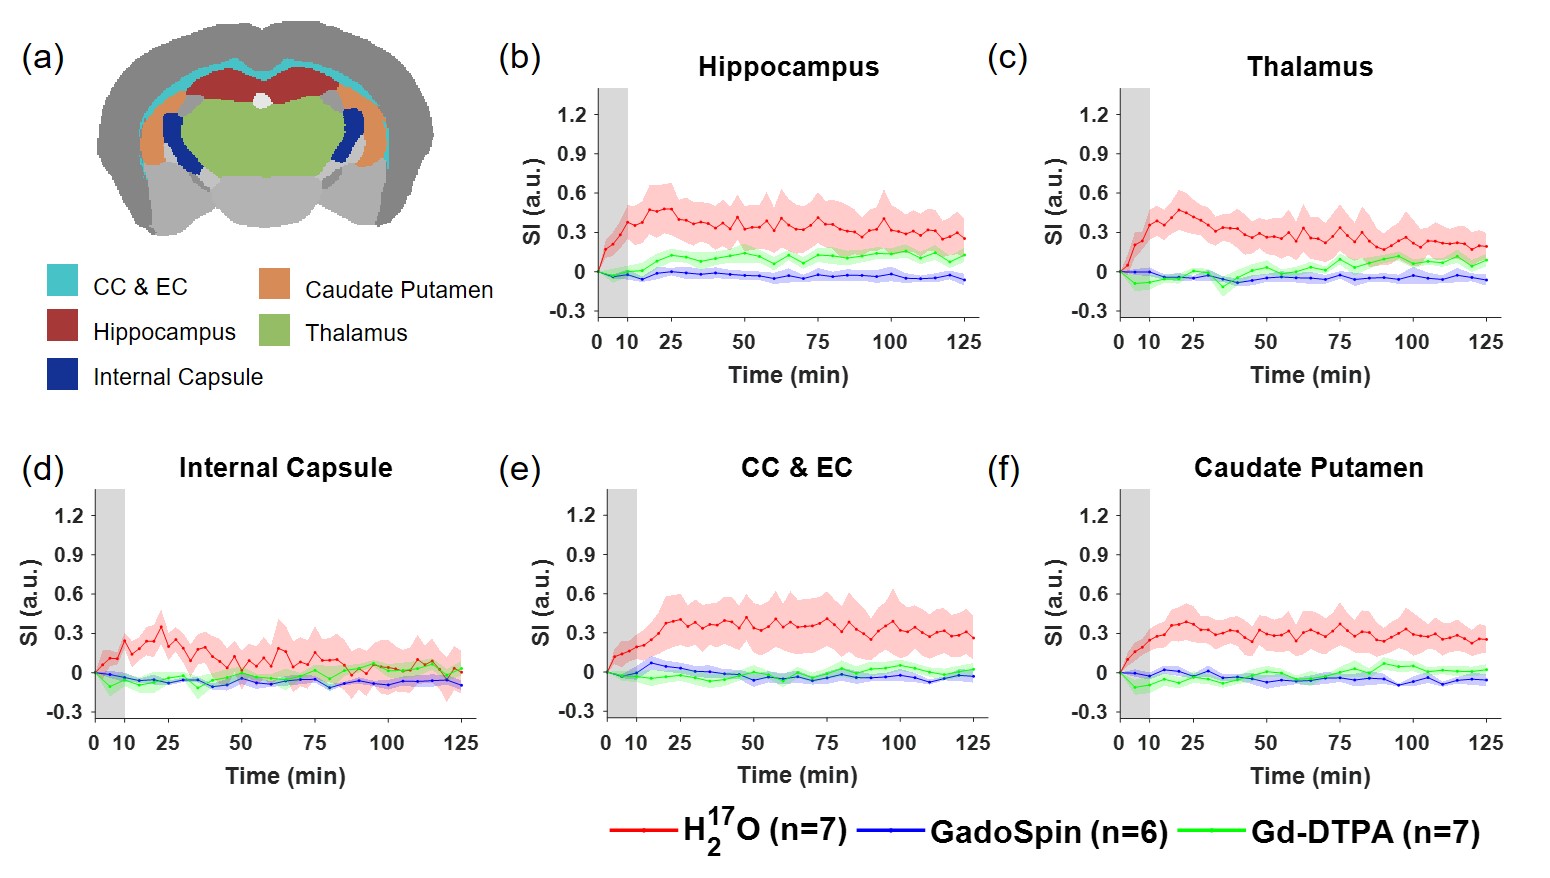
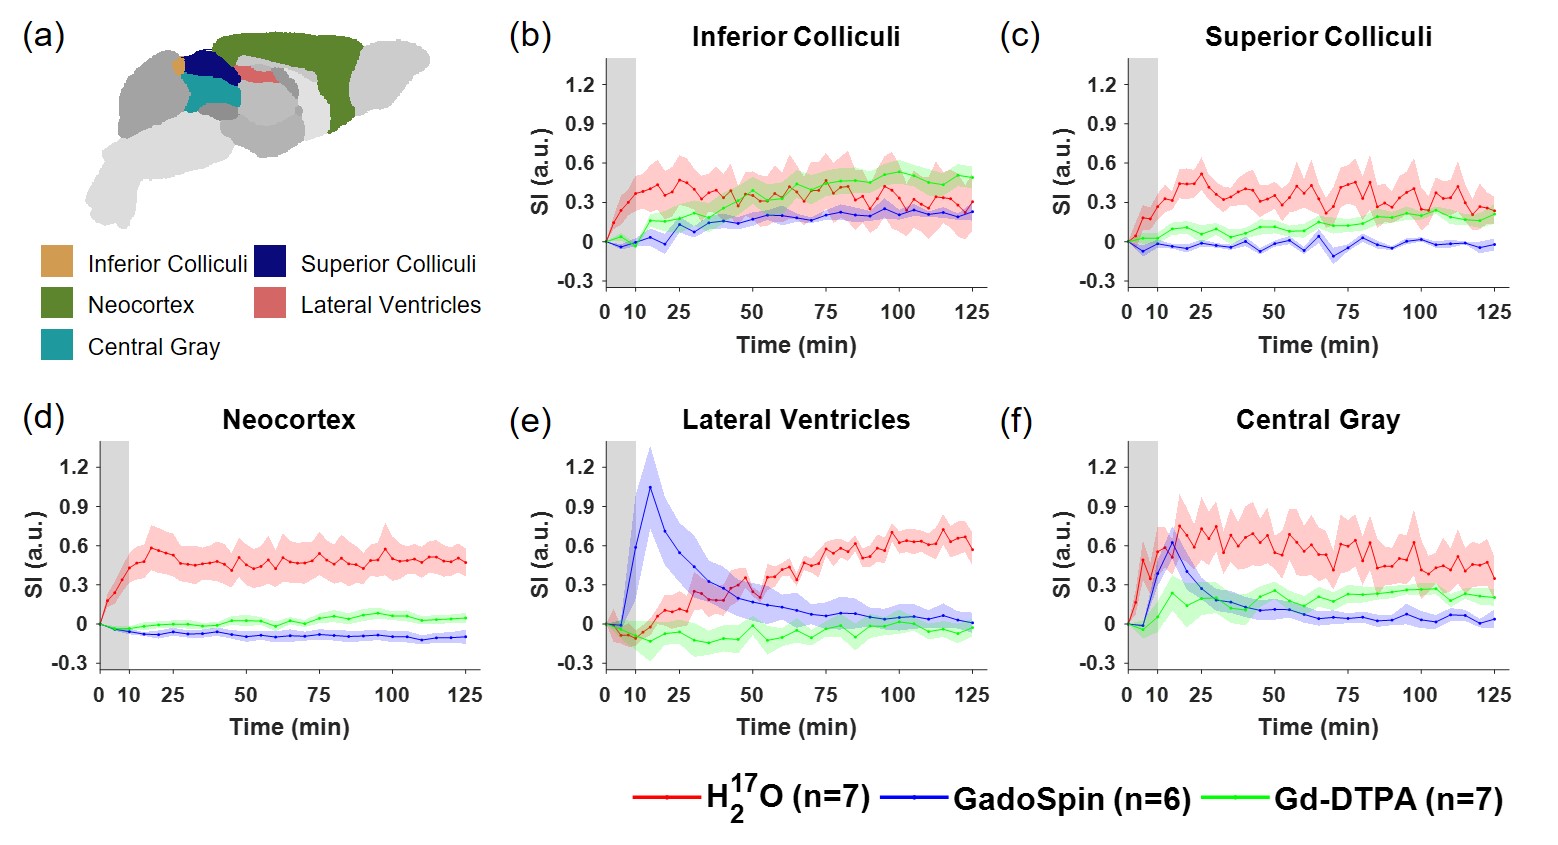
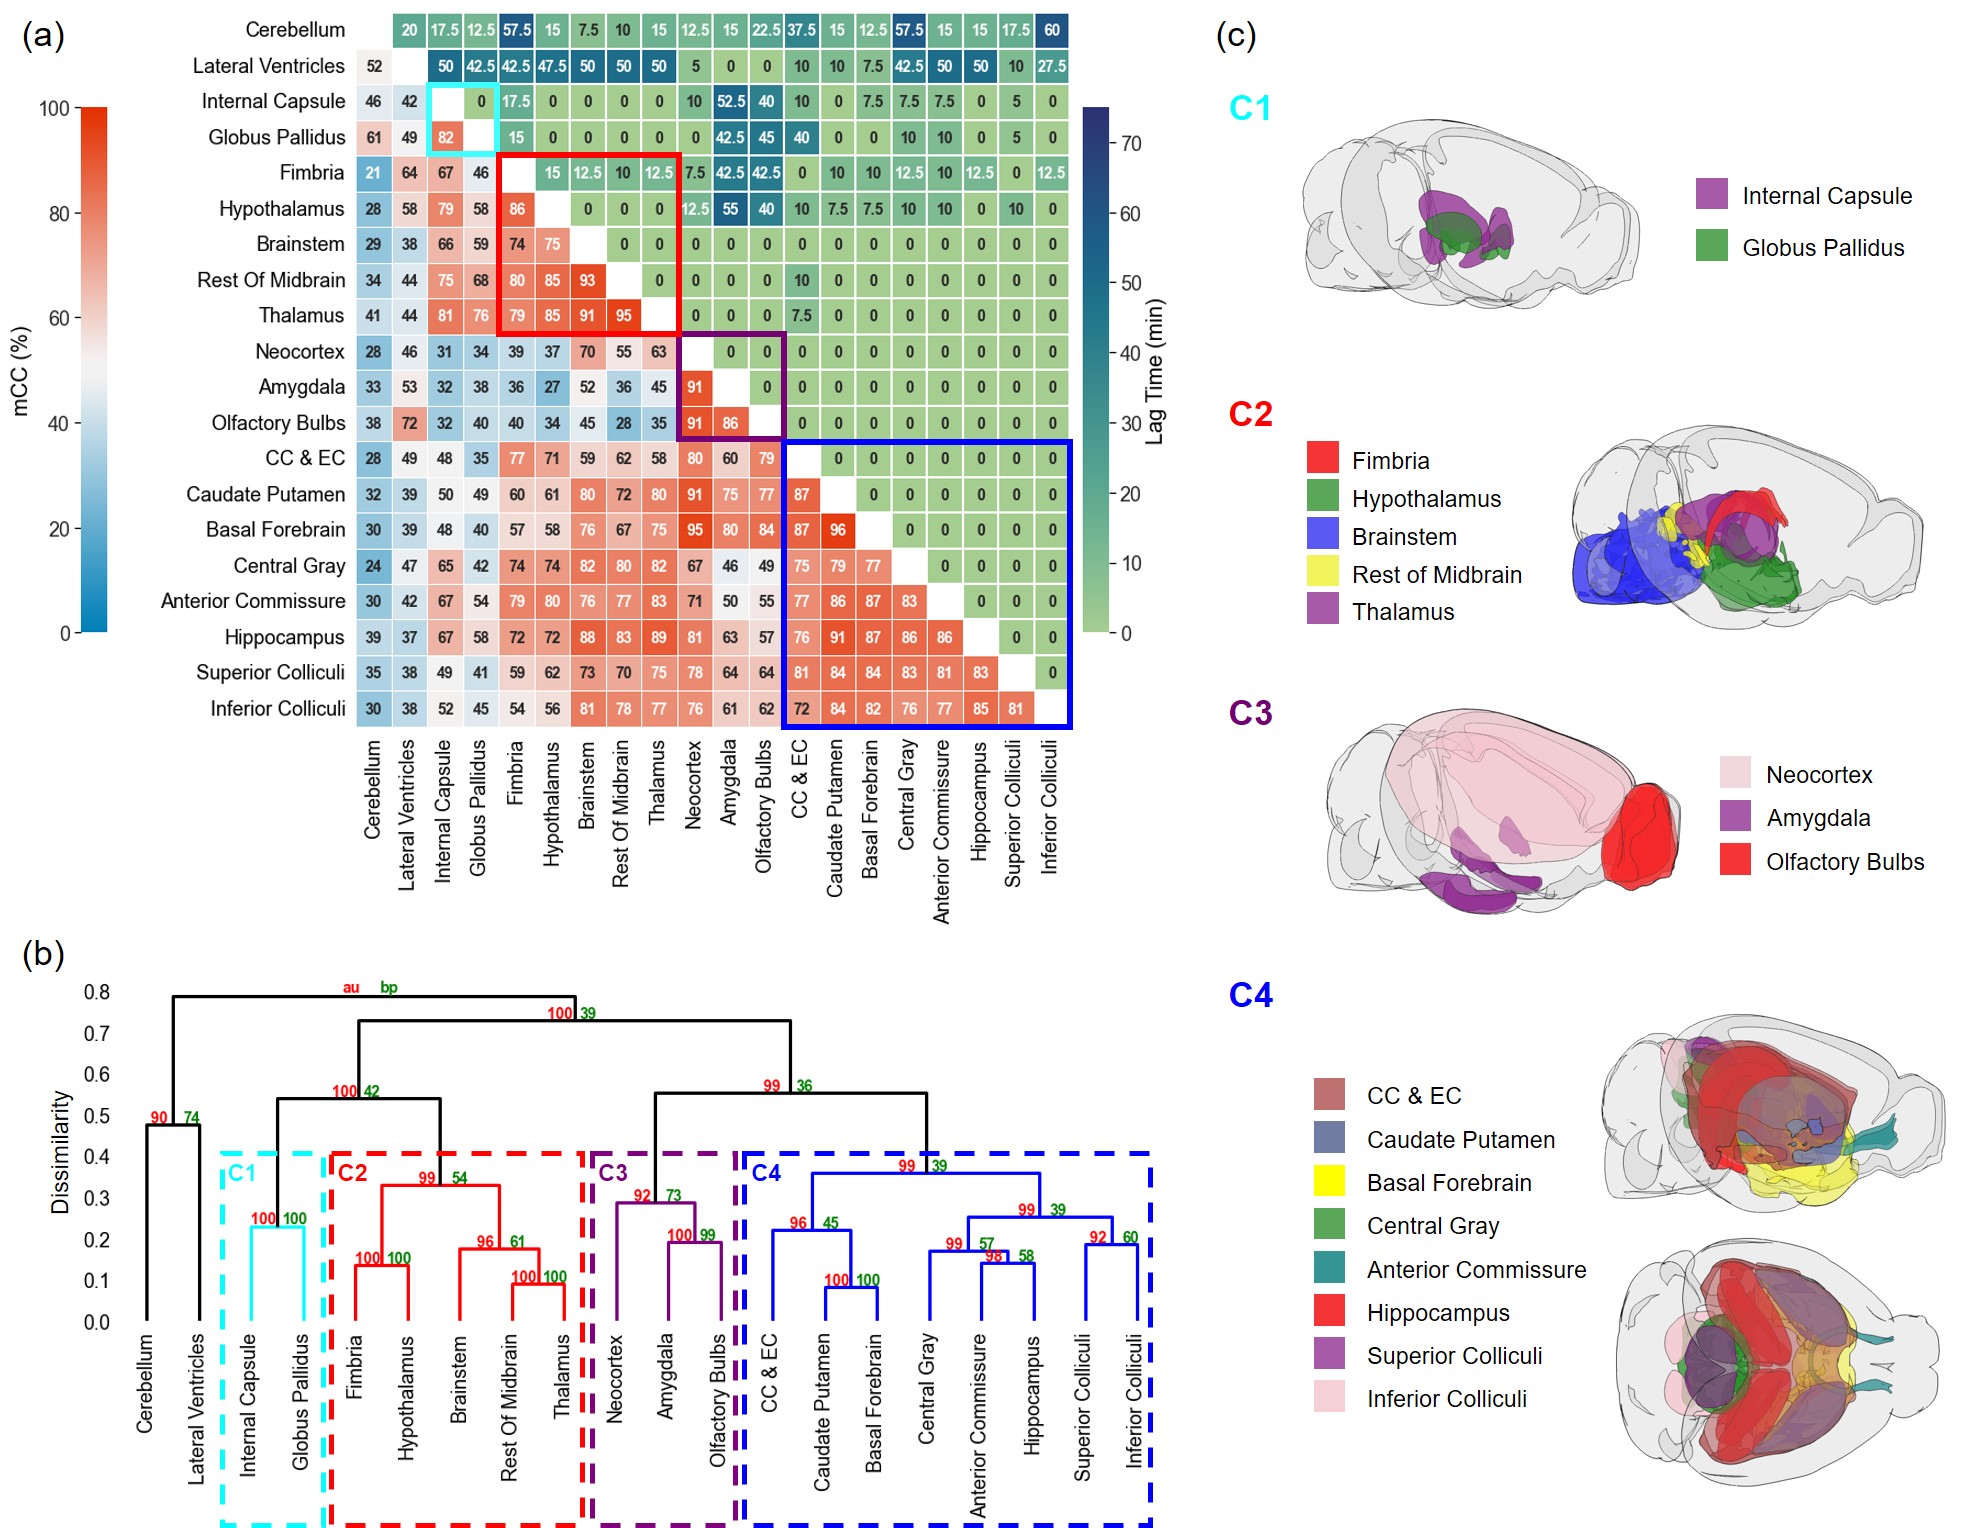
Figures 1 to 3 show the distribution of the three contrast agents and the time courses of signal changes in ROIs covering the cerebellum and the ventral brain surface, the deep brain regions, and the dorsal brain and the ventricular regions, respectively. The transport of H217O was significantly faster and of a higher magnitude than that of Gd-DTPA in all the ROIs. In the deep brain and dorsal regions, the transport of Gd-DTPA was further delayed compared to that in the ventral brain regions, with significantly reduced magnitude of signal enhancement that did not reach steady state over a time period of ~2 hours. In contrast, GadoSpin uptake only occurred in the ventricles and a few regions directly adjacent to the subarachnoid or large perivascular spaces. In the lateral ventricles, GadoSpin showed a prominent rapid uptake that peaked within 15 min after its infusion, followed immediately by a rapid clearance. Further, while a progressive accumulation of H217O was observed, the transport of Gd-DTPA into the lateral ventricles was negligible.Clustering analysis showed different patterns of correlation structure for Gd-DTPA and H217O transport (Figures 4 and 5). For Gd-DTPA, all five ROIs along the ventral brain surface were classified into the same cluster (C3 in Figure 4). The lag time was 0 among all these five ROIs, suggesting fast Gd-DTPA transport along the ventral surface of the brain. In contrast, the five ventral ROIs were classified into three different clusters for H217O (C2-C4 in Figure 5). In general, the clusters for Gd-DTPA were organized by their proximity to the subarachnoid space or the ventral surface, with one cluster (C4) anatomically adjacent to these regions and two (C1 and C2) located distally in the deep brain and dorsal regions. The two distal clusters (C1 and C2) also showed lower mCC and the longest lag time (25-55 min) with the ventral cluster (C3). For H217O transport, the clusters were primarily grouped by their proximity to the infusion site, with two clusters (C1 and C2) located in the posterior to midbrain regions and the other two clusters (C3 and C4) located in the midbrain to anterior regions. Lag time between two ROIs in different clusters was typically <15 min.
Discussion and Conclusion
The transport of H217O was both faster and more extensive compared to Gd-DTPA and GadoSpin. Gd-DTPA showed relatively fast transport kinetics along the ventral surface of the brain but delayed and reduced transport into the deep brain and dorsal regions. GadoSpin transport showed limited penetration to brain parenchyma. These findings were further supported by time-lagged cross-correlation analysis in which Gd-DTPA showed a much longer lag time between ROIs in the ventral surface versus those in the deep brain and dorsal regions compared to H217O. Further, clustering analysis also showed dramatically different transport patterns between Gd-DTPA and H217O, suggesting that the transport pathways and kinetics in the glymphatic system are size-dependent.Acknowledgements
This work was supported by grants from the U.S. National Institute of Health (R01 NS124206 and R01 EB023704).References
1. Iliff JJ, Wang M, Liao Y, et al. A Paravascular Pathway Facilitates CSF Flow Through the Brain Parenchyma and the Clearance of Interstitial Solutes, Including Amyloid β. Sci Transl Med; 4. Epub ahead of print 15 August 2012. DOI: 10.1126/scitranslmed.3003748.
2. Benveniste H, Lee H, Ozturk B, et al. Glymphatic Cerebrospinal Fluid and Solute Transport Quantified by MRI and PET Imaging. Neuroscience 2021; 474: 63–79.
3. Iliff JJ, Lee H, Yu M, et al. Brain-wide pathway for waste clearance captured by contrast-enhanced MRI. J Clin Invest 2013; 123: 1299–1309.
4. Alshuhri MS, Gallagher L, Work LM, et al. Direct imaging of glymphatic transport using H217O MRI. JCI Insight 2021; 6: e141159.
5. Avants BB, Tustison NJ, Song G, et al. A reproducible evaluation of ANTs similarity metric performance in brain image registration. NeuroImage 2011; 54: 2033–2044.
6. Ma Y, Hof PR, Grant SC, et al. A three-dimensional digital atlas database of the adult C57BL/6J mouse brain by magnetic resonance microscopy. Neuroscience 2005; 135: 1203–1215.
7. Liu X, Zhu X-H, Qiu P, et al. A correlation-matrix-based hierarchical clustering method for functional connectivity analysis. J Neurosci Methods 2012; 211: 94–102.
8. Siegel JS, Snyder AZ, Ramsey L, et al. The effects of hemodynamic lag on functional connectivity and behavior after stroke. J Cereb Blood Flow Metab 2016; 36: 2162–2176.
9. Virtanen P, Gommers R, Oliphant TE, et al. SciPy 1.0: fundamental algorithms for scientific computing in Python. Nat Methods 2020; 17: 261–272.
10. Suzuki R, Shimodaira H. Pvclust: an R package for assessing the uncertainty in hierarchical clustering. Bioinformatics 2006; 22: 1540–1542.
Figures