3015
Measurement of changes in cerebrospinal fluid pulsation after traumatic brain injury using EPI-based functional MRI1Korea Advanced Institute of Science and Technology, Daejeon, Korea, Republic of
Synopsis
Keywords: Neurofluids, Traumatic brain injury
A recently-proposed method of simultaneous CSF pulsation and BOLD activity imaging was applied to the TBI-fMRI dataset. The CSF pulsation was significantly lower in the TBI group compared to that of healthy control group. The CSF pulsation decreased significantly in the first 6 months after TBI and then no significant changes in the later stage, which was consistent with previous studies, where CSF pulsation from TBI patients was lower than that of control subjects and starts to slowly recover thereafter. This study can be expanded to post-TBI fMRI datasets in general to examine functional activity and CSF pulsation simultaneously.Introduction
Traumatic brain injury (TBI) is a disruption in normal brain function that can result from violent physical injury to the head. TBIs can cause brain swelling and lesions in localized injuries such as hematomas and contusions that increase intracranial pressure(ICP) in the brain1. Many TBI patients experience cognitive declines such as decreased consciousness, amnesia, focal neurological deficits, or mental status changes2. Previous studies unveiled TBI inducing tau aggregation and neurodegeneration, and it might be caused by dysregulation of AQP4, blood-CSF barrier, or ependymal ciliary loss, which is correlated with cerebrospinal fluid dynamics3. Thus, the cognitive problems after TBI could be related to the CSF dynamics alteration. To investigate the CSF pulsation from functional MRI, we applied the recent CSFpulse technique to EPI-based fMRI data4. In this study, we aimed to reveal the CSF pulsation alteration after TBI from fMRI data of TBI patients using the CSFpulse technique.Method
The fMRI dataset from OpenNeuro TBI patient study was used for cost-efficiency of brain neural network recovery study5. This dataset includes 12 healthy controls(HC) and 14 TBI patient datasets, and the datasets of 6 HC subjects and 13 TBI patient subjects were acquired from Siemens(3T, Trio), and the others from Philips(3T, Achieva). We used the Siemens scanner dataset due to the slice acquisition order, which was more favorable for the CSFpulse technique. Two sessions and three sessions were mapped for each HC subject and each TBI subject, respectively, and the time interval between sessions was approximately 3 months. TBI patients were between 18 and 36 years old, and HC subjects were of comparable age to TBI subjects.2D multi-slice EPI images were acquired with following parameters: repetition time(TR)/echo time(TE)/flip angle = 2000msec/30msec/90°, resolution=3×3mm2, slice thickness=4mm, matrix size=80×80, slice order=ascending interleaved, number of slices=34. 150 measurements were performed for the resting-state fMRI with the whole brain coverage. High-resolution 3D T1 MPRAGE was acquired with 1mm isotropic spatial resolution. EPI images were preprocessed using SPM8 including temporal bandpass filter and slice-timing correction, and the details are described in the previous study5.
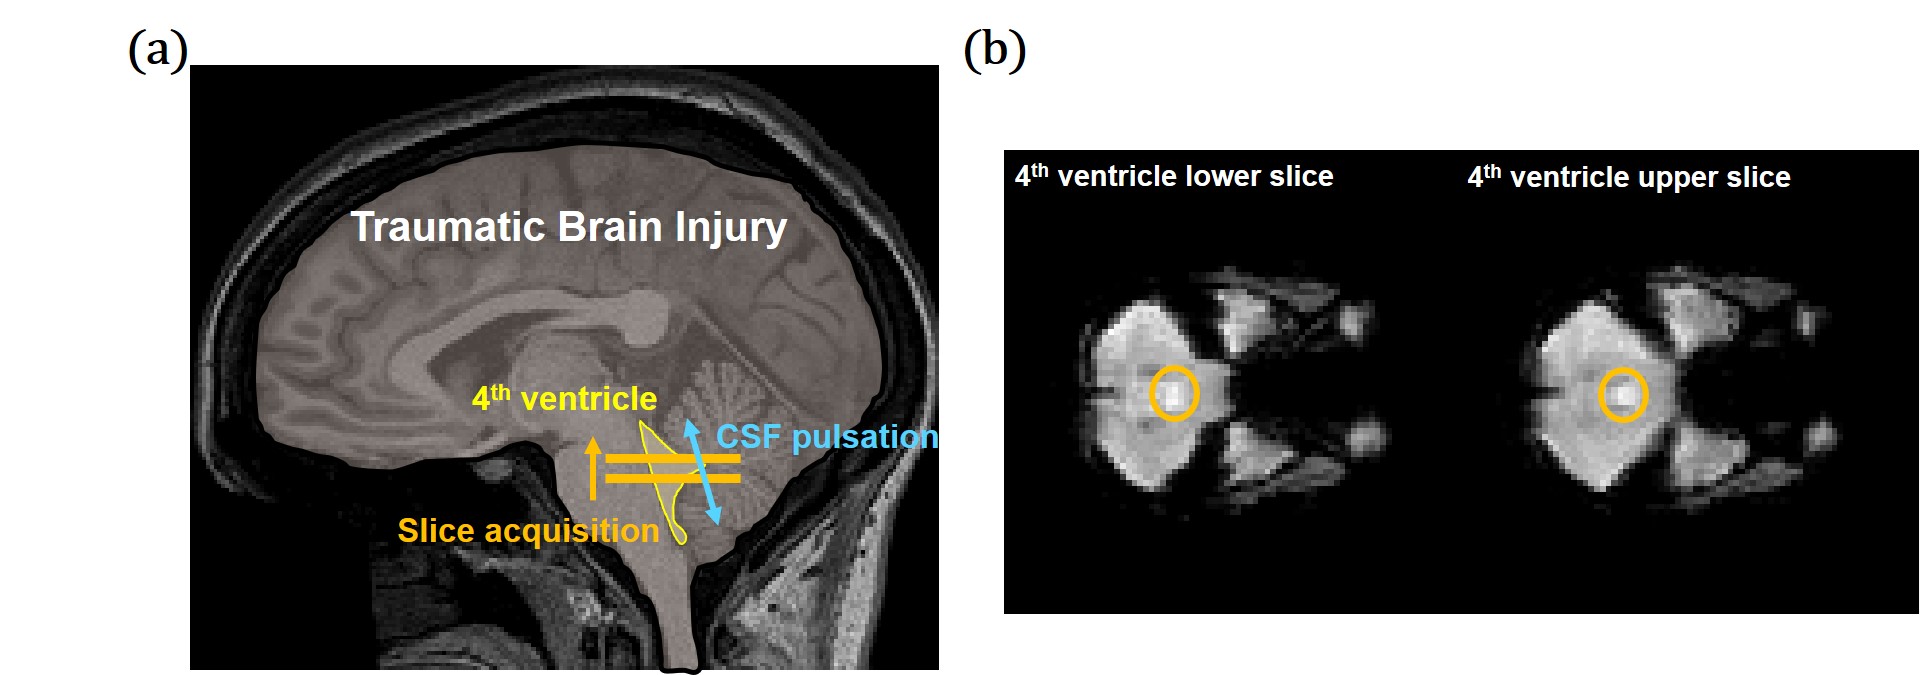
To measure CSF pulsation from fMRI data, we used interslice saturation effect during EPI acquisition. Based on the EPI MR signal simulation and CSF pulsation modeling, amount of CSF pulsation(CSFpulse) could be measured4. From the previous study, the CSFpulse was highly correlated with phase contrast MRI aqueductal stroke volume which reflects ventricular CSF pulsation. CSF signal from the two interleaved 4th ventricle slices were used for interslice CSF signals for CSFpulse processing (Fig.1.a, Eq.1). The quantitative metric of CSF pulsation (CSFpulse) was calculated as below to represent the interslice pulsed CSF volume. $$CSFpulse(n)=(S_{upper}(n)-S_{lower}(n))/(S_{lower}(n)×ρ-S_{lower}(n))×ROIvolume (Eq.1)$$where S(n) indicates signal intensity of nth measurement and ρ indicates the ratio between the pulsating CSF signal and non-pulsated steady state CSF signal4.
The ROI of 4th ventricle CSF was mapped manually referenced on the T1 anatomical image(Fig.1.b). After calculating CSFpulse from 144 EPI measurements(excluding first 6 measurements), we averaged them to represents the amount of CSF pulsation for each session.
Result
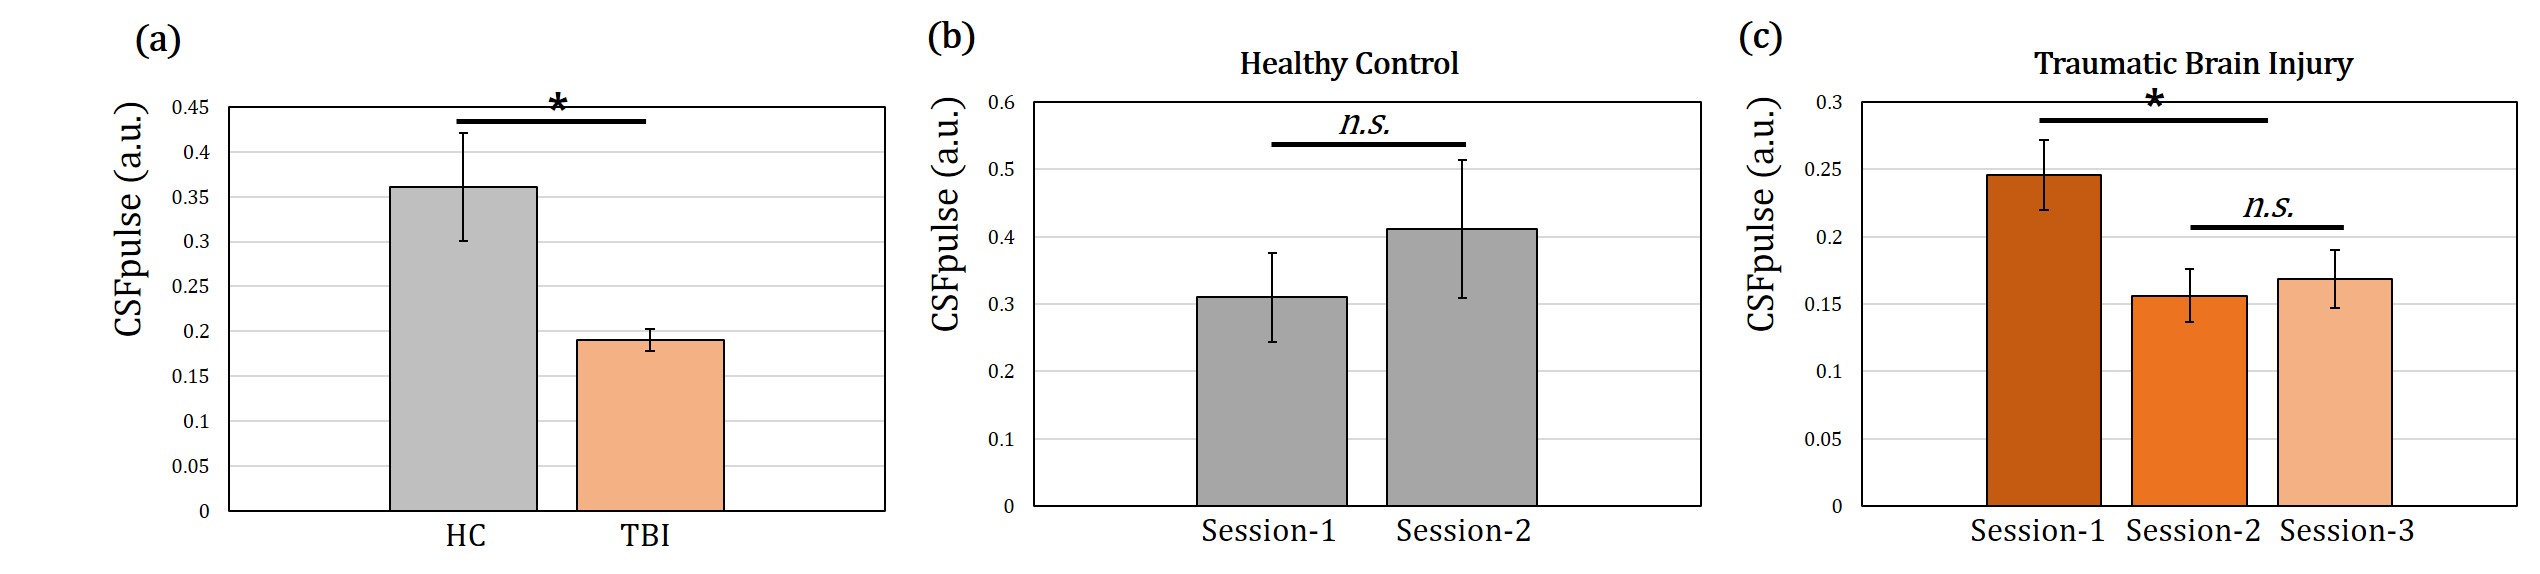
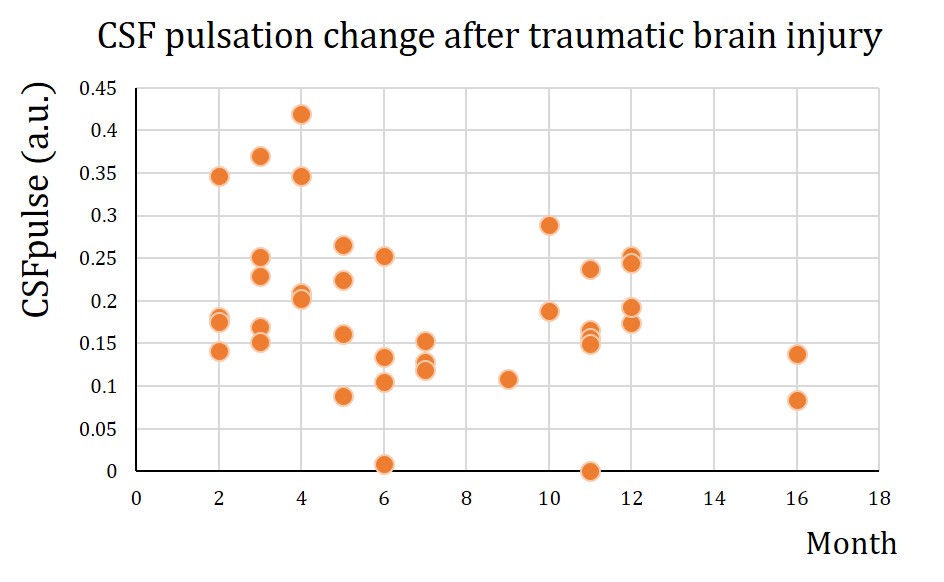
The CSF pulsation from all subjects was processed using CSFpulse model. First, we compared the difference between HC dataset and TBI dataset. The CSF pulsation of the HC dataset was significantly higher than that of the TBI dataset (HC all 2 sessions, 0.36±0.076, TBI all 3 sessions, 0.19±0.012; unpaired 2-sample t-test, p<0.01)(Fig.2.a). Second, we compared temporal difference of CSF pulsation from multiple sessions. HC data showed no statistical difference in CSF pulsation between session-1 and session-2 (Wilcoxon signed rank, p=0.4375) (Fig.2.b). For the TBI dataset, however, CSF pulsation of session-1 was significantly higher than that of session-2 and session-3 (p<0.05, Wilcoxon signed rank test with Bonferroni correction) (Fig.2.c), while no statistically significant difference between session-2 and session-3. Lastly, we demonstrated temporal changes in CSF pulsation from TBI. The CSF pulsation decreased from the healthy state until 8 months after the injury, and it seems to recover after 8 months (Fig.3).Discussion
In this study, we demonstrated the CSF pulsation changes after the TBI, by comparison with HC subjects (Fig.2). Additionally, we confirmed the altered CSF pulsation after TBI, which decreased significantly in early months (Fig.3). The tendency of CSF pulsation results was consistent with previous studies. The CSF pulsation of TBI patients were lower than that of control subjects both in human and mouse models6,7. Also, CSF dynamics were dysregulated in the initial stage after the injury and then gradually recovered thereafter 8. The mechanism of CSF alteration after TBI could be explained as ependymal ciliary loss or ICP increment or aquaporin-4 dysregulation7,8,9. This study can be expanded to post-TBI fMRI datasets in general to examine functional activity and CSF pulsation simultaneously.Acknowledgements
No acknowledgement found.References
[1] Kim, Jane J., and Alisa D. Gean. "Imaging for the diagnosis and management of traumatic brain injury." Neurotherapeutics 8.1 (2011): 39-53.
[2] Mott, Timothy, Michael L. McConnon, and Brian P. Rieger. "Subacute to chronic mild traumatic brain injury." American family physician 86.11 (2012): 1045-1051.
[3] Simon, Matthew J., and Jeffrey J. Iliff. "Regulation of cerebrospinal fluid (CSF) flow in neurodegenerative, neurovascular and neuroinflammatory disease." Biochimica et Biophysica Acta (BBA)-Molecular Basis of Disease 1862.3 (2016): 442-451.
[4] Kim, Jun-Hee, Jae-Geun Im, and Sung-Hong Park. "Measurement of CSF pulsation from EPI-based human fMRI." NeuroImage 257 (2022): 119293.
[5] Roy, Arnab, et al. "The evolution of cost-efficiency in neural networks during recovery from traumatic brain injury." PLoS One 12.4 (2017): e0170541.
[6] Pomschar, Andreas, et al. "MRI evidence for altered venous drainage and intracranial compliance in mild traumatic brain injury." PloS one 8.2 (2013): e55447.
[7] Xiong, Guoxiang, et al. "Traumatic brain injury-induced ependymal ciliary loss decreases cerebral spinal fluid flow." Journal of neurotrauma 31.16 (2014): 1396-1404.
[8] Ren, Zeguang, et al. "‘Hit & Run’model of closed-skull traumatic brain injury (TBI) reveals complex patterns of post-traumatic AQP4 dysregulation." Journal of Cerebral Blood Flow & Metabolism 33.6 (2013): 834-845. [9] Wagshul, Mark E., Per K. Eide, and Joseph R. Madsen. "The pulsating brain: a review of experimental and clinical studies of intracranial pulsatility." Fluids and Barriers of the CNS 8.1 (2011): 1-23.
Figures