3014
Extracellular Volume Change in the Human Brain During Sleep: Monitored by MRI-Compatible EEG and Measured by Sodium MRI1Radiology, NYU Grossman School of Medicine, New York, NY, United States, 2Neurology, NYU Grossman School of Medicine, New York, NY, United States, 3Neurology, NYU Langone Health, New York, NY, United States, 4Department of Computer Science, State University of New York at Binghamton, Binghamton, NY, United States, 5Radiology, NYU Langone Health, New York, NY, United States, 6Radiology, Stanford University, Stanford, CA, United States
Synopsis
Keywords: Neurofluids, Velocity & Flow, MRI-compatible EEG, Sodium MRI, Sleep, Extracellular Space
Sleep is reported in mince studies to increase extracellular space and improve CSF clearance of amyloid beta proteins from the animal brains. However, it is unclear whether sleep also benefits humans. This study used simultaneous MRI-compatible EEG to monitor sleep stage of human study subjects and used sodium MRI to quantify extracellular volume fraction. We seek to find the association between sleep stage and extracellular volume change in the human brain.INTRODUCTION
One of the major pathological biomarkers for Alzheimer’s disease (AD) is extracellular senile plaques formed by amyloid-beta (Aβ) proteins which are toxic to neurons. Recent studies in mice found that impairment of cerebrospinal fluid (CSF) clearance pathway led to a 70% reduction in Aβ clearance, suggesting that CSF may transport and remove Aβ from central nervous system 1, 2. They also found that sleep may benefit CSF clearance of Aβ proteins due to a 60% increase in extracellular space 3. However, it is unknown in humans whether sleep is associated with enlargement of extracellular space. In this study, we proposed to use sodium (23Na) MRI to non-invasively quantify the extracellular volume fraction in the human brain and measure its change during sleep monitored by MRI-compatible electroencephalogram (EEG). Outcomes of this study will help extend the knowledge of sleep-promoted Aβ clearance from animals to humans.METHODS
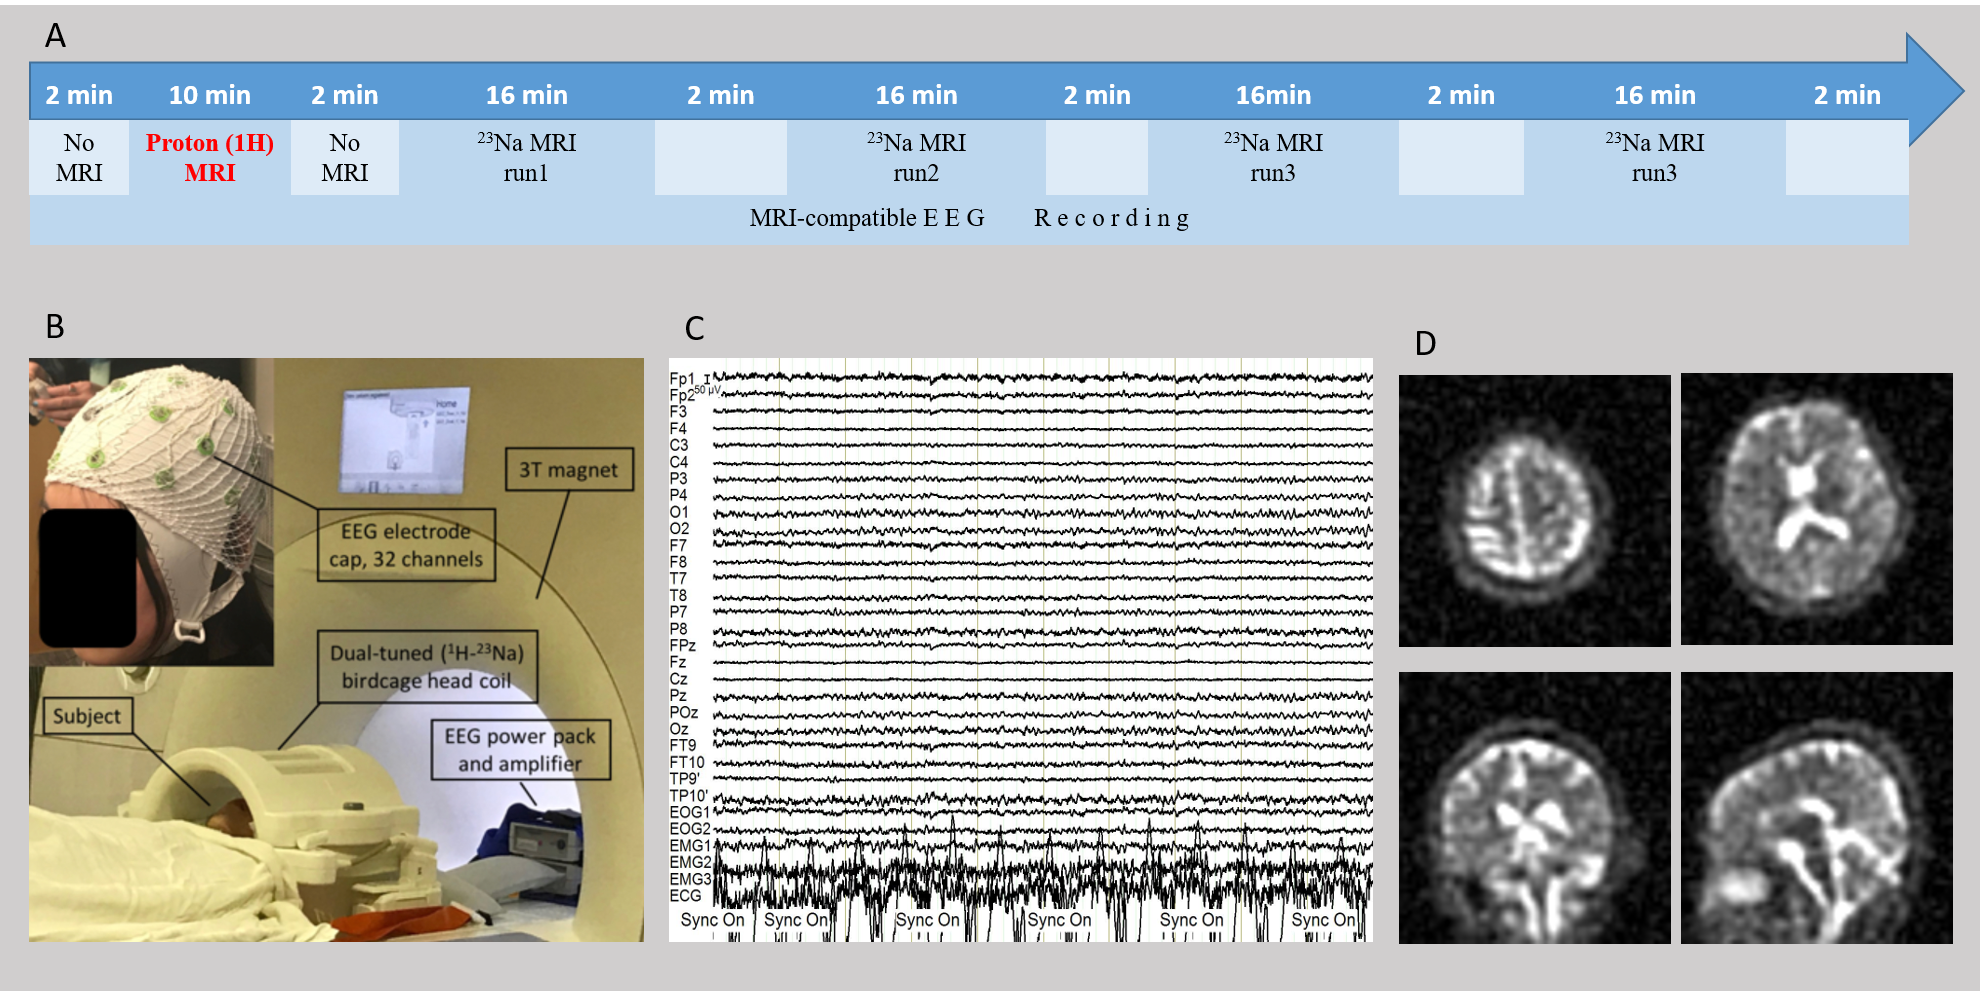
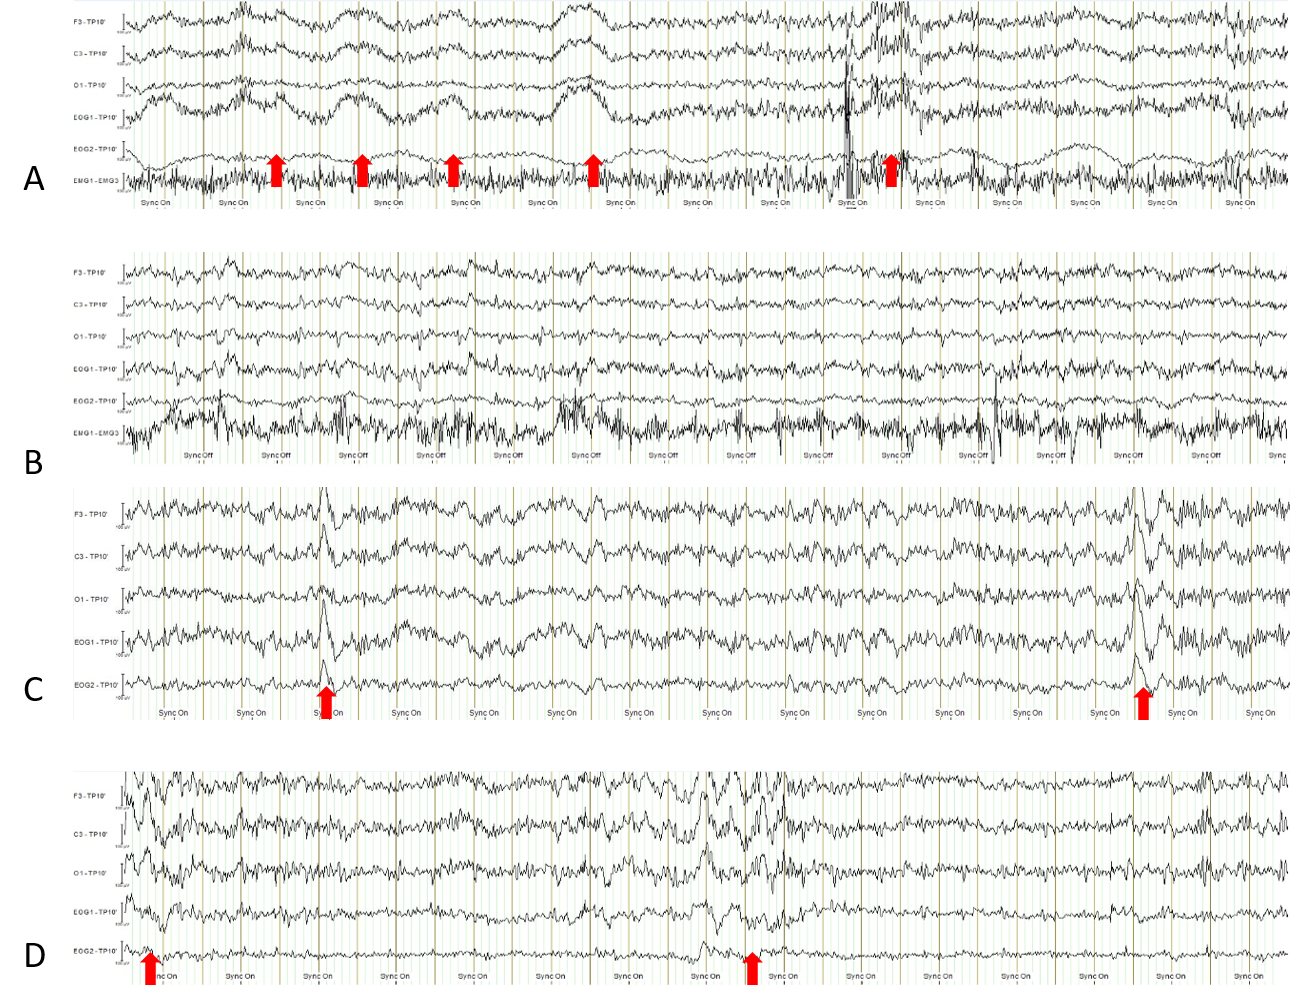
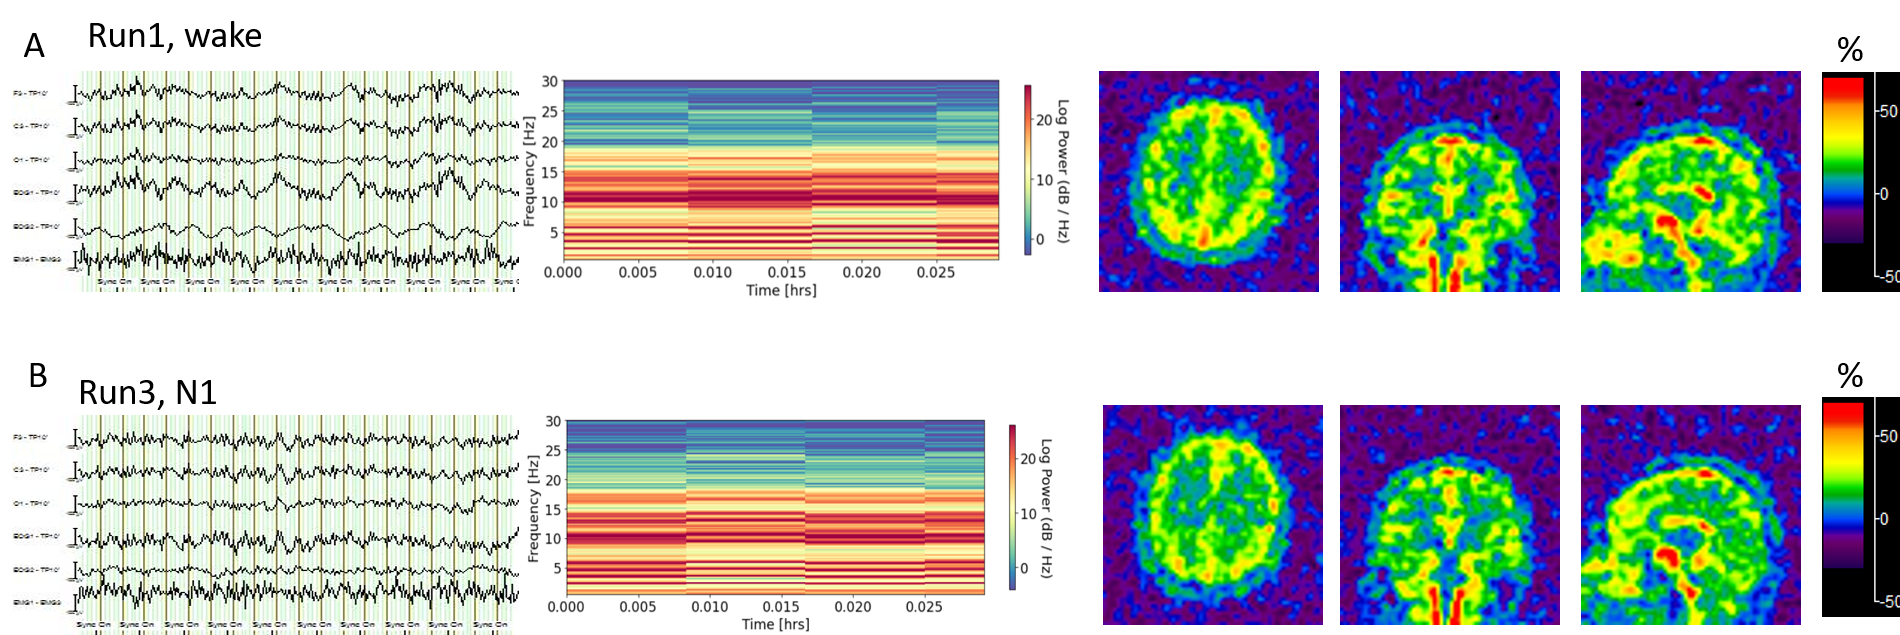
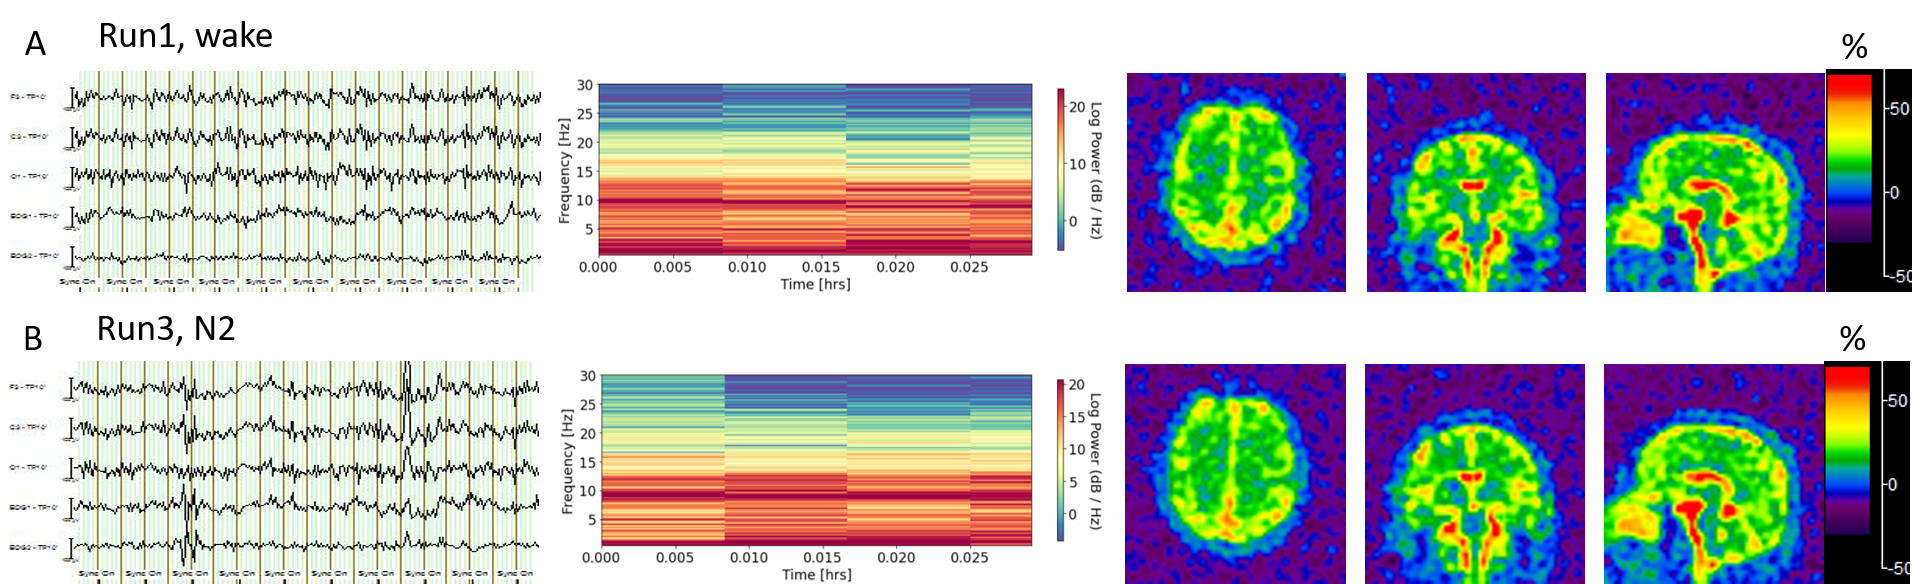
Six healthy volunteers of age 28–74 years, covering adult (25–44yr, N=3), middle aged (45–64yr, N=2), and older (≥65yr, N=1), were recruited in this study, with the approval of an Institutional Review Board (IRB). All the study subjects underwent a sleep-adaptive session of MRI scans (1.0 hour long) on a clinical scanner at 3T (Prisma, Siemens). Those who verbally confirmed falling asleep during the adaptive session were recruited for this sleep study. The study design is presented in Fig. 1, which lasts for 1.5 hours and includes four repeated runs of sodium MRI scans (16min each) and a continuous simultaneous MRI-compatible EEG recording (Brain Vision MR-compatible 32-channel, Garner, NC). Between the runs is a 2-min MRI pause for clean EEG recordings (i.e., no MRI interference). The study subjects were instructed to relax and sleep as deeply as possible during entire session. EEG recordings were performed at a sampling rate of 5 kHz and analyzed using vendor’s commercial software Analyzer 2.0 (BrainVision). The sleep was scored on the 2-min clean EEG segments into five stages (i.e., wake, N1, N2, N3, and REM, Fig. 2) according to the American Academy of Sleep Medicine (AASM) Manual for the Scoring of Sleep Version 2.6 4. The sodium MRI was performed with a dual-tuned (1H-23Na) birdcage volume coil (QED, Cleveland, OH), using a custom-developed pulse sequence, the twisted projection imaging (TPI) 5, with the acquisition parameters: FOV=220mm, matrix size=64, 3D isotropic, TE/TR=0.5/100ms, flip angle=90°, frames=6, p=0.4, and TA=16min. To quantify extracellular volume fraction (ECVF or ae), we used the approach reported in Ref. 6. Specifically, sodium signal at an imaging voxel is defined by voxel volume ΔV and intra-/extracellular volume fraction and sodium concentration C, i.e., s = ΔV (ae Ce + ai Ci) = ΔV (145 ae + 15 ai), with ae + ai = 1. Sodium signal is linearly calibrated into a known extracellular sodium concentration of 145mM at the vitreous humors (eye balls).RESULTS
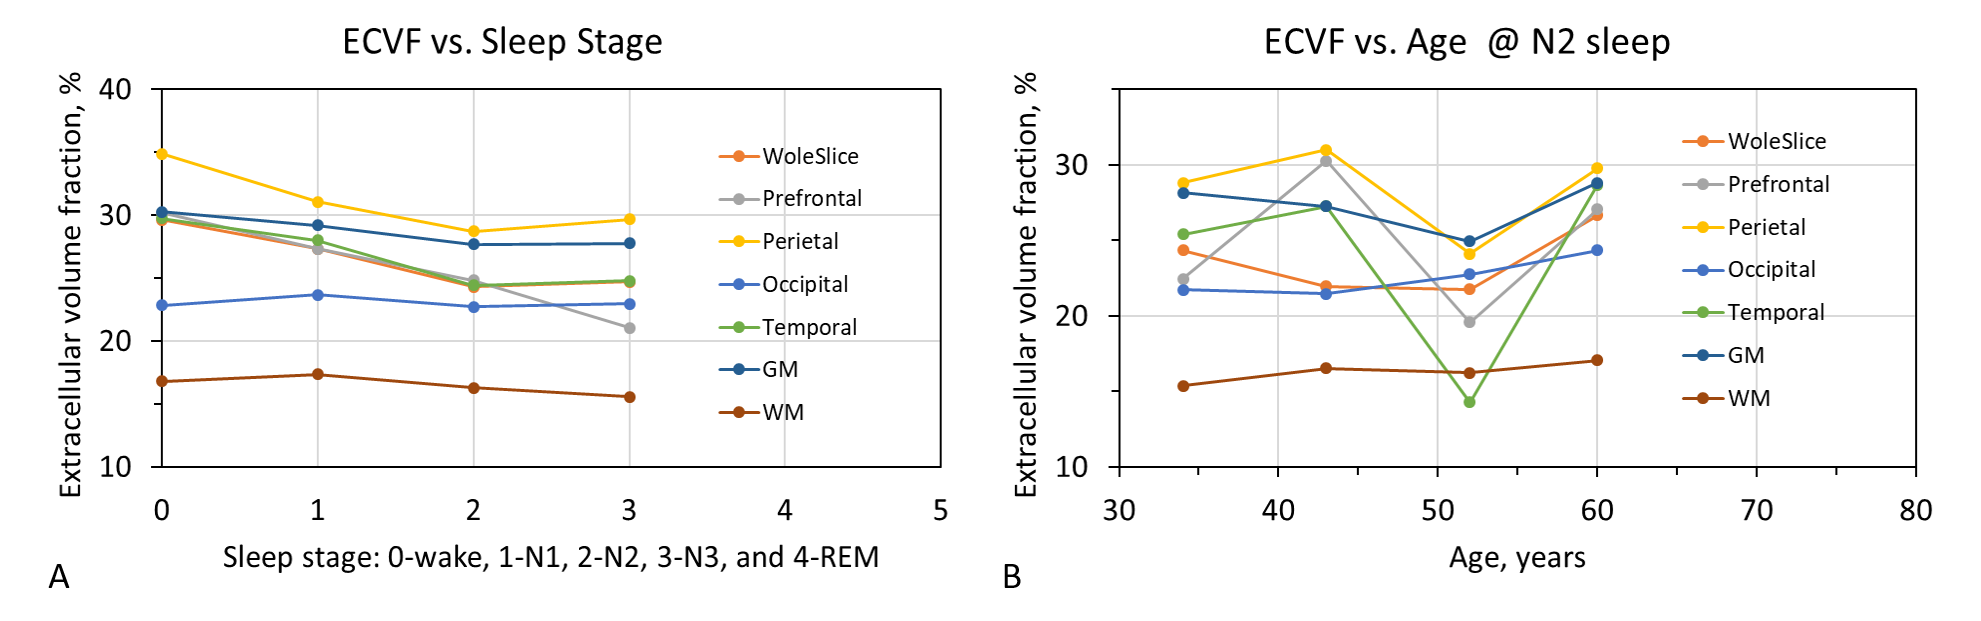
Most of the subjects reached N1 and N2 sleep (Fig. 2). Only one subject showed obvious N3 sleep (Fig. 2). Fig. 3 presents a typical case of EEG recordings and sodium MRI images on a young study subject (28-year-old male), showing the changes in sleep state and extracellular volume fraction from wake to sleep N1 state. Fig. 4 shows another case of a middle-age study subject (52-year-old male) who was in a sleep N2 state. Fig. 5 summarized our finding for the extracellular volume fraction varying with sleep state and subject’s age. At the group level, sleep did not increase the extracellular volume fraction. At individual subject level, sleep seemed to increase extracellular volume with aging in the occipital regions.DISCUSSION
Our results are very preliminary due the small sample size. Further studies are needed to confirm these findings. Sleep scoring on the EEG recordings in MRI scan room was very challenging that may bias our findings. Although the EEG data we used for scoring sleep stage were recorded without gradient or RF, we still observed larger artifacts, especially cardiac artifacts, compared to the data recorded outside of the magnet. This can be caused by magnetohydrodynamic effect 7. We need to address how this phenomenon would affect sleep scoring based on standard clinical criteria and correct such artifacts.Acknowledgements
This work was financially supported in part by the NIH RF1 AG067502 and the General Research Fund of the Department of Radiology. This work was also performed under the rubric of the Center for Advanced Imaging Innovation and Research (CAI2R, www.cai2r.net), an NIBIB Biomedical Technology Resource Center (NIH P41 EB017183).
References
1. Iliff JJ, Wang M, Liao Y, et al. A paravascular pathway facilitates CSF flow through the brain parenchyma and the clearance of interstitial solutes, including amyloid β. Sci Transl Med. 2012; 4(147):147ra111
2. Nedergaard M. Garbage truck of the brain. Science 2013; 340:1529-1530.
3. Xie L, Kang H, Xu Q, Chen MJ, Liao Y, Thiyagarajan M, O'Donnell J, Christensen DJ, Nicholson C, Iliff JJ, Takano T, Deane R, Nedergaard M. Sleep drives metabolite clearance from the adult brain. Science. 342 (6156): 373-377.
4. AASM. The AASM Manual for the scoring of sleep and associated events (V2.6). January 10, 2020.
5. Boada Boada FE, Gillen JS, Shen GX, Chang SY, Thulborn KR. Fast three dimensional imaging. Magn Reson Med 1997; 37:706-715.
6. Qian Y, Lakshmanan K, Ge Y, Lui YW, Wisniewski T, Boada, FE. Dynamic sodium (23Na) MRI for mapping CSF bulk flow in tissue extracellular space for clearance in human brains. In Proceedings of the 28th Annual Meeting ISMRM (Virtual), 8–14 August 2020, page 189.
7. Gray MA, Minati L, Harrison NA, Gianaros PJ, Napadow V, Critchley HD. Physiological recordings: Basic concepts and implementation during functional magnetic resonance imaging. NeuroImage 2009, Volume 47, Issue 3, 1105-1115. https://doi.org/10.1016/j.neuroimage.2009.05.033.
Figures