3013
Three-dimensional flow velocity of cerebrospinal fluid (CSF) in human brain during sleep via simultaneous EEG and dynamic sodium MRI
Ying-Chia Lin1, Xingye Chen1, Simon Henin2,3, Nahbila-Malikha Kumbella1, Liz Aguilera1, Zena Rockowitz3, Ashley Clayton3, James Babb1, Yulin Ge1, Arjun Masurkar2,3, Anli Liu2,3, Yvonne W. Lui1,4, Fernando E. Boada1,5, and Yongxian Qian1
1Department of Radiology, NYU Grossman School of Medicine, New York, NY, United States, 2Department of Neurology, NYU Grossman School of Medicine, New York, NY, United States, 3Department of Neurology, NYU Langone Health, New York, NY, United States, 4Department of Radiology, NYU Langone Health, New York, NY, United States, 5Department of Radiology, Stanford University, Stanford, CA, United States
1Department of Radiology, NYU Grossman School of Medicine, New York, NY, United States, 2Department of Neurology, NYU Grossman School of Medicine, New York, NY, United States, 3Department of Neurology, NYU Langone Health, New York, NY, United States, 4Department of Radiology, NYU Langone Health, New York, NY, United States, 5Department of Radiology, Stanford University, Stanford, CA, United States
Synopsis
Keywords: Neurofluids, Velocity & Flow, Sodium MRI, CSF flow, Sleep
Cerebrospinal fluid (CSF) flow plays a key role in clearance of waste proteins from the brain. Current proton (1H) MRI is limited to measurement of CSF flow in specific regions such as the aqueduct, due to the lack of capability distinguishing CSF from water. Sodium (23Na) MRI is uniquely sensitive to CSF, instead of water, and has the potential to measure CSF flow in entire brain. Here, we use a recently-developed dynamic sodium MRI to measure CSF flow velocity in the brain and to understand how it changes with sleep state monitored by MRI-compatible EEG.INTRODUCTION
Cerebrospinal fluid (CSF) flows through the brain to bring nutrients into and remove waste proteins from the brain. Sleep has been shown in recent animal studies to improve CSF clearance of waste 1. Disruption of CSF clearance pathway leads to accumulation of waste proteins such as amyloid beta (Aβ) which is toxic to neurons and may cause Alzheimer’s disease 2. However, it is unknown how alteration in CSF flow affects waste clearance in humans. Current proton (1H) MRI is limited to measurement of CSF flow in specific regions such as the aqueduct, due to the lack of capability distinguishing CSF from water 3,4. Sodium (23Na) MRI is uniquely sensitive to CSF movement from interstitial space subarachnoid space, and has the potential to measure CSF flow in tissues across the entire brain. Here, we use a recently-developed dynamic sodium MRI technique 5 to measure CSF flow velocity in the human brain and extend the flow velocity from 2D to 3D, and to understand how CSF flow velocity changes with sleep state.METHODS
The dynamic sodium MRI is performed in a view-sharing fashion using interleaved k-space acquisitions along the time frames (Fig. 1). Specifically, the k-space data are acquired along the 1st ring (kz ≈ 0) of the twisted projection imaging (TPI) trajectory (Fig. 1A) 6 for the 1st frame, followed by the 2nd, 3rd frames, and so on. Then, data are acquired along the 2nd ring (of an increased kz) for the 1st, 2nd, 3rd and 4th frames, and so on, until all the rings are acquired (Fig. 1B). In this fashion, each frame has a full k-space sampling. The sodium MRI was performed on a clinical scanner at 3T (Prisma, Siemens, Erlangen, Germany), with a dual-tuned (1H-23Na) birdcage volume coil (QED, Cleveland, OH), and the acquisition parameters: FOV=220mm, matrix size=64, 3D isotropic, TE/TR=0.5/100ms, flip angle=90°, frames=6, p=0.4, and TA=16min. Based on these time frames, velocity map (vector field) was created using an open-source software called OpenPIV (Open Particle Image Velocimetry) 7. Sleep state was monitored by simultaneous MRI-compatible EEG (Brain Vision, 32-channel, Garner, NC) (Fig. 2A). The study lasted for 90 mins, and the study subjects were instructed to close their eyes, relax the body, and fall asleep. The sleep was scored on the 2-min clean EEG segments into five stages (i.e., wake, N1, N2, N3, and REM) according to the American Academy of Sleep Medicine (AASM) Manual for the Scoring of Sleep Version 2.6 8. Six healthy volunteers of age 28–74 years were recruited in this study, with the approval of an Institutional Review Board (IRB).RESULTS
Fig. 2 shows the results from a 74-year-old male study subject of normal cognition. During the 90-min study, the subject was in light sleep (N1, N2) with intermittent slow wave activity (SWA) attributed to K-complexes, followed by autonomic arousal, as identified in the EEG spectrogram. Also shown in the figure is the association among the EEG signal, SWA, sleep spectrum, dynamic sodium MRI, and 3D CSF flow velocity (Fig. 2B–D). The 3D dynamic sodium MRI images of the same subject (74 y/o, male) are shown in Fig. 3 for six-time frames at an interval of 9 sec. These dynamic sodium images show the flow of CSF through whole brain. Fig. 4 presents a whole picture of the 3D CSF velocity map of the subject across the 6 runs and 5 time-points. We found that the mean magnitude of velocity in whole brain was decreased with age by 41.8% (0.141 vs. 0.059 mm/s) from the young adult (28 y/o, male) to the older subject (74 y/o, male) (Fig. 5).DISCUSSION
The advantage of sodium MRI for studying CSF clearance in humans derives from sodium concentrations that are ~10 times higher in CSF than in intracellular space in the human brains (145 mM vs. 15 mM). The decrease of CSF velocity is confirmed with a recent report showing a reduction in CSF mean diffusivity in an overnight sleep study on 18 heathy young subjects 9.CONCLUSION
These preliminary results demonstrated the technical feasibility of our 3D CSF velocity measurement, and supported our hypothesis about the impact of sleep on CSF flow. We explored the CSF velocity in whole brain and the sleep impact on CSF flow. These results are consistent with what we expect for the relationship between CSF flow and aging. However, they need more study subjects to confirm the statistical significance.Acknowledgements
This work was financially supported in part by the NIH RF1 AG067502 and the General Research Fund of the Department of Radiology. This work was also performed under the rubric of the Center for Advanced Imaging Innovation and Research (CAI2R, www.cai2r.net), an NIBIB Biomedical Technology Resource Center (NIH P41 EB017183).References
- Xie L, Kang H, Xu Q, Chen MJ, Liao Y, Thiyagarajan M, O’Donnell J, Christensen DJ, Nicholson C, Iliff JJ, Takano T. Sleep drives metabolite clearance from the adult brain. science. 2013 Oct 18;342(6156):373-7.
- Tarasoff-Conway JM, Carare RO, Osorio RS, Glodzik L, Butler T, Fieremans E, Axel L, Rusinek H, Nicholson C, Zlokovic BV, Frangione B. Clearance systems in the brain—implications for Alzheimer disease. Nature reviews neurology. 2015 Aug;11(8):457-70.
- Venkataraman A, Deane R, Zhong J. CSF Flow and Aging: An Early Marker of Pathology? In: Proceedings of the 27th ISMRM Annual Meeting, Montreal, Canada. May 11-16, 2019. p.2549.
- Horie T, Kajihara N, Saito H, Shibukawa S, Takano S, Konta N, Obara M, Ogino T, Niwa T, Kuroda K, Matsumae M. Visualization of irregular CSF flow by dynamic iMSDE SSFP using acceleration-selective motion - sensitized gradient (AS-MSG). In: Proceedings of the 27th ISMRM Annual Meeting, Montreal, Canada. May 11-16, 2019. p.2550.
- Qian Y, Lakshmanan K, Ge Y, Lui YW, Wisniewski T, Boada, FE. Dynamic sodium (23Na) MRI for mapping CSF bulk flow in tissue extracellular space for clearance in human brains. In Proceedings of the 28th Annual Meeting ISMRM (Virtual), 8–14 August 2020, page 189.
- Boada FE, Gillen JS, Shen GX, Chang SY, Thulborn KR. Fast three dimensional sodium imaging. Magn Reson Med. 1997 May;37(5):706-15.
- https://github.com/OpenPIV
- AASM. The AASM Manual for the scoring of sleep and associated events (V2.6). January 10, 2020.
- Tuura RO, Volk C, Jaramillo V, Huber R. Sleep-related changes in diffusivity overnight: a window into glymphatic activity in humans? In: Proceedings of the 27th ISMRM Annual Meeting, Montreal, Canada. May 11-16, 2019. p.752.
Figures
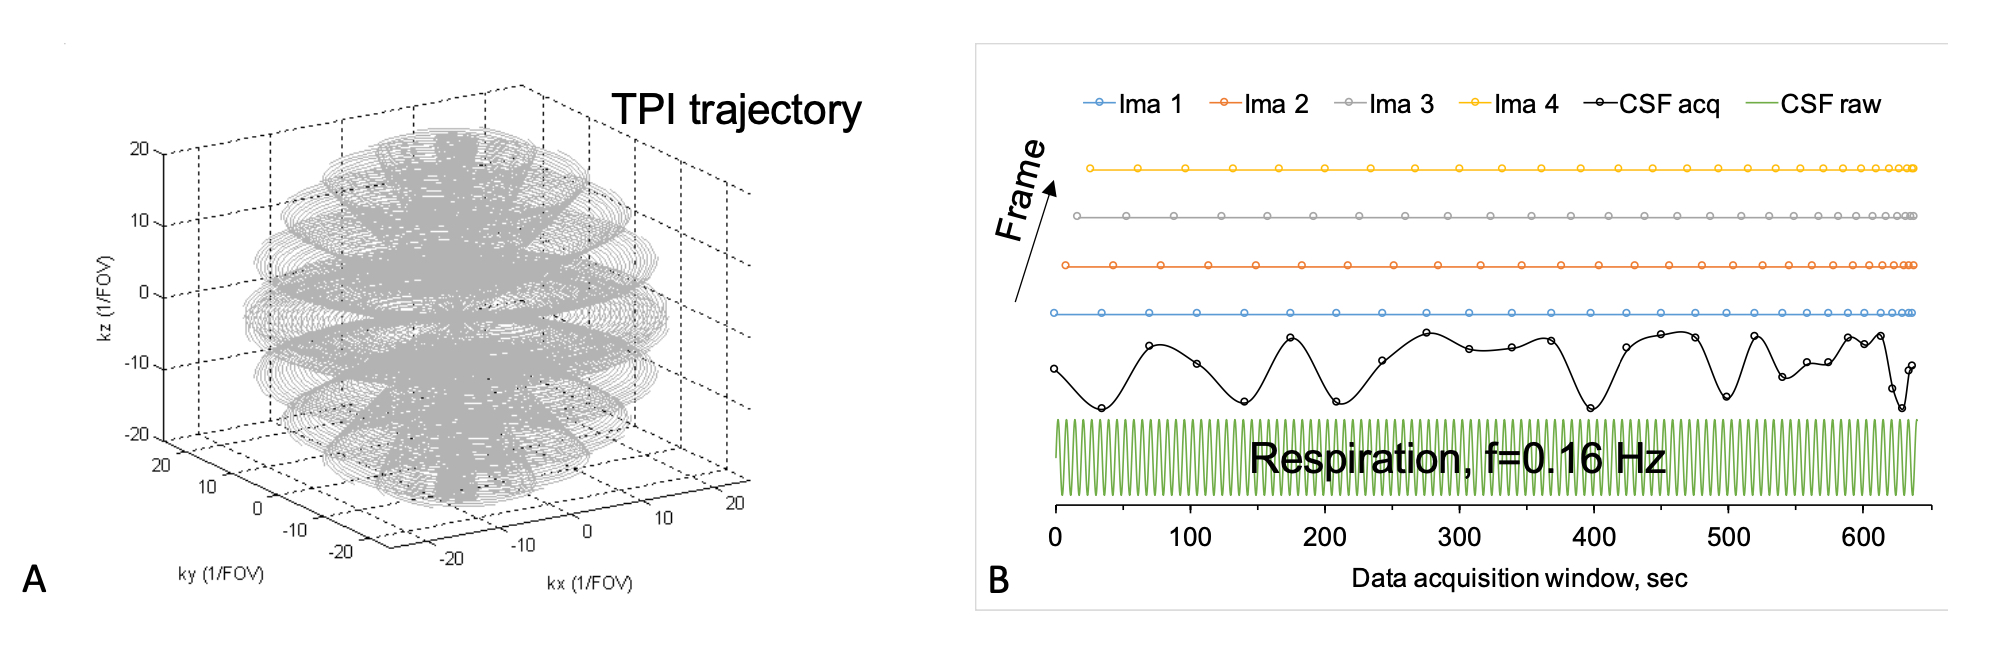
Fig.
1. Dynamic sodium MRI: A) the 3D k-space
sampling along the TPI trajectory 6 for each frame, B) the interleaved data
acquisition (dots) for 4 frames: starting
the 1st ring (±kz≈0)
for the 1st frame followed by the 2nd, 3rd frames, and so on, and then,
until
all the rings are acquired. The bottom is an example showing the measured (black) and true (green)
sodium signals varying with respiration. CSF signal changes with time frame (ima)
from the dynamic MRI against the true (raw) value at respiration frequency 0.16
Hz.
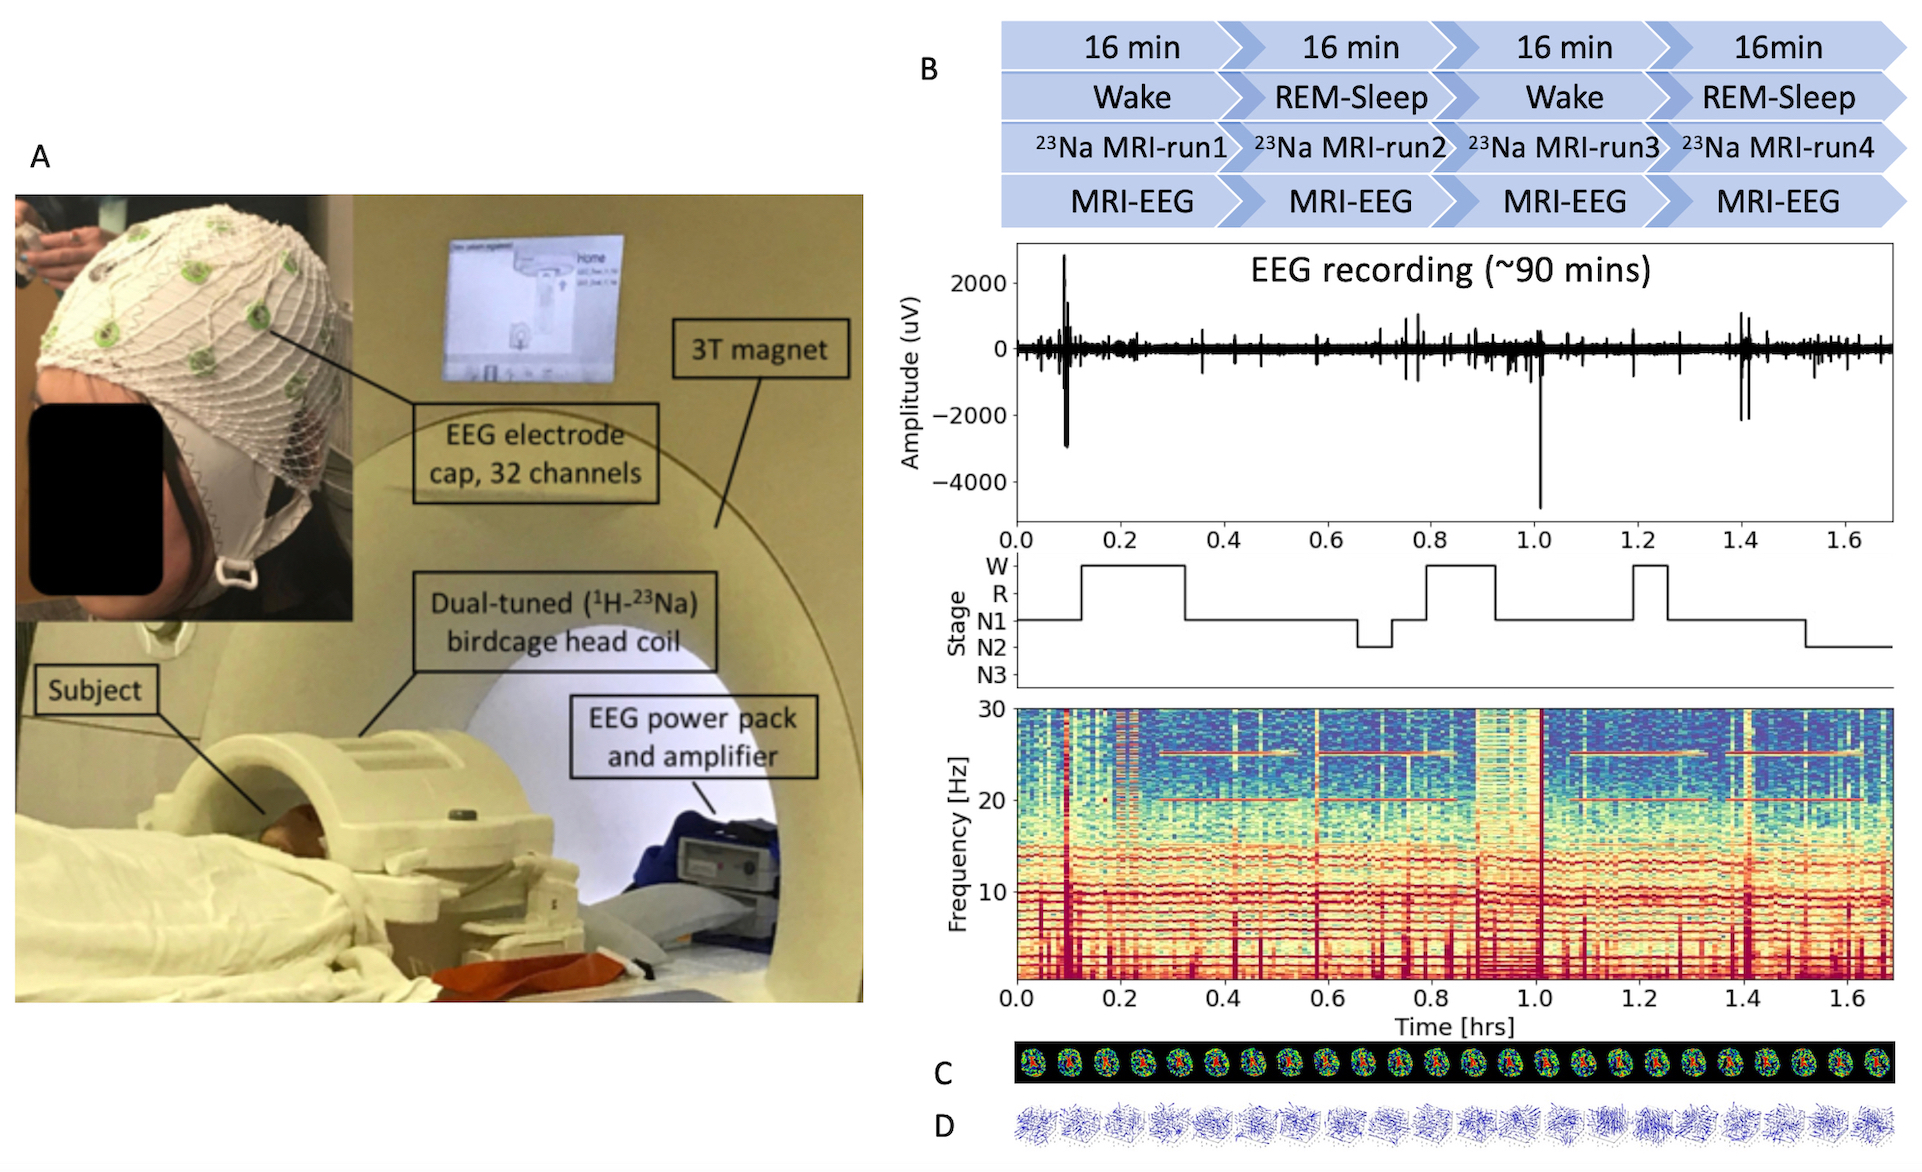
Fig.
2. Overview of the 3D CSF velocity measurement via simultaneous EEG and sodium MRI at
3T. A) Setup of the MRI-EEG systems. B) Timing between sodium MRI scans and EEG
recordings. Each sodium MRI scan runs 16min for 6 frames. The EEG recording continues for
90min. Sleep stage progresses from wake to NREM, and to REM sleep or wake, and
is illustrated with hypnogram and time-frequency map. C) 3D CSF velocity field
map at the time frames of 1st- to 4th-run of sodium MRI (totaling 20
dynamic time frames). D)
dynamic 3D velocity magnitude of
CSF flow at different time points.
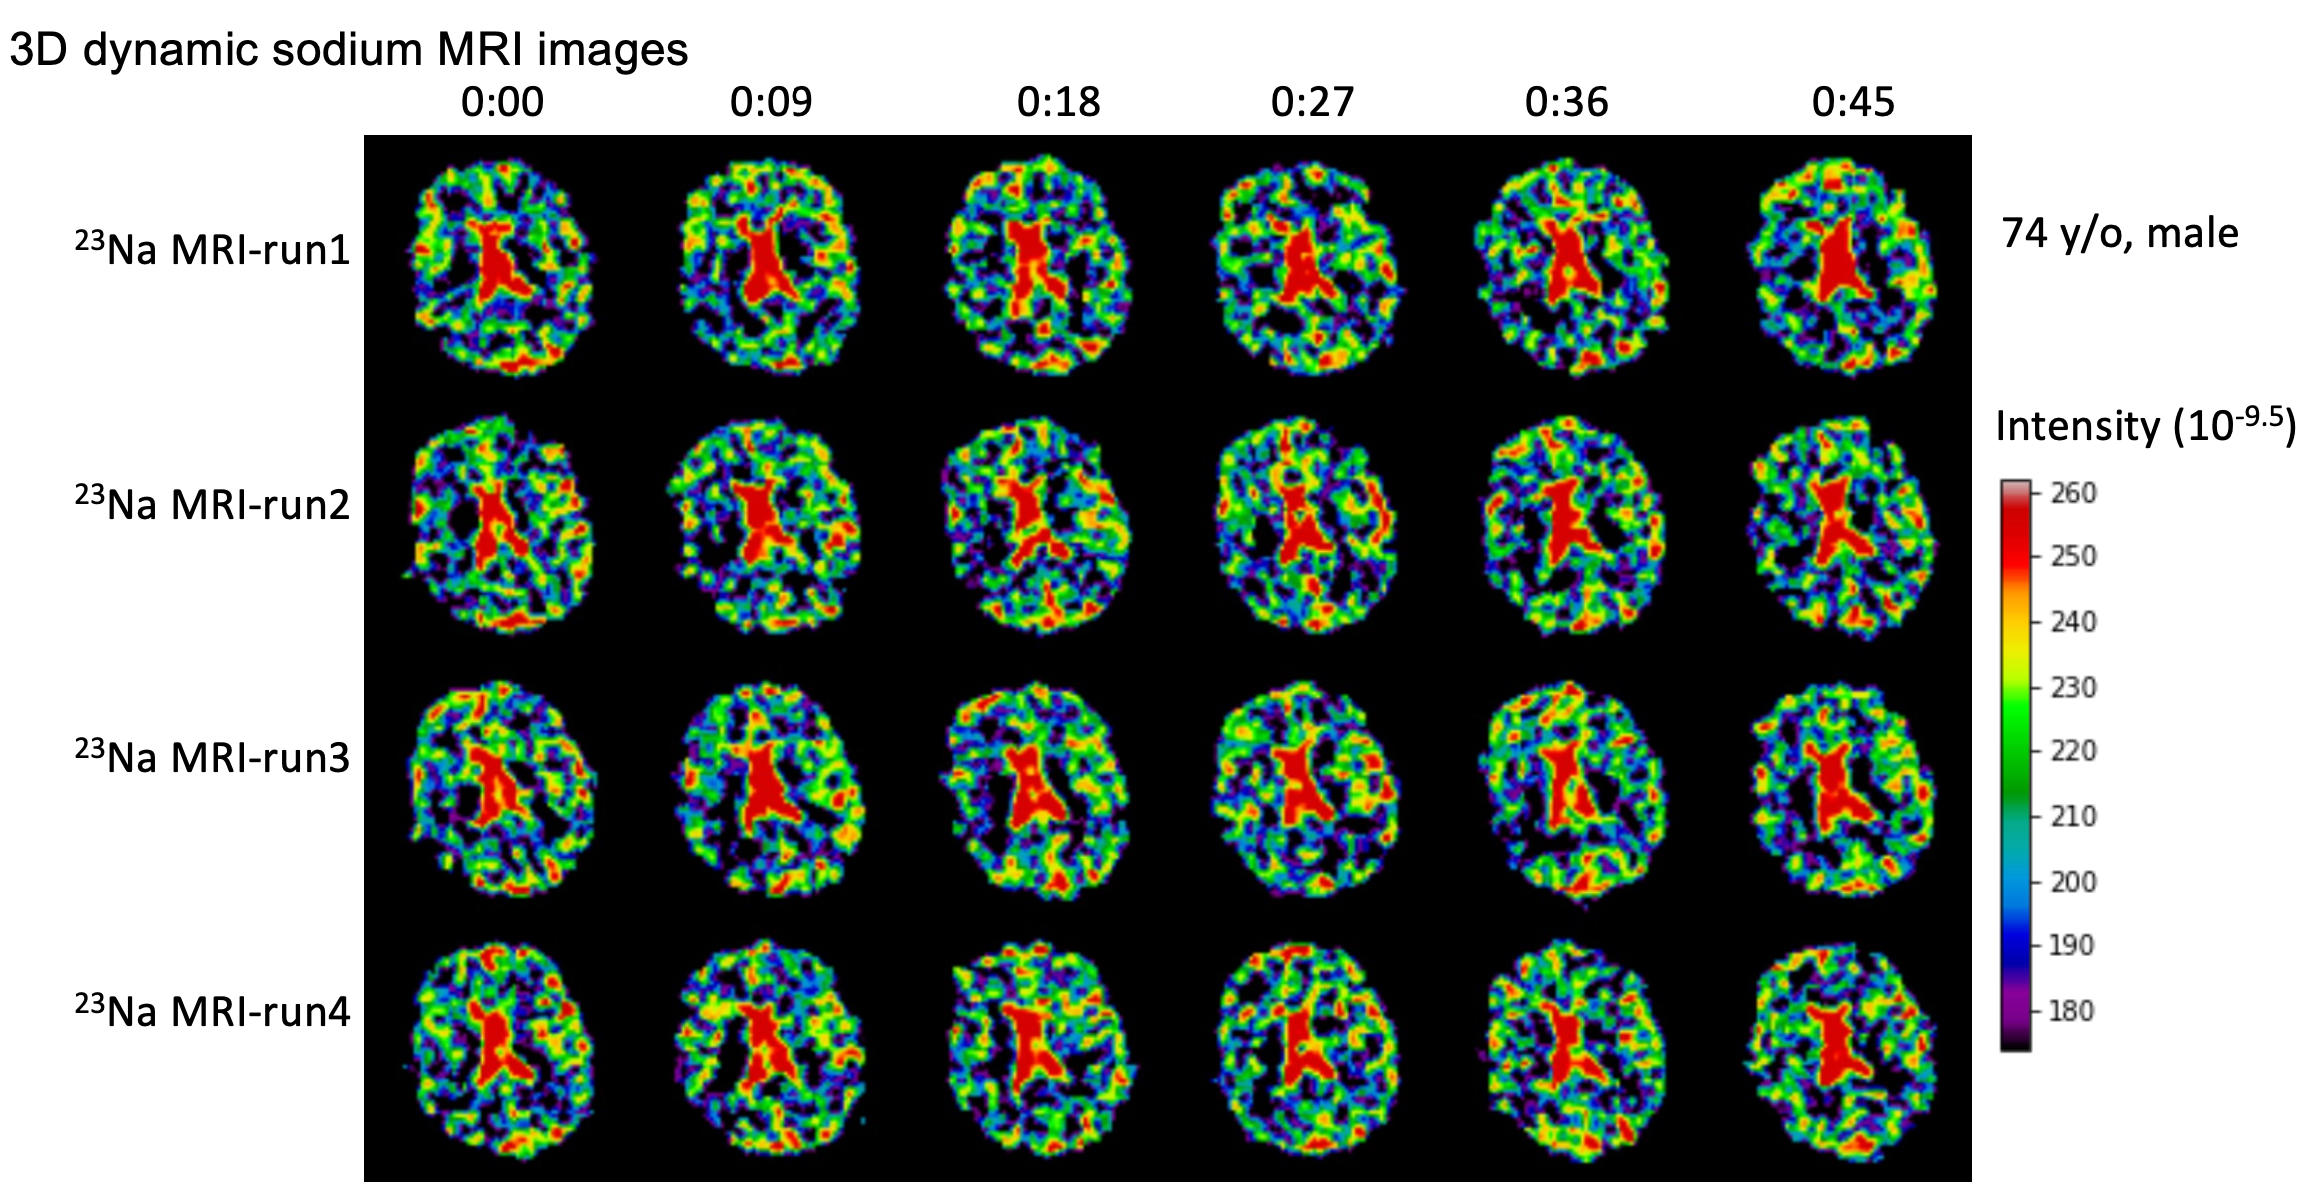
Fig.
3. Representative of the 3D dynamic sodium
MRI images of an older study subject (74 y/o, male), with 6 frames at an
interval of 9 sec. These dynamic sodium images show the flow of CSF through
whole brain.
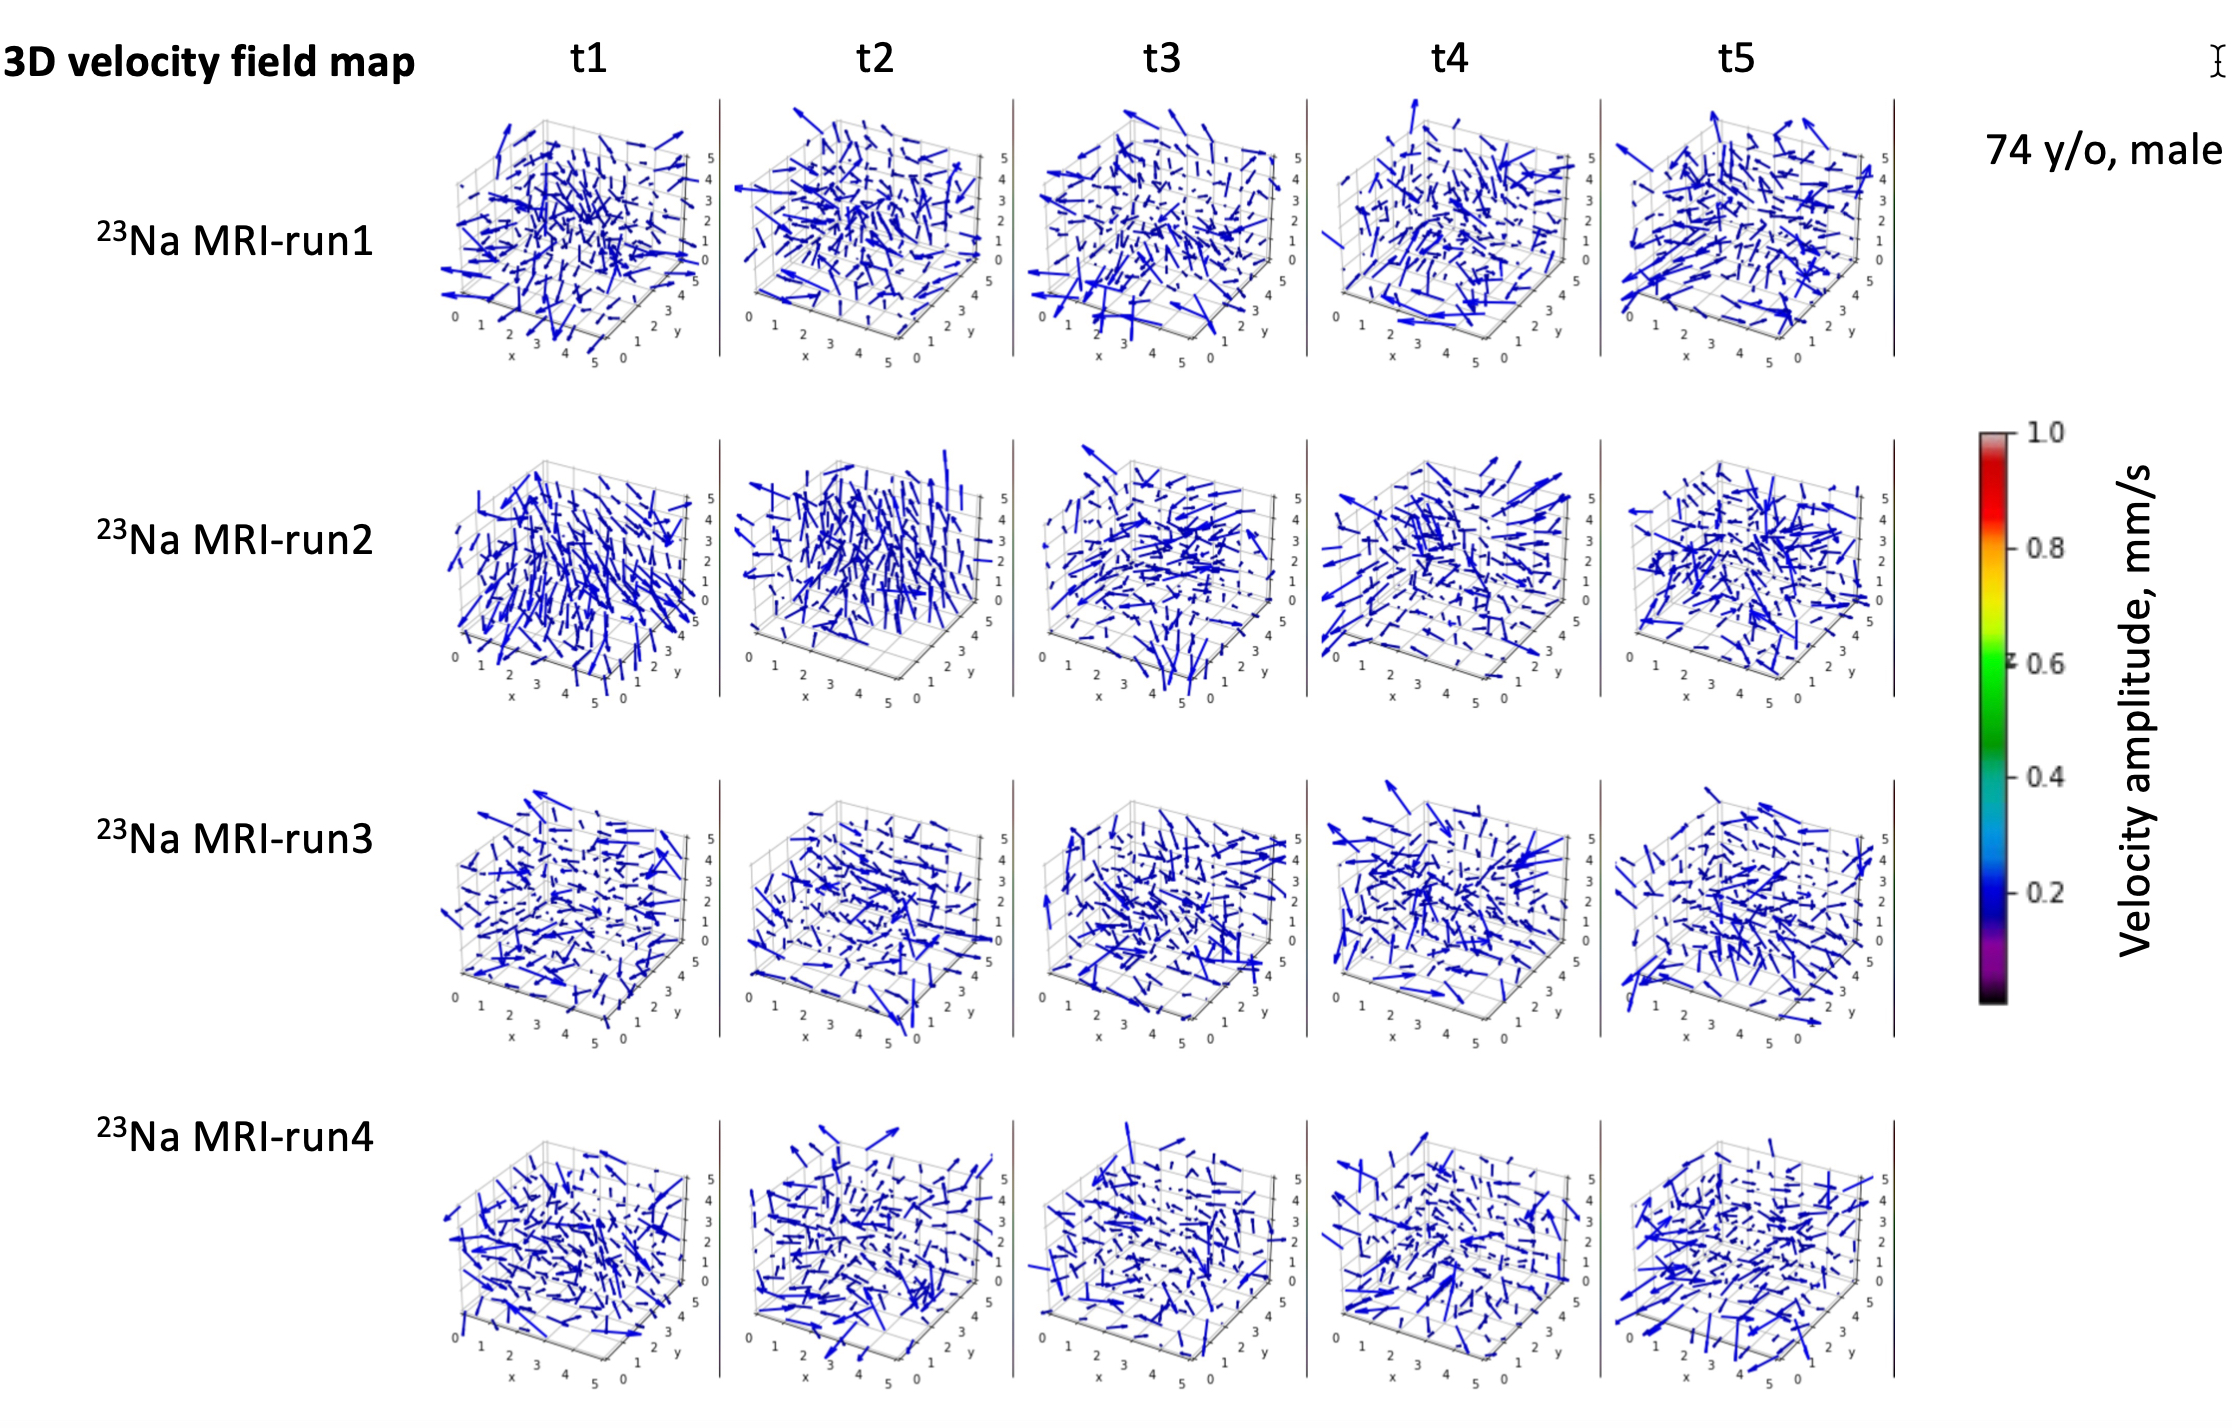
Fig.
4. A typical 3D CSF velocity field map (vector field) on the 74-year-old study
subject (Fig. 3). The
maps were calculated on
the time frames in Fig. 3, using an open-source software called OpenPIV
(open Particle Image Velocimetry) in python version 7. OpenPIV calculates pixel velocity (magnitude and
direction) between time frames using a correlation between the image patches in
an interrogation window centered at the pixel. In this study, we performed OpenPIV
with an interrogation window size of 4x4 pixels and 50% of overlap in
percent of the window size for the best outputs.
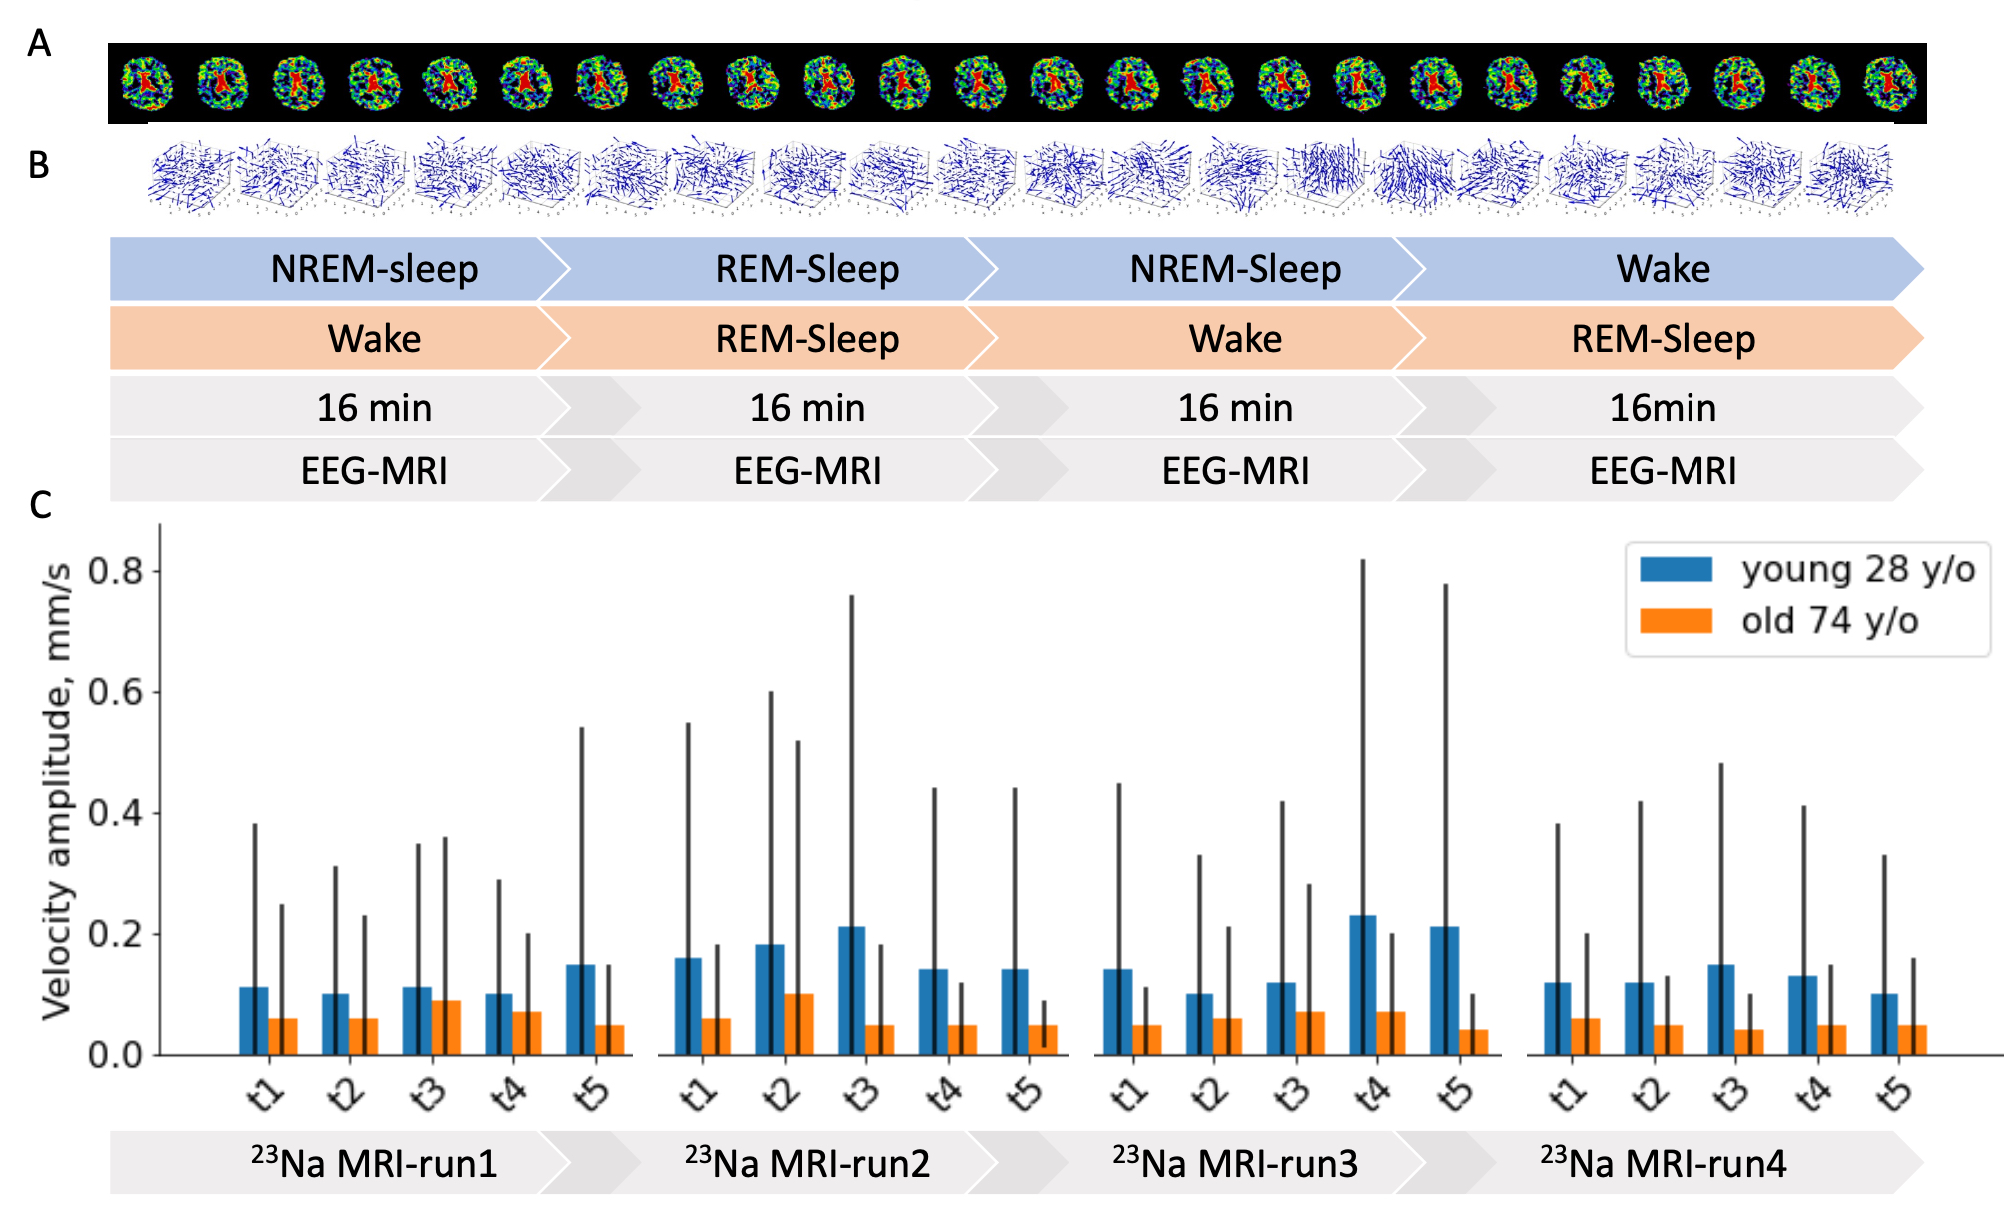
Fig.
5. Comparison in averaged velocity between two
male subjects of age 28 and 74 y/o: A) Time
frames of the 28 y/o, B)
3D velocity
field map between the frames for the 72 y/o, and C) the
mean whole brain velocity.
The mean and standard deviation (SD) of
the magnitude on the velocity map at each frame, and chose the frame of the max
mean velocity magnitude to represent the subject.
DOI: https://doi.org/10.58530/2023/3013