3012
Assessment of CSF pulsatility in the fourth ventricle using EPI phase contrast and fMRI sequences.1CerCo, UMR 5549, CNRS/Toulouse 3 University, Toulouse, France
Synopsis
Keywords: Neurofluids, Velocity & Flow, Cerebrospinal fluid
Papers have shown a correlation between CSF flow in the fourth ventricle (V4) and EEG, and also that the low-frequency components (LFC) of EEG were positively correlated with glymphatic system (GS) activity. Analysis of the LFC of CSF flow could be a biomarker of GS degradation. We assessed 6 individuals by using an EPI phase contrast sequence to quantify the time evolution of CSF velocity in V4, and a fMRI sequence with which we exploited the inflow effect phenomenon. EPI-PC highlights the frequencies of physiological phenomena involved in CSF motion, and allows us to quantify LFC, indicative of GS efficiency.Introduction
Age-related alterations in the properties of cerebrospinal fluid (CSF) flow have been consistently reported in humans1-5, and have been associated with cognitive impairment6,7, dementia8 and Alzheimer's disease9. The CSF has a major role in clearance of metabolic waste, e.g. protein aggregates, from brain parenchyma interstitial fluid through the glymphatic system (GS)10. In particular, low-frequency components (LFC) of CSF pulsatile flow could be characteristic of GS activity11,12. Accordingly, CSF flow properties may provide a relevant marker in aging, enhancing the need for its accurate assessment in vivo with MRI. Recently, evaluation of CSF flow frequency components in the fourth ventricle (V4) using resting-state functional MRI (fMRI) has been performed exploiting the inflow effect, which occurs when a fluid penetrates a slice during its acquisition. This results in a hyper-signal in the concerned area. During sleep and wakefulness, CSF LFC patterns in V4 were coupled with cortical patterns assessed with BOLD fMRI and EEG, suggesting feasibility of GS evaluation with real-time MRI CSF flow measures11,12. Here we used an EPI phase-contrast sequence (EPI-PC) to measure these low-frequency components and compared results with those obtained using fMRI.Methods
- Six healthy volunteers (5 women ; age 25.3 ± 2.3 y/o, range 22-29) with no neurological history underwent 3T MRI (Philips Achieva) examination. The study was approved by the local Ethics Committee and informed consents were collected.
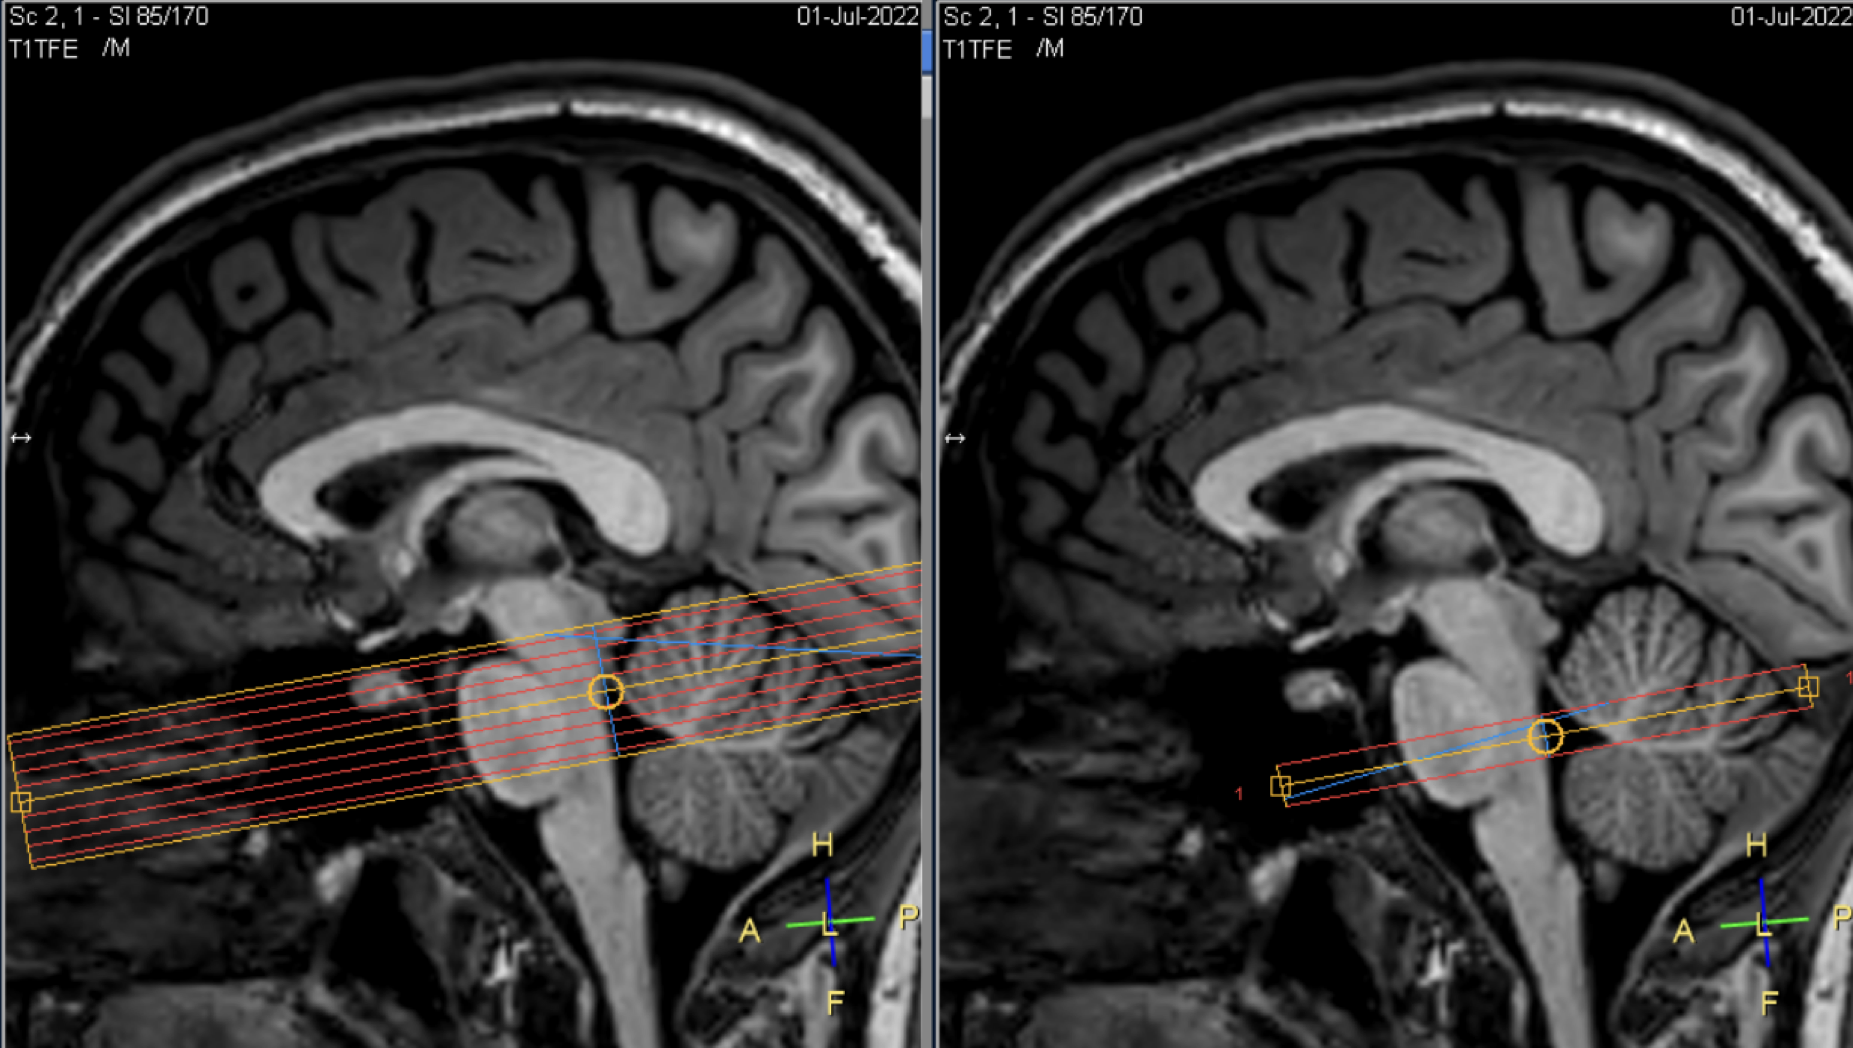
- MRI acquisition: To study CSF flow in V4, we used 2 sequences with similar temporal resolution : (1) EPI-PC sequence with spatial resolution=0.5x0.5x7mm3, single slice with 650 time-points, TR=440ms, TE=16ms, FA=15°, EPI factor=11 (multishot), SENSE=1.2, Venc=1~3 cm.s-1, total scan duration=4min. The encoding velocity was adjusted for each participant to avoid aliasing. (2) gradient-echo EPI T2*-weighted fMRI sequence with spatial resolution=2.5x2.5x2.5mm3, 9 contiguous slices with 1000 time-points, multiband factor=3, TR=450ms, TE=23ms, EPI factor=67 (singleshot), SENSE=1.2, total scan duration=7min30s. The fMRI bottom slice and the EPI-PC slice had identical positions, i.e. intersecting V4 with an axial oblique orientation (Figure 1). T1-weighted high-resolution anatomical images were also acquired.
- Image processing: Images from the fMRI sequence were first corrected by a slice timing step using SPM. The regions of interest (ROI) were then manually defined using MRIcron. For the functional images, we selected voxels from the two bottom slices whose intensity changes over time, thus voxels sensitive to the inflow effect, characteristic of CSF caudocranially entering the volume from beneath. As for EPI-PC images, we selected voxels located in V4 whose intensity changed over time, characteristic of a change in CSF velocity at that location.
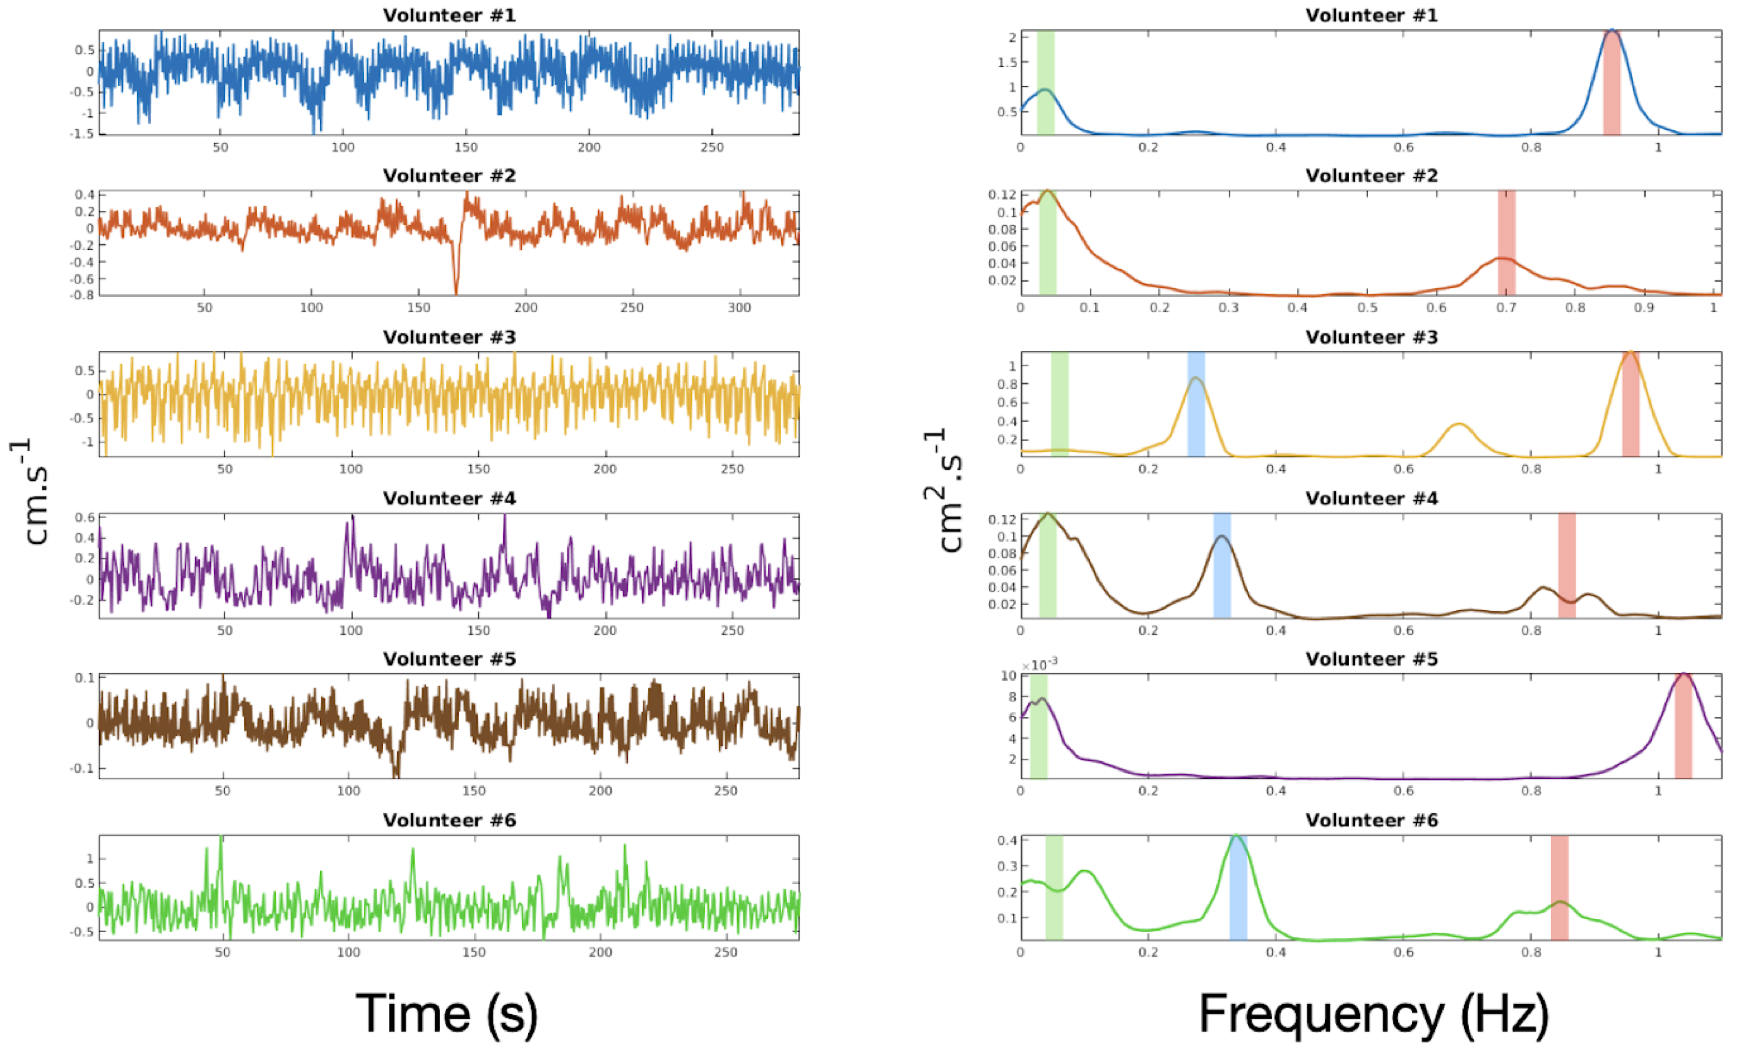
- Frequency analysis: The mean values of voxel intensities located in the ROIs (arbitrary value for fMRI and cm.s-1 for PC) were plotted against time, thus constituting a signal representative of CSF motion in V4. Then, we detrended the signal and computed the Power Spectral Density (PSD) by using multitaper spectral estimation (5 tapers). We looked at whether EPI-PC revealed the frequencies of the physiological phenomena involved in the motion of the CSF, in this case a peak at very low frequencies (0Hz-0.1Hz), a peak associated with breathing (0.2Hz-0.4Hz), and a peak associated with the heartbeat (0.8Hz-1.2Hz). Then, we tested the reproducibility of the measurement in a single individual, to ensure that under similar experimental conditions the same frequencies were detected (both sessions were held at 2 pm). Finally, we compared the results between the fMRI and PC-EPI sequences to see if the spectra were similar between the two modalities.
Results
- PSDs calculated from the temporal evolution of CSF velocity in V4 highlight the frequencies of the physiological processes involved in the movement of this fluid (Figure 2).
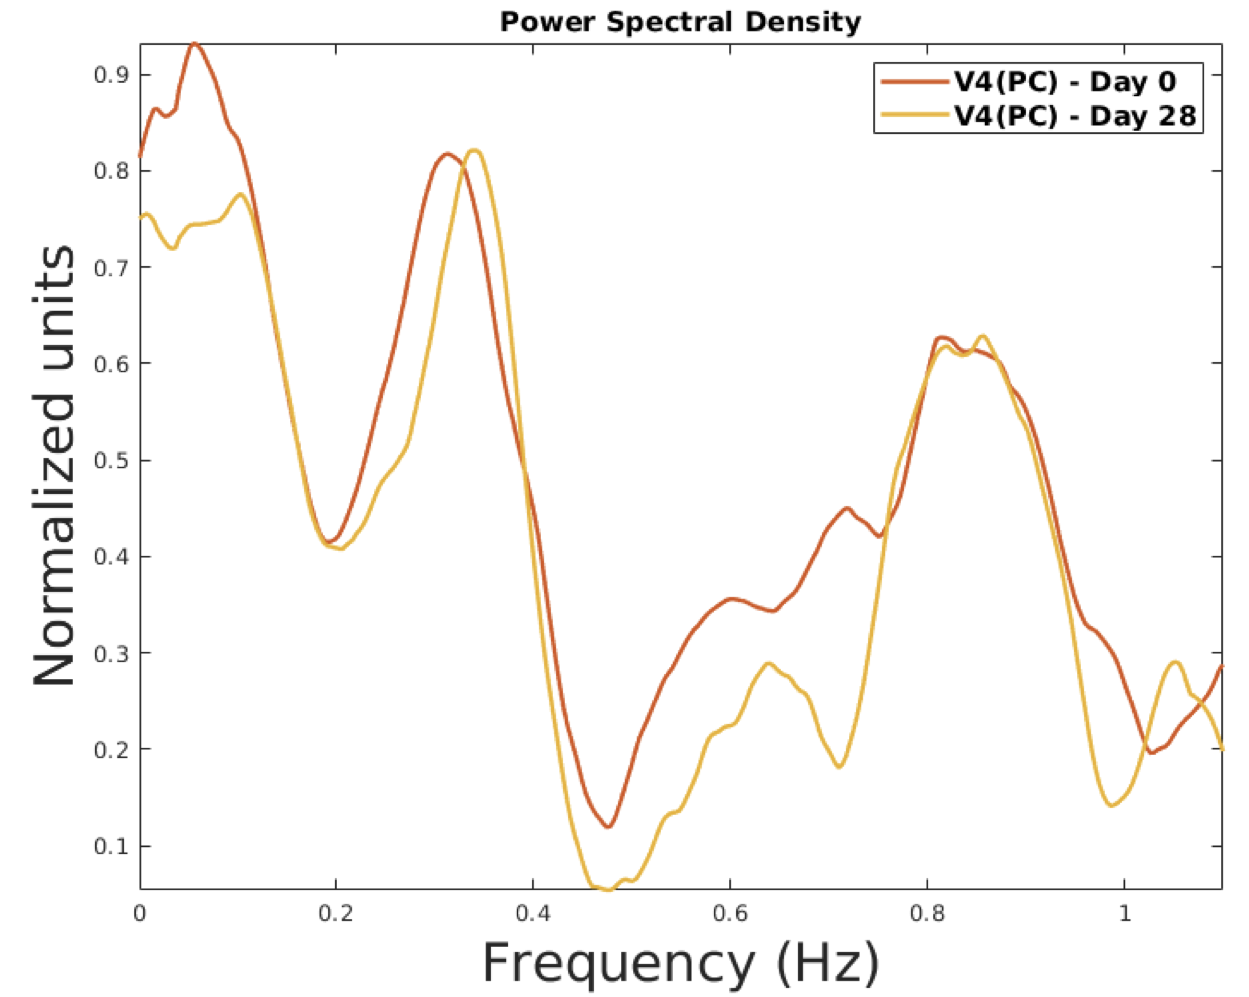
- The peaks appear at the same frequencies and with relatively similar amplitudes regarding the PSD of an individual at 28 days interval (Figure 3).
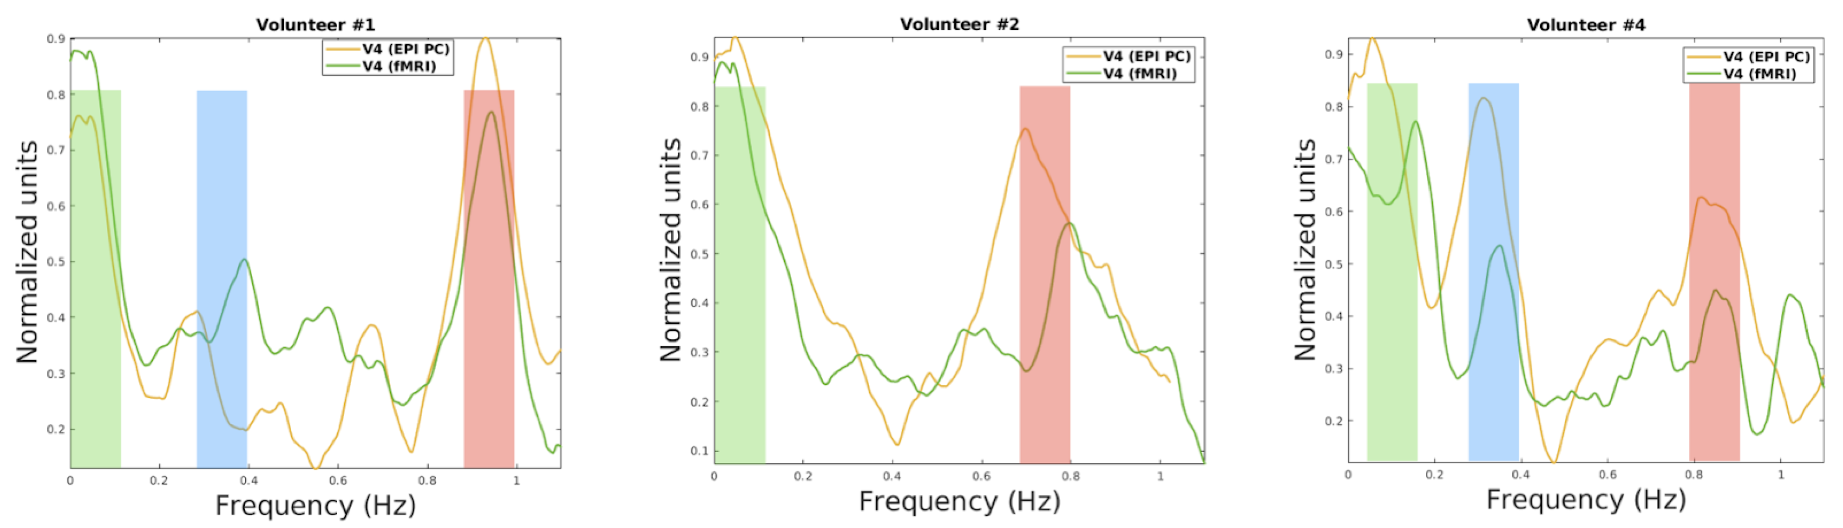
- For some subjects, the spectra are consistent between fMRI and PC-EPI sequences (Figure 4).
Discussion
To our knowledge, EPI-PC is the only method that simultaneously quantifies the velocity of the CSF and its direction of flow with a sufficient temporal resolution. In the same way that the intensity of voxels in V4, sensitive to inflow effect, has been correlated with brain activity, we believe that the velocity amplitude as well as the pulsatile behavior of the CSF can be correlated with the efficiency of the glymphatic system. These initial results are encouraging for the relevance of EPI-PC in its measurement of CSF flow as well as for its reproducibility. However, more volunteer examinations are needed to confirm this and more experiments are currently underway.Conclusion
The identification of early biomarkers of age-related neurodegenerative pathologies such as Alzheimer's disease would make it possible to predict and anticipate the cognitive decline of patients. The EPI-PC sequence allows to quantify the low-frequency components of CSF flow in V4, and the evolution over the years of the amplitude of these components in an individual could be an indicator of the efficiency of his glymphatic system as he ages. We will use this measure of CSF flow by EPI-PC in a longitudinal study in which we will follow 100 healthy elderly individuals for 10 years to assess the reliability and relevance of certain markers as predictors of cognitive status and changes in that status over time.Acknowledgements
Thanks to David Chechin from Philips for his advice and scientific support.References
1. C. May, J. Kaye, J. Atack, M. Schapiro, R. Friedland, and S. I. Rapoport. Cerebrospinal fluid production is reduced in healthy aging. Neurology, 40(3) :500–500, March 1990.
2. E. Rubenstein. Relationship of senescence of cerebrospinal fluid circulatory system to dementias of the aged. The Lancet, 351(9098) :283–285, January 1998.
3. G. Silverberg, M. Mayo, T. Saul, E. Rubenstein, and D. McGuire. Alzheimer’s disease, normal-pressure hydrocephalus, and senescent changes in CSF circulatory physiology : a hypothesis. The Lancet Neurology, 2(8) :506–511, August 2003.
4. S. Stoquart-El Sankari, O. Balédent, C. Gondry-Jouet, M. Makki, O. Godefroy, and M-E. Meyer. Aging effects on cerebral blood and cerebrospinal fluid flows. Journal of Cerebral Blood Flow and Metabolism, 27(9) :1563–1572, September 2007.
5. D. Fleischman, J. Berdahl, J. Zaydlarova, S. Stinnett, M. Fautsch, and R. Allingham. Cerebrospinal fluid pressure decreases with older age. PLoS ONE, 7(12) :e52664, December 2012.
6. J. Attier-Zmudka, J-M. Sérot, J. Valluy, M. Saffarini, A-S. Macaret, M. Diouf, S. Dao, Y. Douadi, K. Malinowski, and O. Balédent. Decreased cerebrospinal fluid flow is associated with cognitive deficit in elderly patients. Frontiers in Aging Neuroscience, 11 :87, April 2019.
7. F. Onen, M. C. Henry Feugeas, G. De Marco, G. Baron, P. Ravaud, S. Legrain, J. L. Moretti, E. Schouman Claeys, and I. Idy Peretti. Cerebrospinal fluid MR dynamics and risk of falls in the elderly. Journal of Neuroradiology, 32(1) :3–9, January 2005.
8. M. de Mélo Silva Júnior, P. Diniz, M. de Souza Vilanova, G. Basto, and M. Valença. Brain ventricles, csf and cognition : a narrative review. Psychogeriatrics, 22(4) :544–552, July 2022.
9. M. de Leon, Y. Li, N. Okamura, W. Tsui, L. Saint-Louis, L. Glodzik, R. Osorio, J. Fortea, T. Butler, E. Pirraglia, S. Fossati, H. Kim, R. Carare, M. Nedergaard, H. Benveniste, and H. Rusinek. Cerebrospinal fluid clearance in Alzheimer disease measured with dynamic PET. Journal of Nuclear Medicine, 58(9) :1471–1476, September 2017.
10. J.J. Iliff, M. Wang, Y. Liao, B. Plogg, W. Peng, G. Gundersen, H. Benveniste, G.E. Vates, R. Deane, S. Goldman, E. Nagelhus, and M. Nedergaard. A Paravascular Pathway Facilitates CSF Flow Through the Brain Parenchyma and the Clearance of Interstitial Solutes, Including Beta Amyloid. Science translational medicine, 4(147), August 2012.
11. N. Fultz, G. Bonmassar, K. Setsompop, R. Stickgold, B. Rosen, J. Polimeni, and L. Lewis. Coupled electrophysiological, hemodynamic, and cerebrospinal fluid oscillations in human sleep. Science, 366(6465) :628–631, November 2019.
12. S. Yang, B. Inglis, T. Talavage, V. Nair, F. Yao, B. Fitzgerald, A. Schwichtenberg, and Y. Tong. Coupling between cerebrovascular oscillations and CSF flow fluctuations during wakefulness : An fMRI study. Journal of Cerebral Blood Flow and Metabolism, 42(6) :1091–1103, June 2022.
Figures