3008
Exploring microstructural changes in patients with vascular cognitive impairment using multi-b-value diffusion and T2-relaxometry MRI1Department of Radiology & Nuclear Medicine, School for Mental Health and Neuroscience, Maastricht University Medical Center, Maastricht, Netherlands, 2Department of Neurology, CARIM School for Cardiovascular Diseases, Maastricht University Medical Center, Maastricht, Netherlands
Synopsis
Keywords: Neurofluids, Relaxometry, Interstitial fluid
Local increases of interstitial fluid (ISF) predates axonal damage in white matter hyperintensities (WMH). However, it is challenging to disentangle these processes on T2w-MRI. By using multi-b-value diffusion and multi-echo T2-relaxometry imaging, we aimed to quantify markers of ISF volume and mobility in patients with vascular cognitive impairment (VCI) and healthy controls (HC). A trend for a higher mobility and volume of ISF was found in VCI patients compared to HC. Moreover, in VCI, elevated mobility of ISF was already present in perilesional tissue compared to normal-appearing white matter, suggesting that it might be an early marker of WMH development.Introduction
Cerebral small vessel disease (cSVD) is the most common cause of vascular cognitive impairment (VCI) [1]. White matter hyperintensities are one of the hallmark MRI findings in VCI, and although WMHs are frequent age-related findings, a high WMH volume is related to cognitive decline [2]. Microstructural changes, such as a reduced fractional anisotropy and an increased mean diffusivity have been reported previously in WMH compared to normal-appearing white matter (NAWM) [3]. Increases in local interstitial fluid (ISF) have been suggested to predate axonal damage and cell loss in WMH [4]. However, both processes appear bright on T2-weighted imaging, making it challenging to disentangle these processes. Here, we aim to gain more insight into the microstructural changes of the NAWM and WMHs using multi-b-value diffusion and multi-echo T2-relaxometry imaging in patients with VCI and controls. By utilizing spectral decomposition of the diffusion and T2-relaxation data, we can assess markers that are indicative of the mobility and volume of interstitial fluid (ISF) [5].Methods
Study populationFourteen patients with VCI (8 males, age range 60-82) and nine healthy controls (HC) (3 males, age range 61-79) were included. VCI patients had objective cognitive decline (either Montreal Cognitive Assessment (MoCA)<26 or cognitive impairment in at least one cognitive domain in neuropsychological assessment), as well as imaging evidence of cSVD (WMH Fazekas≥2 or Fazekas 1 and lacunar infarcts/microbleeds).
MRI acquisition
All subjects underwent 3T-MRI (Philips, Ingenia) using a 32-element phased-array coil. For anatomical reference and brain tissue segmentation, 3D T1-weighted images and T2-FLAIR images were acquired. Next, a multi-b-value diffusion-weighted scan (57 transverse 2.4-mm thick slices; pixel size = 2.4x2.4mm; TR/TI/TE=6800/2230/86ms, 3 orthogonal gradient directions with b-values 0,10,20,30,40,50,60,100,200,300,400,500,600,800 and 1000s/mm2) was acquired. Furthermore, a multi-echo GRASE scan (25 slices transverse 4mm slices; 1mm slice gap; pixel size 1.5x1.5mm; TR=3000ms; 32 echoes with 10ms echo spacing, range 10-320ms) was acquired. Additionally, b=0s/mm2 images were acquired with a reversed phase encoding to correct for EPI distortions.
Analysis
Multi-exponential spectral decomposition was performed using a regularized version of the non-negative least squares (rNNLS) [6]. The multi-b-value diffusion images were first corrected for EPI distortions. Subsequently, to solve the rNNLS a basis set of 120 logarithmically spaced basis functions was used with diffusivity values ranging from 0.1*10-3 to 200*10-3 mm/s. Next, the intermediate diffusion component (1.5<Dint<4.0*10-3 mm2/s) was extracted from the resulting spectrum, and the amplitude fraction of this component (fint) was extracted and corrected for T1/T2-relaxation effects [5]. The resulting fint maps were averaged over the three gradient directions.
For the multi-echo GRASE data, to solve the rNNLS, a basis set of 120 logarithmically spaced relaxation functions (T2 range 10 to 3000 ms) was used. The extended phase graph (EPG) algorithm along with the Fourier transform of the slice-selective excitation pulse were used to account for possible stimulated echoes caused by B1 inhomogeneities, and imperfect slice profiles due to slice-selective excitation [6]. A free-water fraction (FWF) was calculated as the ratio of long-T2 components (400-3000ms) to all T2 components (400-3000ms) [7].
NAWM and WMH were automatically segmented from the T2-FLAIR and T1-weighted images using samseg, followed by manual corrections [8].
Statistics
Prior to the statistical analysis, the positive-skewed FWF was first square-root transformed and the negative-skewed fint was square-transformed. To study the relation between FWF and fint values in the NAWM, we performed a Pearson’s correlation. Furthermore, potential group differences between VCI and controls in the fint and the FWF of the NAWM were assessed using linear regression models, with age and sex as covariates. Last, using paired t-tests, potential changes in FWF and fint values in WMH, perilesional NAWM and distant NAWM were assessed. Due to a low WMH volume in some of the HC, this final analysis was only performed in VCI patients.
Results
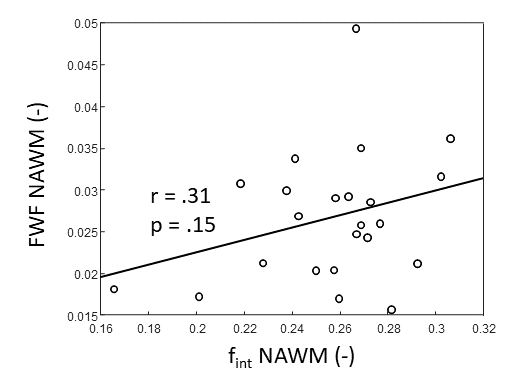
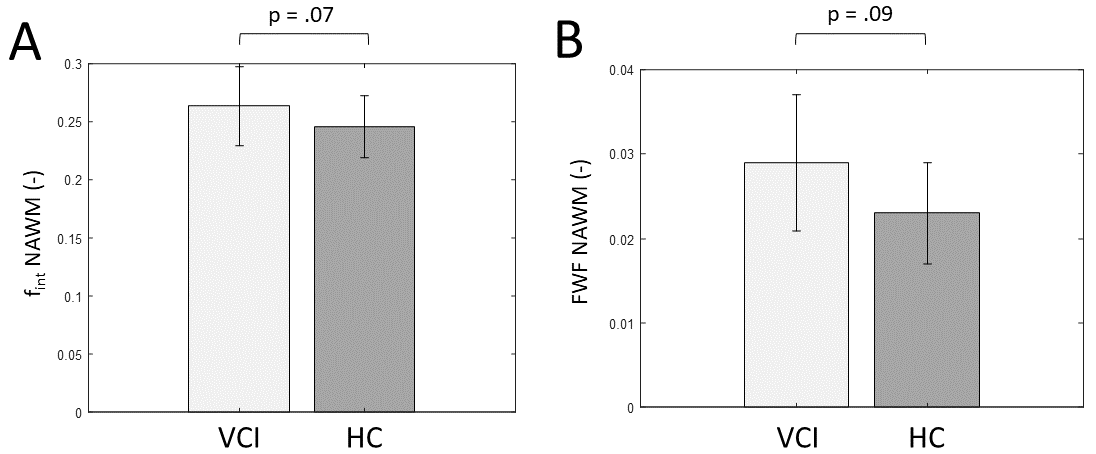
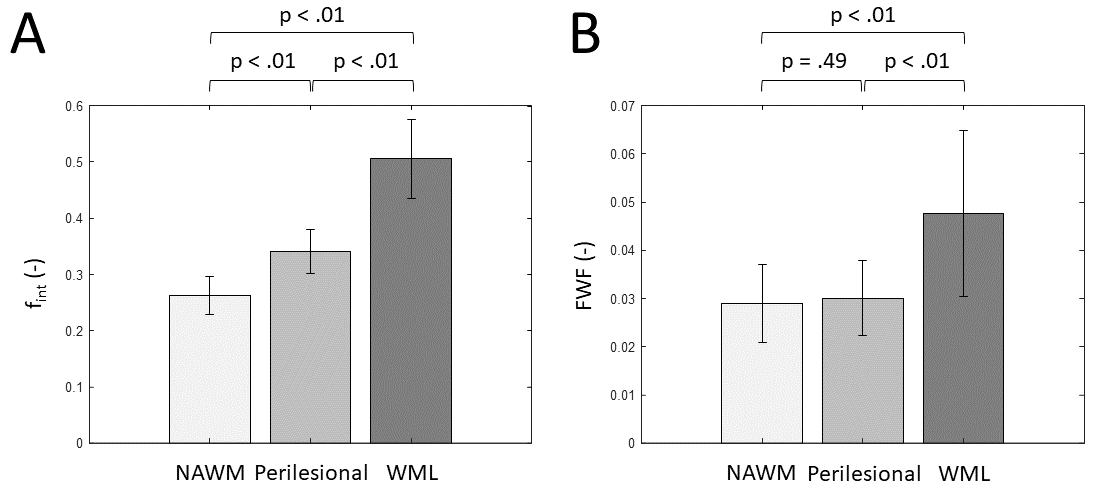
FWF and fint values show a positive, although not significant relation (Figure 1). A trend towards significance was found of a higher NAWM-averaged fint in patients with VCI compared to controls (p=.07, Figure 2A). Similarly, we found a trend of higher NAWM-averaged FWF in VCI patients compared to controls (p=.09, Figure 2B). Moreover, the fint of perilesional NAWM is significantly increased compared to NAWM (p<.01, Figure 3A), while the FWF was not signficantly higher in perilesional NAWM compared NAWM (p=.49, Figure 3B). Both markers were elevated in the WML tissue, compared to NAWM and perilesional NAWM (p<.01, Figure 3).Discussion & Conclusion
In this study we explored microstructural changes in VCI, using two MRI markers that are indicative of ISF. While both markers are thought to relate to ISF, the FWF is a marker that is based on ISF volume, while fint relates to the mobility of ISF. A limitation of this study is the small sample size, and thus low statistical power. However, nonetheless, our results are indicative of higher ISF volume and mobility in the NAWM of VCI patients compared to HC. This increase might be an early marker for WMH development and corresponding cognitive decline. Moreover, especially the ISF mobility (i.e. fint) seems to be an early marker for WMHs, as it is already elevated in perilesional tissue. Therefore, these quantitative ISF-markers have the potential to visualize and monitor WMH development in VCI.Acknowledgements
This work has received funding from the European Union’s Horizon 2020 research and innovation programme ‘CRUCIAL’ under grant number 848109.References
[1] Østergaard L, Engedal TS, Moreton F, et al. Cerebral small vessel disease: Capillary pathways to stroke and cognitive decline. J. Cereb. Blood Flow Metab. 2016;36:302–325 doi: 10.1177/0271678X15606723.
[2] Kloppenborg RP, Nederkoorn PJ, Geerlings MI, van den Berg E. Presence and progression of white matter hyperintensities and cognition. Neurology 2014;82:2127 LP – 2138 doi: 10.1212/WNL.0000000000000505.
[3] Svärd D, Nilsson M, Lampinen B, et al. The effect of white matter hyperintensities on statistical analysis of diffusion tensor imaging in cognitively healthy elderly and prodromal Alzheimer’s disease. PLoS One 2017;12:1–16 doi: 10.1371/journal.pone.0185239.
[4] Wardlaw JM, Valdés Hernández MC, Muñoz-Maniega S. What are white matter hyperintensities made of? Relevance to vascular cognitive impairment. J. Am. Heart Assoc. 2015;4:001140 doi: 10.1161/JAHA.114.001140.
[5] Wong SM, Backes WH, Drenthen GS, et al. Spectral Diffusion Analysis of Intravoxel Incoherent Motion MRI in Cerebral Small Vessel Disease. J. Magn. Reson. Imaging 2020;51:1170–1180 doi: 10.1002/jmri.26920.
[6] Drenthen GS, Backes WH, Aldenkamp AP, Jansen JFA. Applicability and reproducibility of 2D multi-slice GRASE myelin water fraction with varying acquisition acceleration. Neuroimage 2019;195:333–339 doi: 10.1016/j.neuroimage.2019.04.011.
[7] Oshio K, Yui M, Shimizu S, Yamada S. The spatial distribution of water components with similar t2 may provide insight into pathways for large molecule transportation in the brain. Magn. Reson. Med. Sci. 2021;20:34–39 doi: 10.2463/mrms.mp.2019-0138.
[8] Cerri S, Puonti O, Meier DS, et al. A contrast-adaptive method for simultaneous whole-brain and lesion segmentation in multiple sclerosis. Neuroimage 2021;225:117471 doi: 10.1016/j.neuroimage.2020.117471.
Figures