3007
The Application Value of DWI in Differentiating Mega Cisterna Magna from Cisterna Magna Arachnoid Cyst1Department of Radiology,, The First Affiliated Hospital of Shandong First Medical University, Jinan, China, 2GE Healthcare,, Beijing, China
Synopsis
Keywords: Neurofluids, Diffusion/other diffusion imaging techniques, Arachnoid Cyst;Mega Cisterna Magna
The differences between TAC, MCM and CMAC were measured respectively. For TAC and CMAC groups, both ADC and eADC value showed no statistical difference. There was a statistically significant difference in eADC between TAC and MCM, but no significant difference in ADC.
Introduction
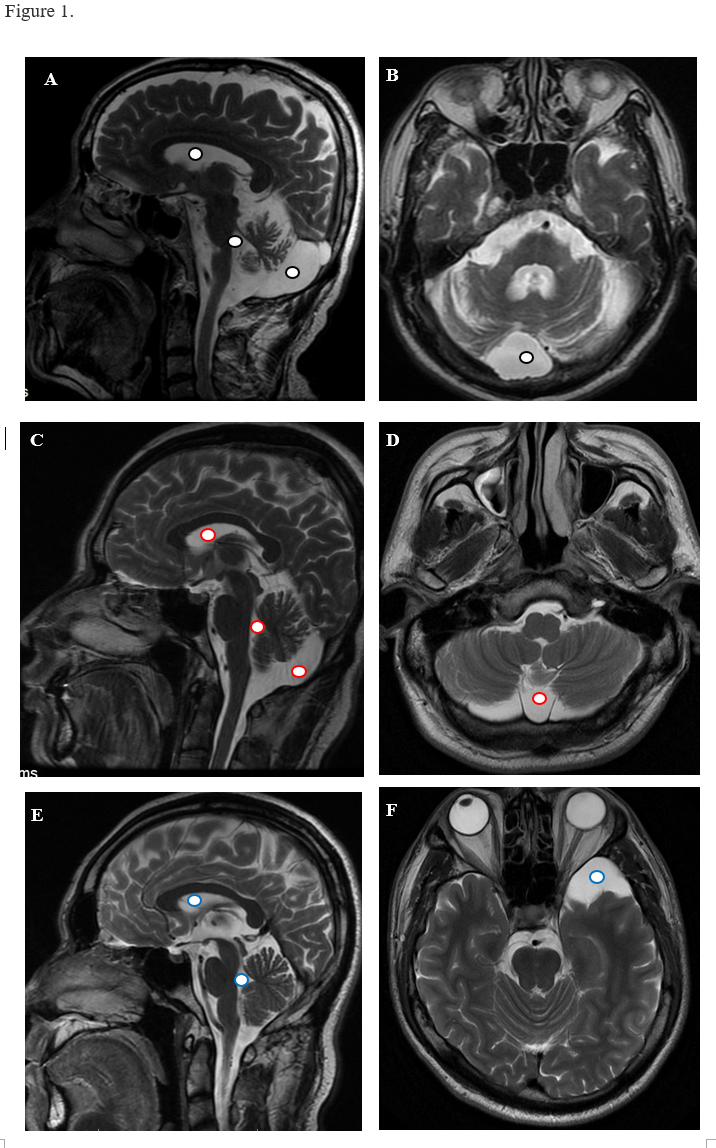
MCM is a congenital malformation, diagnosed when the distance between the cerebellar cortex and inner occipital plate exceeds 10mm1. CMAC refers to the arachnoid cyst located in the cistern magnum2. Both lesions can lead to certain clinical symptoms, but they are usually followed with completely different treatments. Typical lesions can be differentiated by traditional MRI. For some atypical lesions, it is difficult to distinguish between MCM and CMAC on MRI images, because both are fluid signals with long T1 and T2. It is worth investigating the differences in the nature and state of movement of water molecules between the two lesions3.Diffusion-weighted imaging (DWI) reflects the diffusion state of water molecules in living tissue cells, which plays an indispensable role in staging cerebral ischemic infarction in the central nervous system4. EADC and ADC are parameters derived from DWI. Some studies have shown that the ADC map not only demonstrates the diffused limitation of water molecules, but also shows the internal structure of the lesion5. EADC has been used to diagnose abdominal and prostate cancer, which could remove T2 shine-through effects from DWI6. The current application of eADC is far less than that of ADC. To our knowledge, there have been no relevant reports in this field exploring whether high b-value ADC and eADC can be used for differential diagnosis of the two lesions, as well as the relationship between the lesions and cerebrospinal fluid.
Material and Method
DWI was performed on a 3.0 T clinical scanner (Discovery 750w, GE Healthcare, USA) equipped with a 32-channel head coil, with b-values of 50, and 1000 s/mm2. Sequence parameters were: TE/TR, 65/3000; acquisition matrix, 256*256; field of view, 240mm; flip angle, 90; slice thickness, 5 mm. The scanning time is about 24 second.Thirty-six patients with MCM, 30 patients with CMAC and 28 patients with temporal pole arachnoid cyst (TAC) were carefully included in the experiment. TAC served as the reference due to its similarity in nature with CMAC.
The ADC and eADC values were measured on the workstation (ADW4.2).
The ADC and eADC values of cerebrospinal fluid of the lateral and fourth ventricles in the MCM, CMAC and TAC groups were measured respectively by three experienced radiologists to exclude the individual differences. The ADC and eADC values in MCM and intraventricular cerebrospinal fluid (CSF) were measured and compared, along with the difference between CMAC and its CSF. The ADC and eADC values of TAC was measured as the reference standard, to compare with MCM and CMAC, respectively.
Results
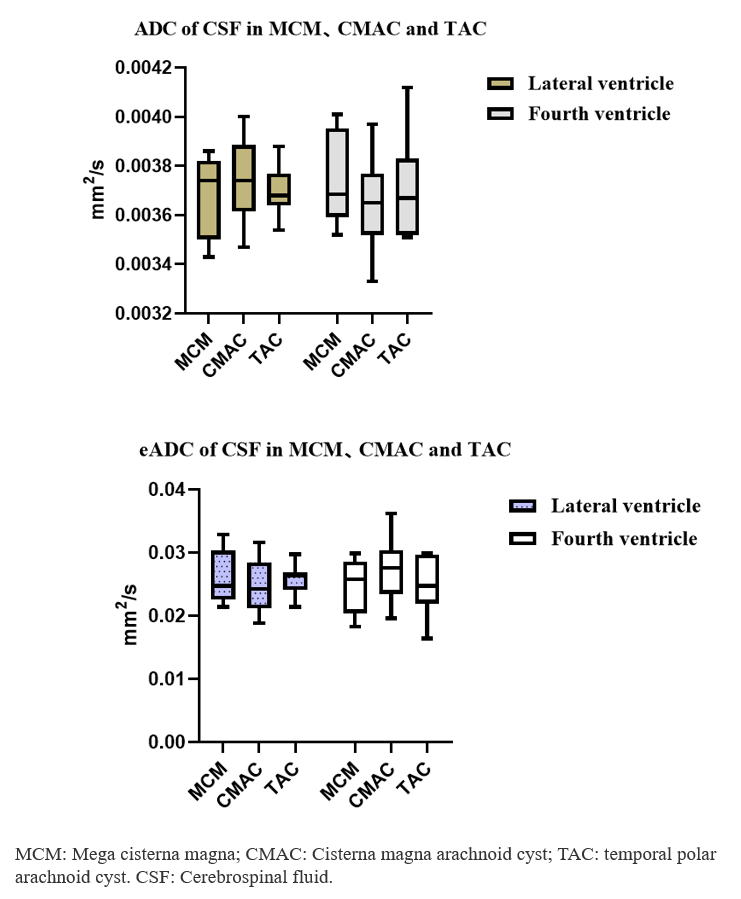
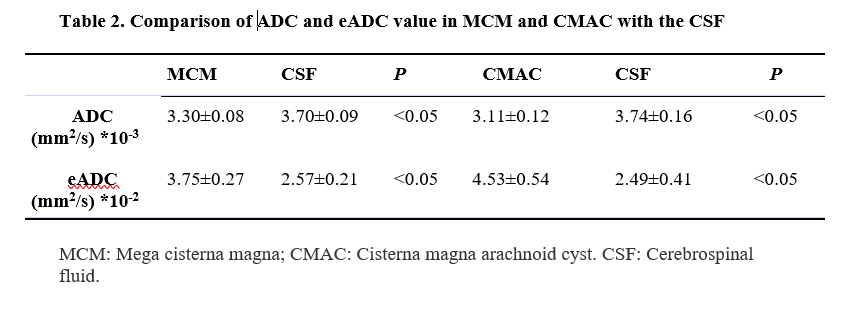
Using ICC analysis, the ADC and eADC values in CSF or lesions all showed high reproducibility (0.709<ICC<0.915) between three experts. The ADC and eADC values of lateral and fourth ventricles CSF were measured, with no significant difference among the MCM, CMAC and TAC groups (P > 0.05). (Figure 2).The ADC values of MCM and CMAC were lower than that of their CSFs, while the eADC values were higher, and the differences were statistically significant (P <0.01) (Table 1).
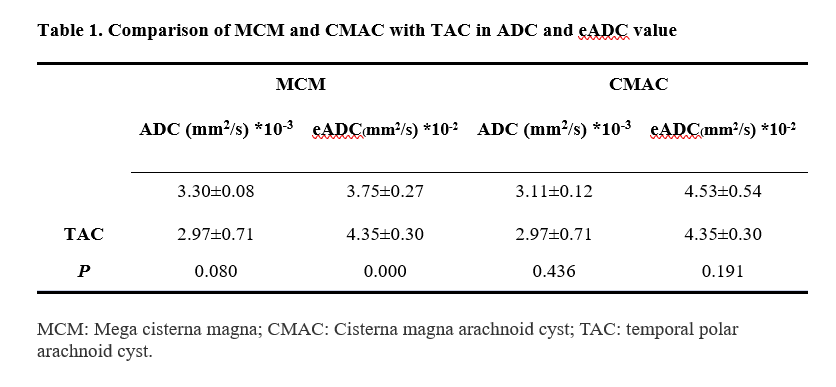
The differences between TAC, MCM and CMAC were measured respectively (Table 2). For TAC and CMAC groups, both ADC and eADC value showed no statistical difference. There was a statistically significant difference in eADC between TAC and MCM (P<0.01), but no significant difference in ADC (P=0.08).
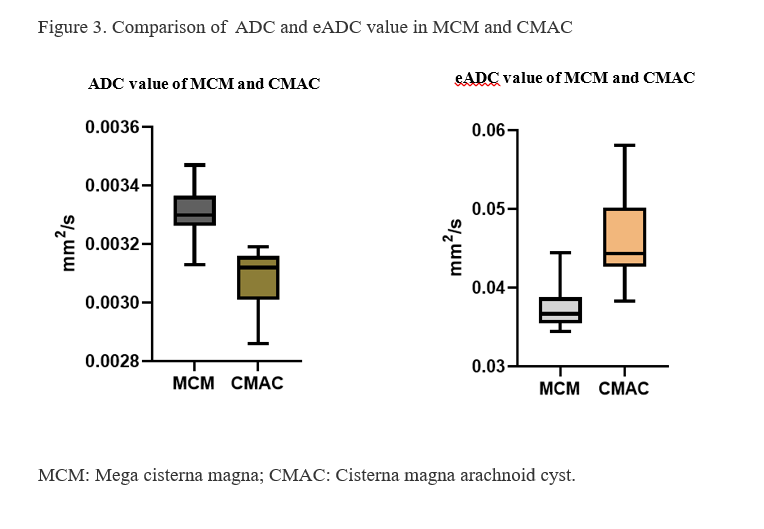
Comparing the difference of ADC/eADC between MCM and CMAC, we found the ADC value of MCM was higher than that of CMAC, while eADC was the opposite, and the difference was statistically significant (P>0.05) (Figure 3).
Discussion
In this study, the difference of eADC value between the TAC and MCM groups was statistically significant, but not for ADC. After comparing the ADC and eADC values between MCM and CMAC, we found statistically significant differences for both. This shows eADC is superior in reflecting minor diffusivity differences, which is a crucial result not reported in previous studies and requires further verification.Another important finding of this study is the ADC value of MCM was lower than that of CSF, and the eADC value was higher, which reflected that the CSFs in MCM and CMAC were in different circulation states. It is speculated that the flow velocity of the water molecule of MCM is slower than that of normal CSF, and may be accompanied with small molecule substance stasis, leading to its limited diffusion. The fluid in CMAC is in a relatively unidirectional flow state due to the valve action, causing its internal water molecule to be more restricted. Our research also showed that compared with MCM, the ADC value of CMAC was lower and the eADC value was higher, indicating a more limited diffusion of water molecules in CMAC.
Conclusion
In conclusion, this study demonstrates the motion state of water molecules in MCM is different from that in CMAC. DWI-derived parameters, ADC and eADC, can play a supplementary role in the diagnosis of CMC and CMAC, especially for atypical lesions unable to be identified by conventional imaging.Acknowledgements
References
1. Michal Gafner, Itai Yagel, Shalev Fried, etal. Fetal brain biometry in isolated mega cisterna magna: MRI and US study, The Journal of Maternal-Fetal & Neonatal Medicine, DOI: 10.1080/14767058.2020.1849094.
2. Shekdar K. Posterior fossa malformations. Semin Ultrasound CT MR. 2011;32(3):228-241. doi:10.1053/ j.sult. 2011.02.003.
3. Galarza M, López-Guerrero AL, Martínez-Lage JF. Posterior fossa arachnoid cysts and cerebellar tonsillar descent: short review. Neurosurg Rev. 2010;33(3):305-314. doi:10.1007/s10143-010-0262-9.
4. Saito M, Ishizuka K, Hoshino T, Toi S, etal. Leptomeningeal anastomosis and early ischemic lesions on diffusion-weighted imaging in male murine focal cerebral ischemia. J Neurosci Res. 2019;97(7):752-759. doi:10.1002/jnr.24403.
5. Tamrazi B, Pekmezci M, Aboian M, Tihan T, Glastonbury CM. Apparent diffusion coefficient and pituitary macroadenomas: pre-operative assessment of tumor atypia. Pituitary. 2017;20(2):195-200. doi:10.1007/s11102-016-0759-5.
6. Park SY, Kim CK, Park JJ, Park BK. Exponential apparent diffusion coefficient in evaluating prostate cancer at 3 T: preliminary experience. Br J Radiol. 2016;89(1058):20150470. doi:10.1259/bjr.20150470.
Figures