3005
Impaired permeability in the choroid plexus in a tauopathy mouse model – a pilot study
Yuhan Bian1,2,3, Ning Wang4, Di Cao1,2,3, Yuanqi Sun1,2,3, Chunming Gu1,2,3, Yinghao Li1,2,3, Jiangyang Zhang5, Peter C.M. Van Zijl1,2, Xiaobo Mao4, and Jun Hua1,2
1F.M. Kirby Research Center for Functional Brain Imaging, Kennedy Krieger Institute, Baltimore, MD, United States, 2Neurosection, Division of MRI Research, Department of Radiology, Johns Hopkins, Baltimore, MD, United States, 3Department of Biomedical Engineering, Johns Hopkins, Baltimore, MD, United States, 4Department of Neurology, Johns Hopkins, Baltimore, MD, United States, 5Center for Biomedical Imaging, NYU Grossman School of Medicine, New York, NY, United States
1F.M. Kirby Research Center for Functional Brain Imaging, Kennedy Krieger Institute, Baltimore, MD, United States, 2Neurosection, Division of MRI Research, Department of Radiology, Johns Hopkins, Baltimore, MD, United States, 3Department of Biomedical Engineering, Johns Hopkins, Baltimore, MD, United States, 4Department of Neurology, Johns Hopkins, Baltimore, MD, United States, 5Center for Biomedical Imaging, NYU Grossman School of Medicine, New York, NY, United States
Synopsis
Keywords: Neurofluids, Alzheimer's Disease
The choroid plexus (CP) is a gateway for the exchange of various metabolites between the microvasculature and brain. Impairment of CP has been reported in various diseases. Recently, dynamic-susceptibility-contrast-in-the-CSF (cDSC) MRI was developed to measure Gd-induced signal changes in the CSF. Here, cDSC MRI was performed with Intraperitoneal Gd-injection in a tauopathy mouse model to examine CP permeability. The maximal Gd-induced signal change was greater in the ventricles in tau mice than WT mice, indicating an increase of Gd leakage from the microvasculature into the ventricles through the CP.INTRODUCTION
The choroid plexus (CP) and the blood-CSF barrier (BCSFB) formed by the choroid plexus epithelial cells (CPECs) is a gateway for the exchange of various metabolites and proteins between the microvasculature and the central nervous system (CNS). Impairment of the CP has been reported in various brain diseases. The permeability of CP can be measured with many methods. Recently, the dynamic susceptibility contrast in the CSF (cDSC) MRI method has been developed to measure Gadolinium-based contrast agent (GBCA) induced signal changes in the CSF(1). In this study, cDSC MRI was performed with an Intraperitoneally (IP) administered macrocyclic GBCA in a tauopathy mouse model to examine the permeability of CP. As cDSC MRI was originally developed on human MRI systems, the results from this study are expected to have direct translational values for human studies.METHODS
Animals: We scanned 5 male wild type (WT), and 3 male tau mice all at 8 months of age in this pilot study. MRI: In vivo studies were performed on a horizontal bore 11.7-T Bruker Biospec system (Bruker, Ettlingen, Germany) equipped with a physiological monitoring system. A 72-mm quadrature volume resonator was used as a transmitter, and a 4-element (2 × 2) phased array coil was used as a receiver. cDSC MRI were acquired before and after I.P. administration of Gadodiamide [Gd] (Omniscan, 10 mmol/kg) using a T2-weighted fast spin echo sequence: TR/TE = 3000/30 ms, voxel = 0.2×0.2×0.5 mm3, 3 shots. The total imaging time was about 30 min/mouse. Anesthesia was induced with 2% isoflurane in medical air, followed by 1% isoflurane in oxygen and air (1:3 ratio) for maintenance during the MRI scan, applied via a vaporizer and a facial mask. During the MRI scans, the mouse head was positioned using a bite bar and 2 ear pins, and the animal was placed on a water-heated bed equipped with temperature and respiratory controls. Respiration rate and body temperature were monitored constantly by an animal monitoring system (SAII, Stony Brook, NY, USA) during MRI. Animals were ventilated to maintain stable physiological conditions (respiratory rate 50–55 breaths/min). Analysis: The statistical parametric mapping (SPM) software package (Version 8, Wellcome Trust Centre for Neuroimaging, London, UK; http://www.fil.ion.ucl.ac.uk/spm/), ITK-SNAP (Version 4.0.0; www.itksnap.org), Advanced Normalization Tools (ANTs; http://stnava.github.io/ANTs/), and other in-house codes programmed in Matlab (MathWorks, Natick, MA, USA) were used for image analysis. The cDSC images are preprocessed using ANTs for motion correction and SPM for slice timing correction. Four regions-of-interest (ROI) including the lateral ventricle, third ventricle, fourth ventricle and cerebral aqueduct were manually segmented on cDSC images for each mouse using ITK-SNAP (Figure 1a). Relative signal changes (∆S/S) and time to plateau (TTP) were calculated from the measured time courses. Statistics: Due to the small sample size in this pilot study, effect size estimated with Cohen’s d and relative group difference were used for group comparison.RESULTS & DISCUSSION
Typical cDSC MRI images before and after Gd injection are shown in Figure 1b. Gd-induced signal enhancement was observed in the ventricle in all mice. Figure 2 shows typical time courses from the ventricles measured from the cDSC images. Signal enhancement after Gd injection was detected in all time course. Some time courses showed a small undershoot shortly after Gd injection, which may be explained by the bolus effect from IP Gd as MR signals can decrease rather than increase when Gd concentration rises above certain threshold. Table 1 summarizes key parameters extracted from the time courses. Due to the small sample size in this pilot study, we focused on the effect sizes rather than P values. The maximal signal change after Gd injection showed a positive effect size in all four ROIs in tau mice compared to WT mice, indicating an increase of Gd leakage from the microvasculature into the ventricle through the BCSFB in the CP. Across the four ROIs, the lateral ventricle showed the lowest signal changes, possibly due to its larger size than the other three ROIs. The times to plateau (TTP) were longer in tau mice than WT mice in all four ROIs. Two plausible indications could be speculated: 1) it may take longer to reach a higher maximum signal change in tau mice; 2) cerebral blood flow (CBF) is usually slower in AD, which would lead to a slower input of Gd from IP through the BCSFB in the CP. Across the four ROIs, TTP in the cerebral aqueduct was the longest, which can be expected as IP Gd should reach the ventricles first through the CP before arriving at the aqueduct.CONCLUSION
Using a recently developed cDSC MRI approach, a larger signal changes after IP Gd injection was detected in the ventricles in tauopathy mice. Although the sample size is quite limited in this pilot study, the trend was clearly observed in all mice studied. Future studies should be conducted with a longer time window after Gd injection to examine the clearance of Gd from the ventricles in these mice as well.Acknowledgements
No acknowledgement found.References
(1)Gorle, N, et al. Brain Behav Immun 2018;69:35.
(2)Cao, D, et al. Magn Reson Med (accepted) 2020;
Figures
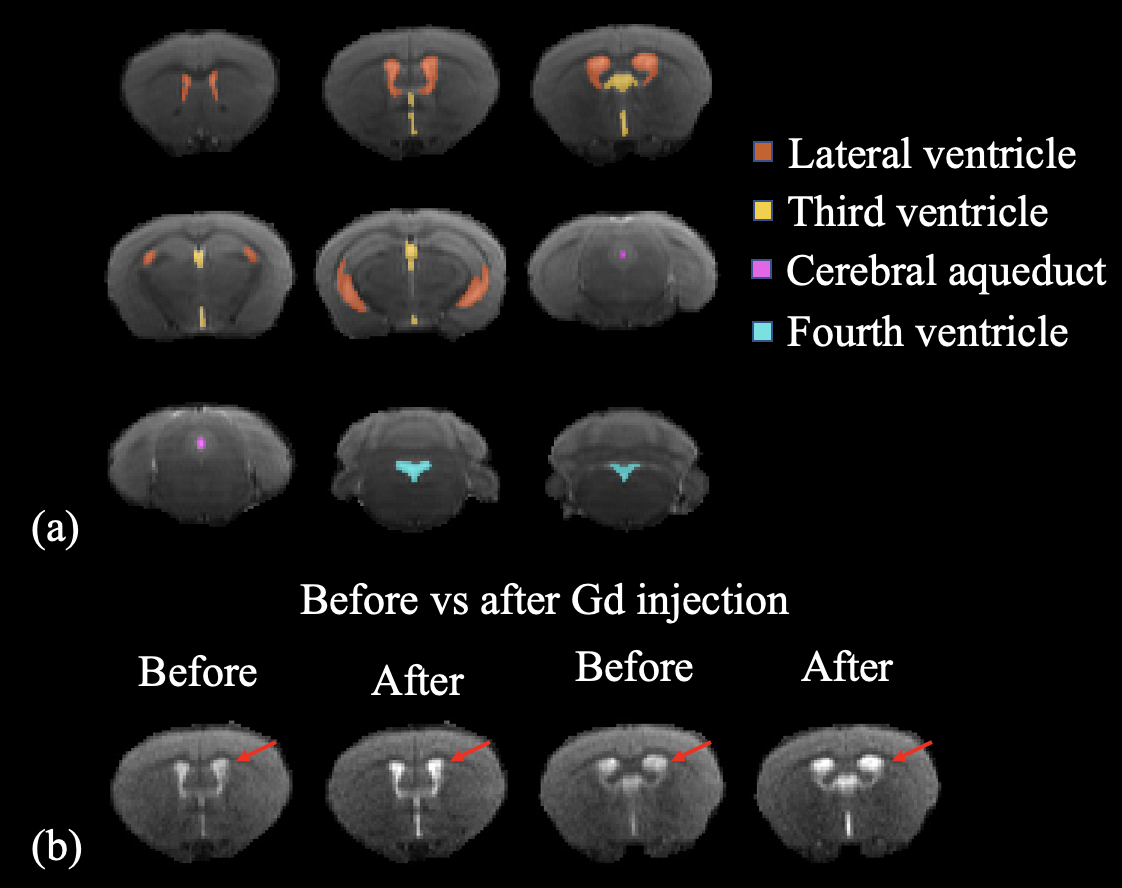
Figure 1: (a) Segmentation of the lateral, third and fourth ventricles and cerebral aqueduct on cDSC images. (b) Typical cDSC MRI images before and after Gd injection in a WT mouse (2 slice locations).
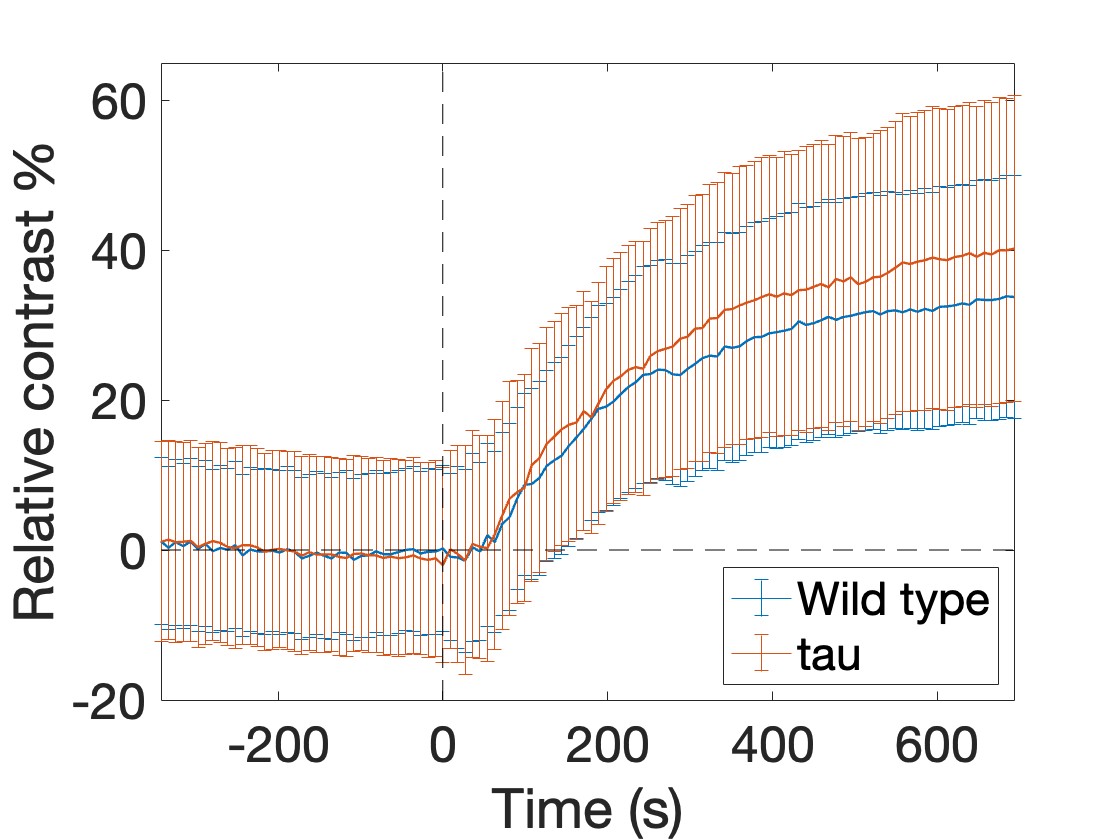
Figure 2: Typical time courses measured with cDSC MRI in the ventricles of WT and AD mice.
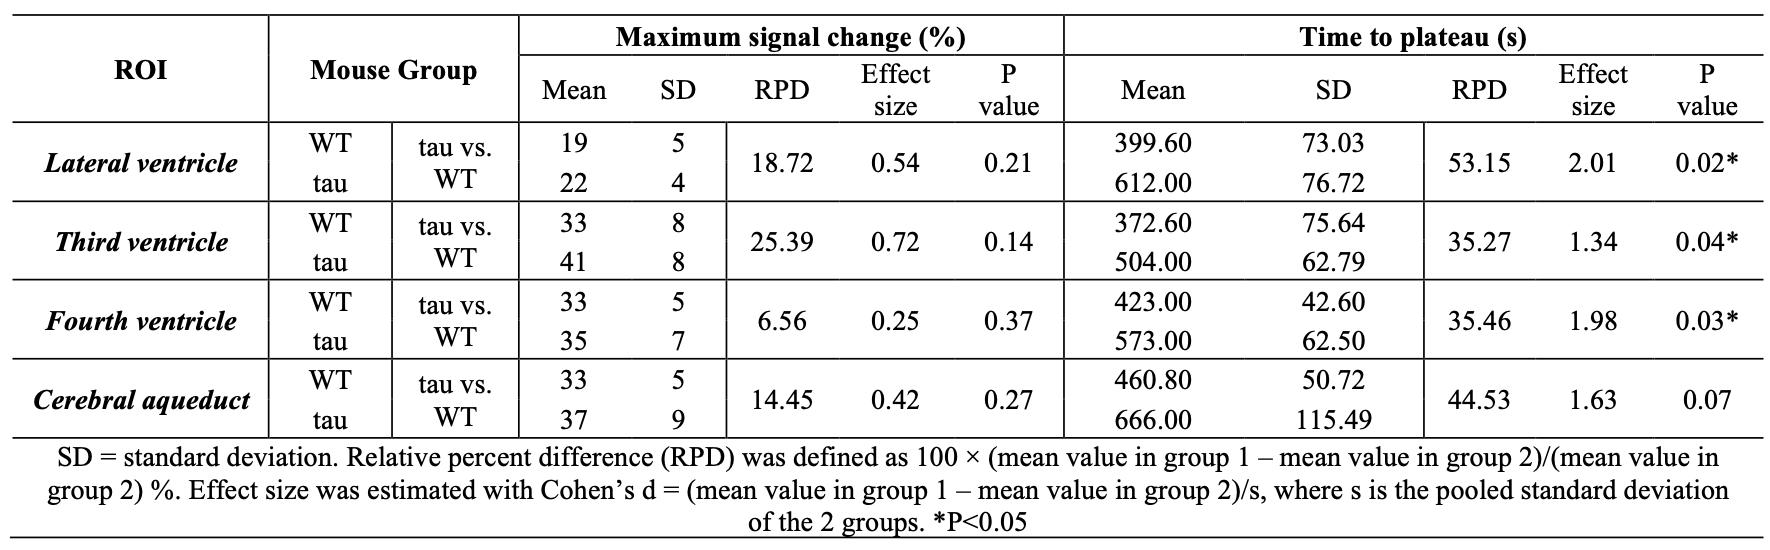
Table 1: Group comparison of key parameters extracted from the time courses.
DOI: https://doi.org/10.58530/2023/3005