3003
Low b-value DTI of CSF: Resolving Intravoxel Incoherent Motion into Ordered and Disordered Motions1FUJIFILM Healthcare Corporation, Tokyo, Japan, 2Department of Diagnostic Imaging, Hokkaido University Graduate School of Medicine, Sapporo, Japan
Synopsis
Keywords: Neurofluids, Diffusion/other diffusion imaging techniques
Low b-value DTI (Low-b DTI) has been recently proposed for investigating the CSF motion. Here, an analysis technique using the Low-b DTI was proposed for resolving intravoxel incoherent motion into ordered (linear) and disordered (random) motions of the CSF. A normal-subject study demonstrated that the proposed technique can differentiate characteristics of the complex CSF motion in typical ROIs. The proposed technique can be useful in investigating the dynamics of neurofluids.Introduction
Low b-value DTI (Low-b DTI) has been proposed for measuring the CSF motion recently [1-4]. A mathematical framework of the motion was proposed to understand what property of the motion is measured by Low-b DTI [3]. The framework expresses the motion as pseudorandom flow which is a combination of linear flow and molecular diffusion, and it shows that the covariance of the pseudorandom flow was measured by the Low-b DTI. Based on the framework, a novel analysis technique was preliminarily proposed to separate the pseudorandom flow into linear flow and random motion [4]. Here, the analysis technique is precisely defined and experimentally evaluated for resolving intravoxel incoherent motion into ordered (linear) and disordered (random) motions of the CSF.Methods
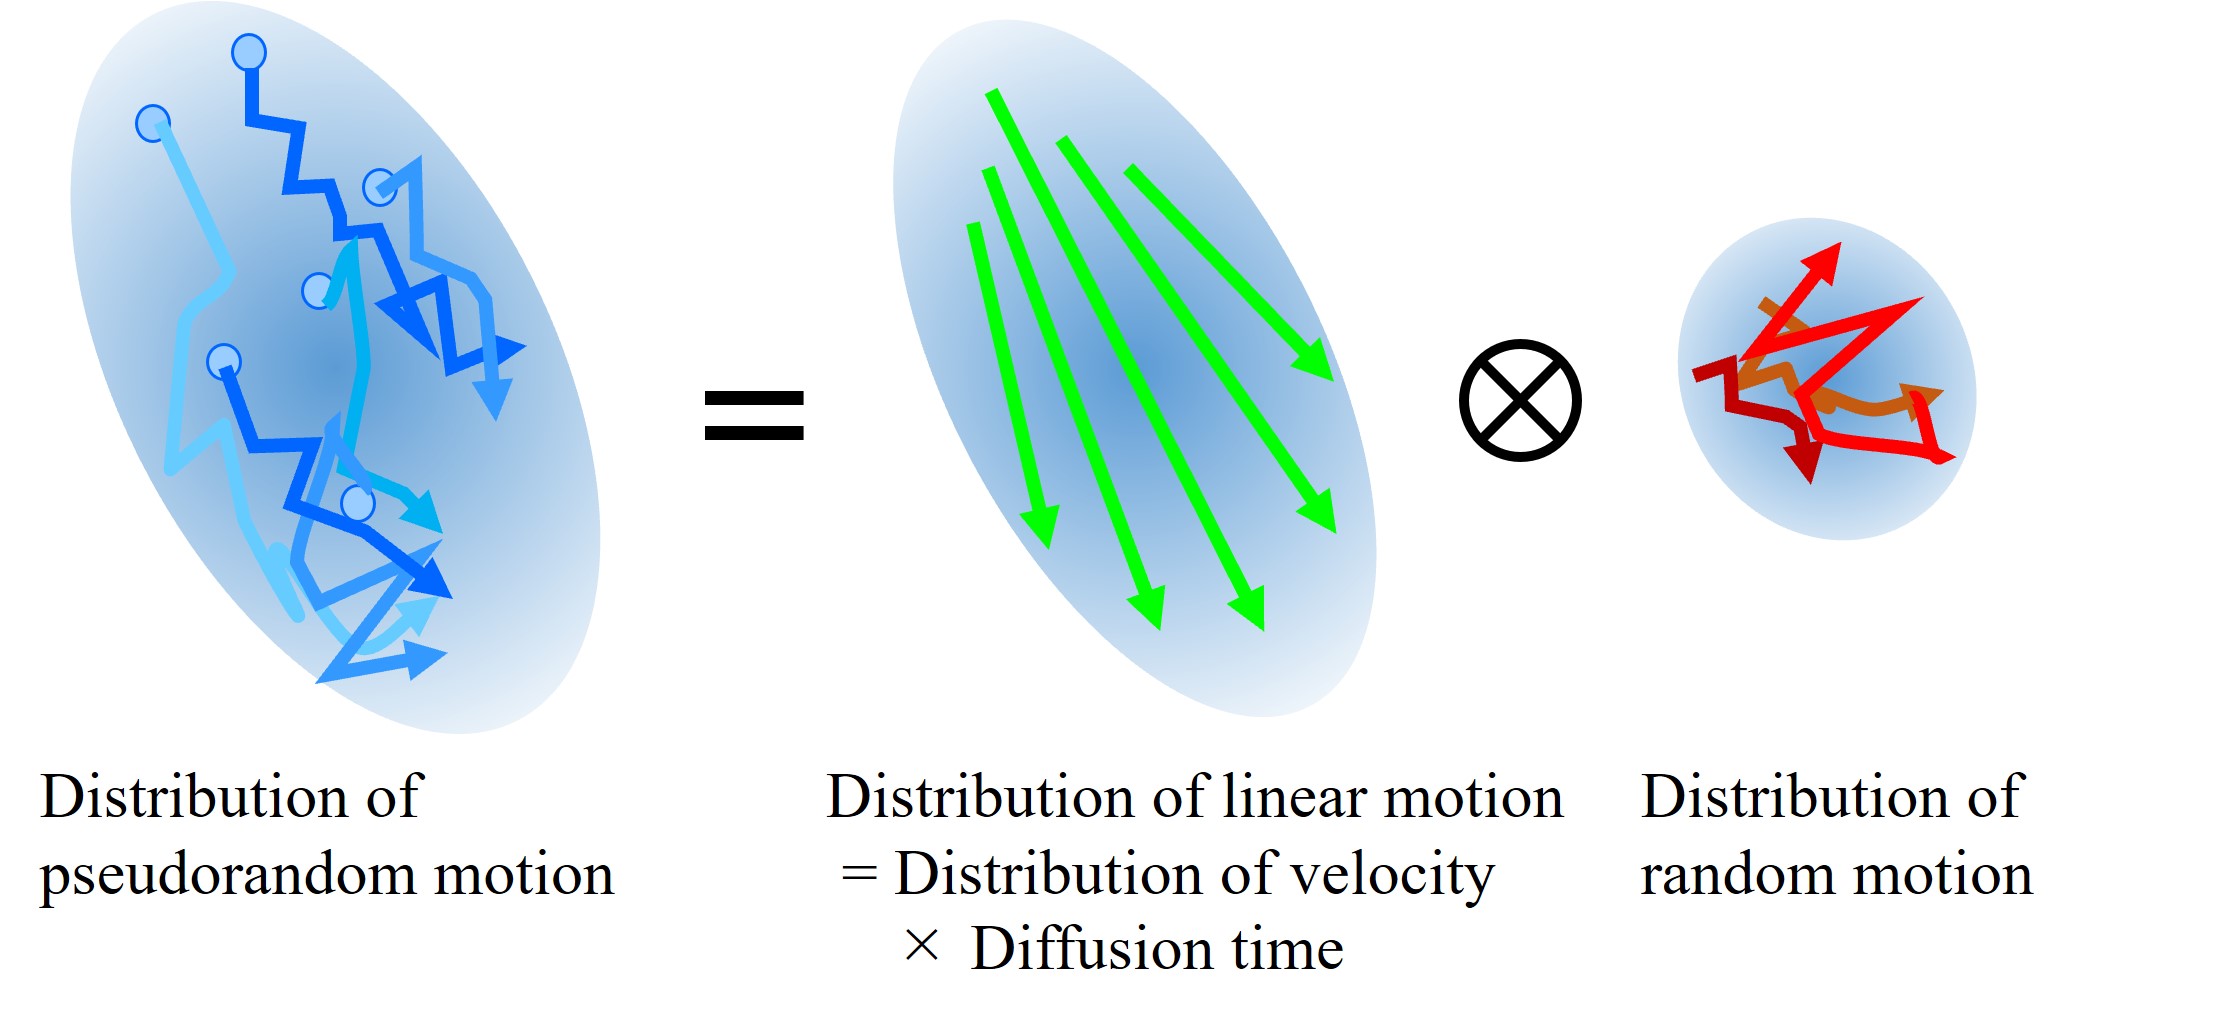
Analysis Technique of the CSF MotionBased on the proposed mathematical framework of Low-b DTI [3], the distribution of pseudorandom flow is modeled as a convolution of the distributions of linear flow (ordered motion) and random motion (disordered motion) in each voxel (Fig. 1). Thus, the mean diffusivity (MD) of the pseudorandom flow is expressed as the following equation: MD(τd) = DP + (VV /2) τd, where DP is the pseudo-diffusion coefficient of random motion, VV is the variance of velocity distribution and τd is diffusion time. Using this equation, the parameters DP and VV can be estimated by linearly fitting MD with multiple τd.
Experiments
This study was approved by the ethics committee of FUJIFILM Healthcare Corporation. A healthy volunteer was scanned using a 3T MRI (FUJIFILM Healthcare Corporation, Tokyo, Japan) with diffusion-weighted echo-planar imaging (DWEPI). Diffusion gradients were added with b = 0/100/1000 ×106 s/m2, 13 non-colinear directions, and τd = 32.7/42.7/52.7 ms which was changed by setting TE = 80/110/140 ms. Two consecutive scans were conducted to evaluate repeatability of the proposed technique. Scan time of DWEPI at each τd was about 7 minutes, and the total scan time was about 42 minutes. Diffusion tensor (DT) and corresponding MD were calculated using b = 0 and 100 ×106 s/m2 at each τd. To visually assess the DT, ellipsoid-representation maps were created in typical ROIs. To separate ordered and disordered motions of the CSF in the typical ROIs, average MD of the ROIs were calculated at every τd, and the parameters DP and VV were calculated by linearly fitting the average MD with τd. The validity and repeatability of the proposed analysis technique was evaluated by the following two indices: (1) the root-mean-square error (RMSE) of the linear fitting, and (2) the standard deviations of four VV and DP calculated using four combinations of the scan #1/#2 and τd = 32.7/52.7 ms.
Results
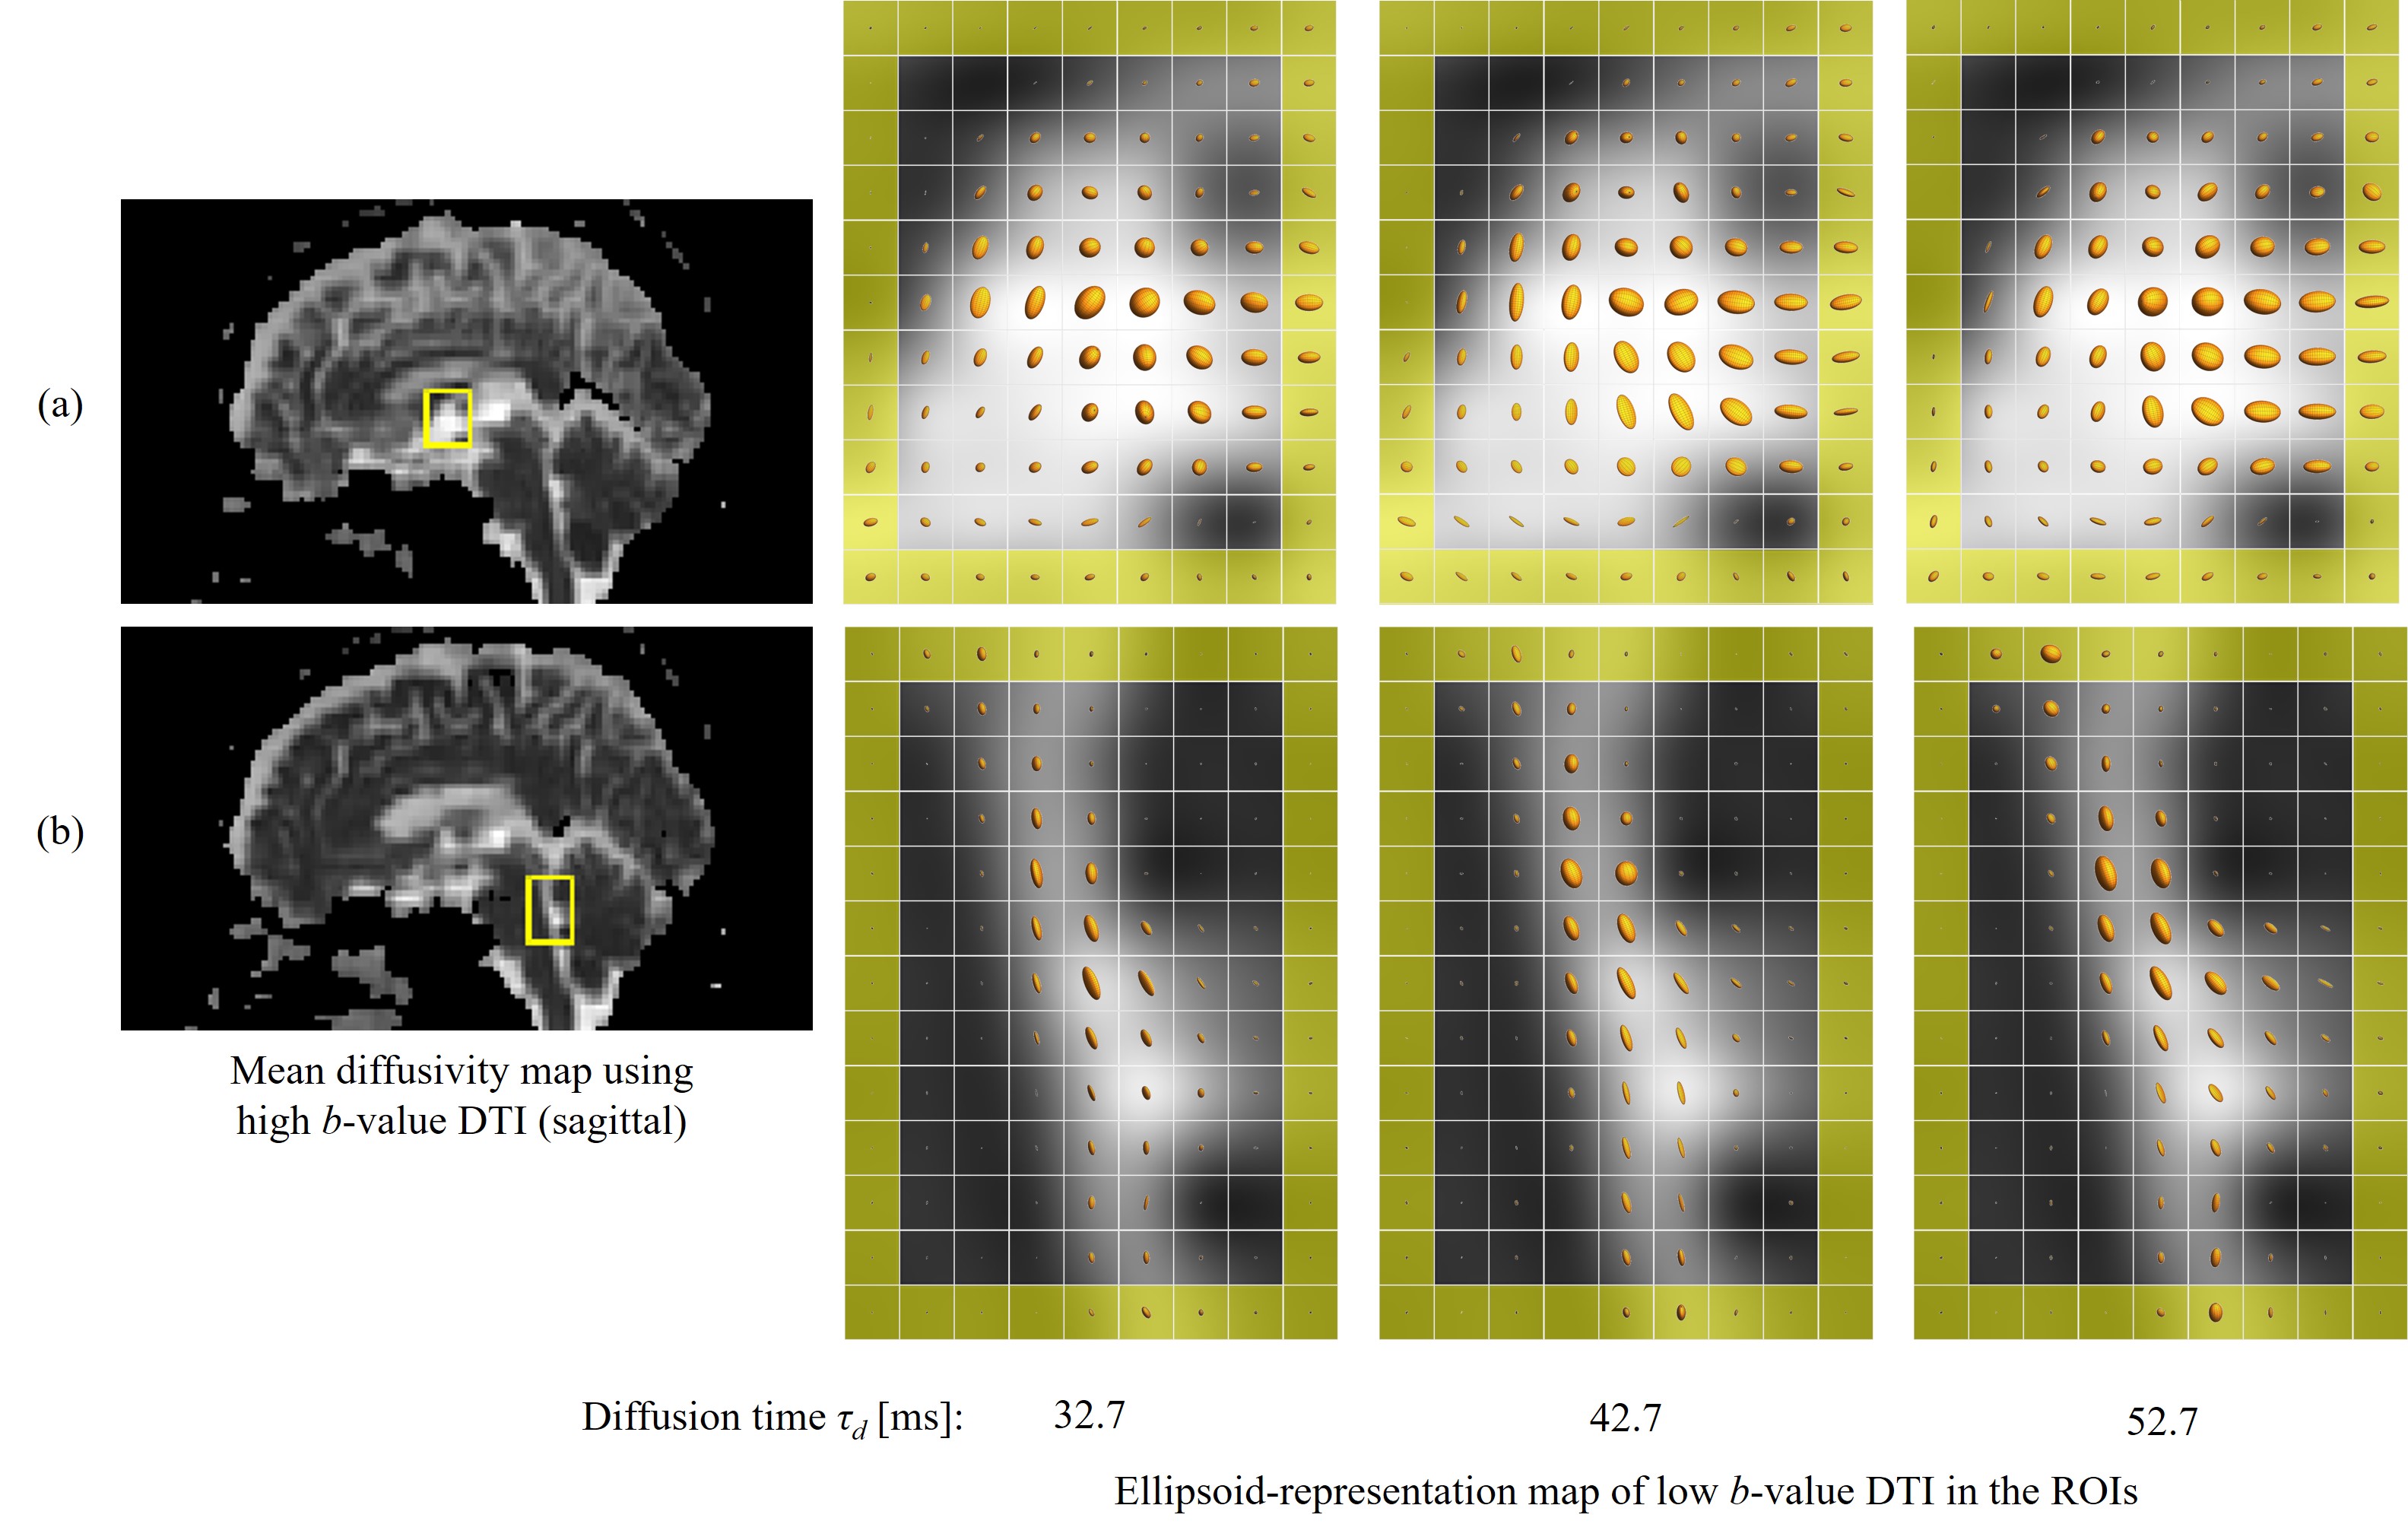
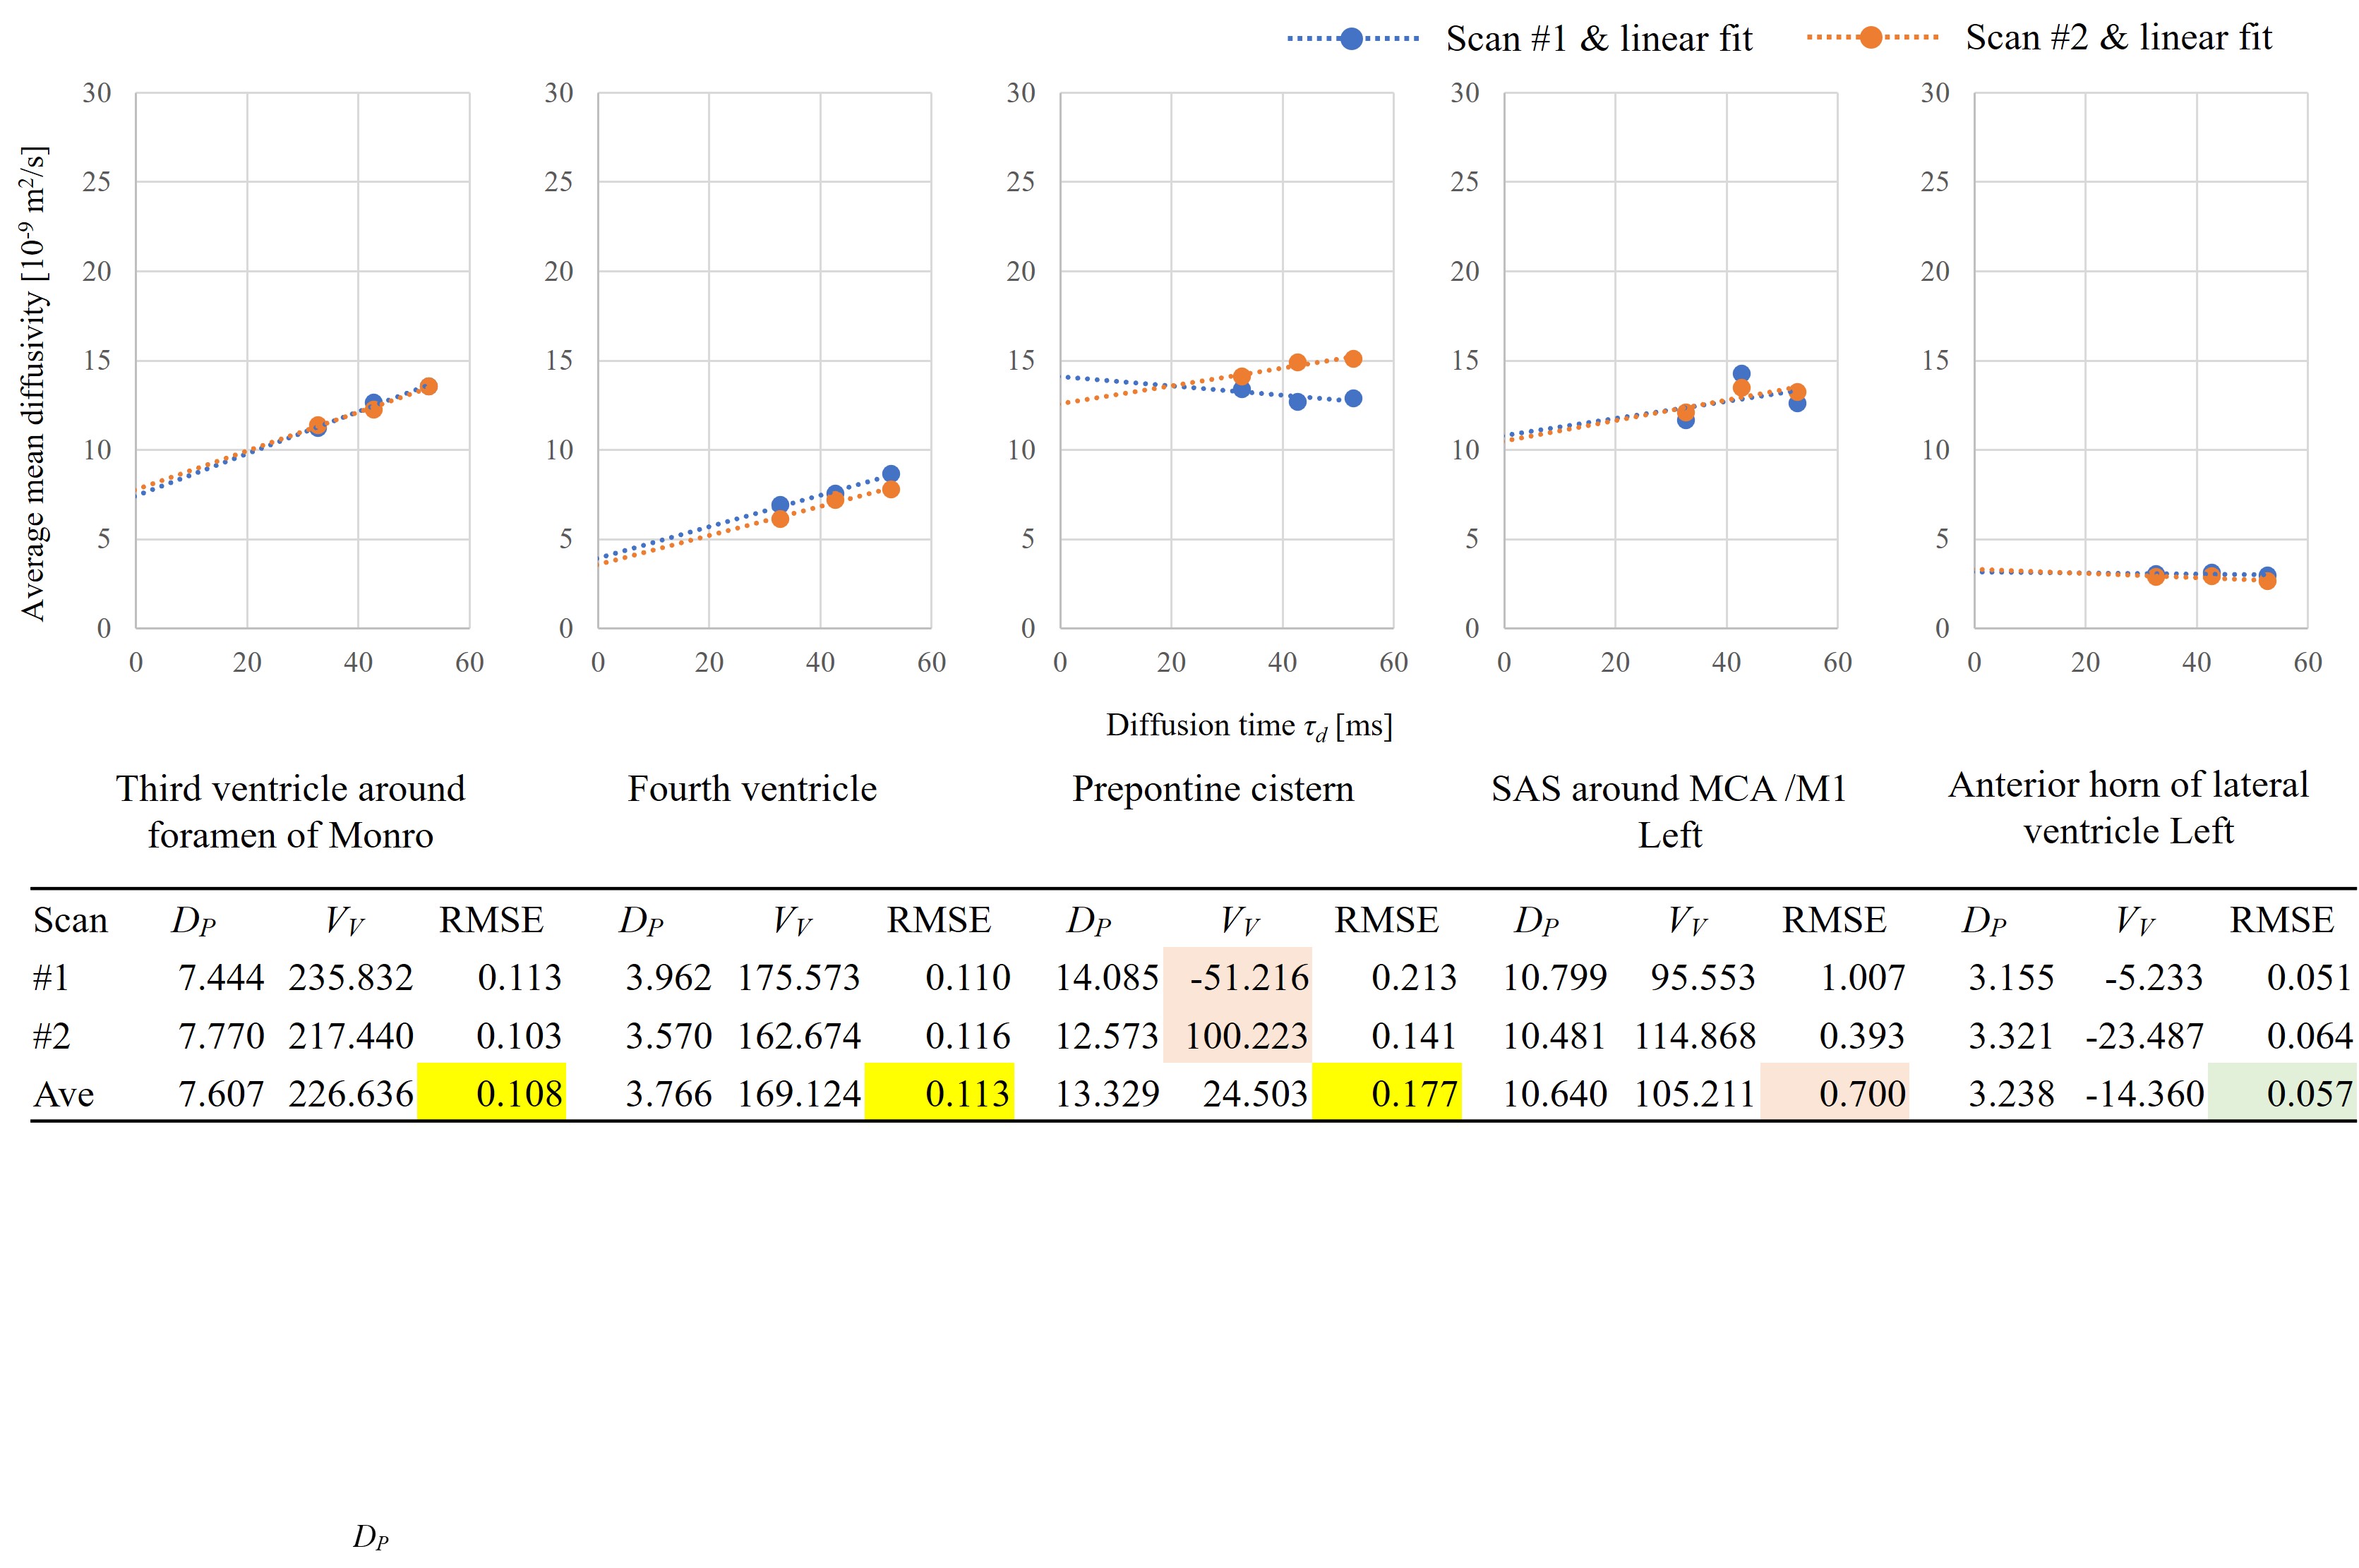
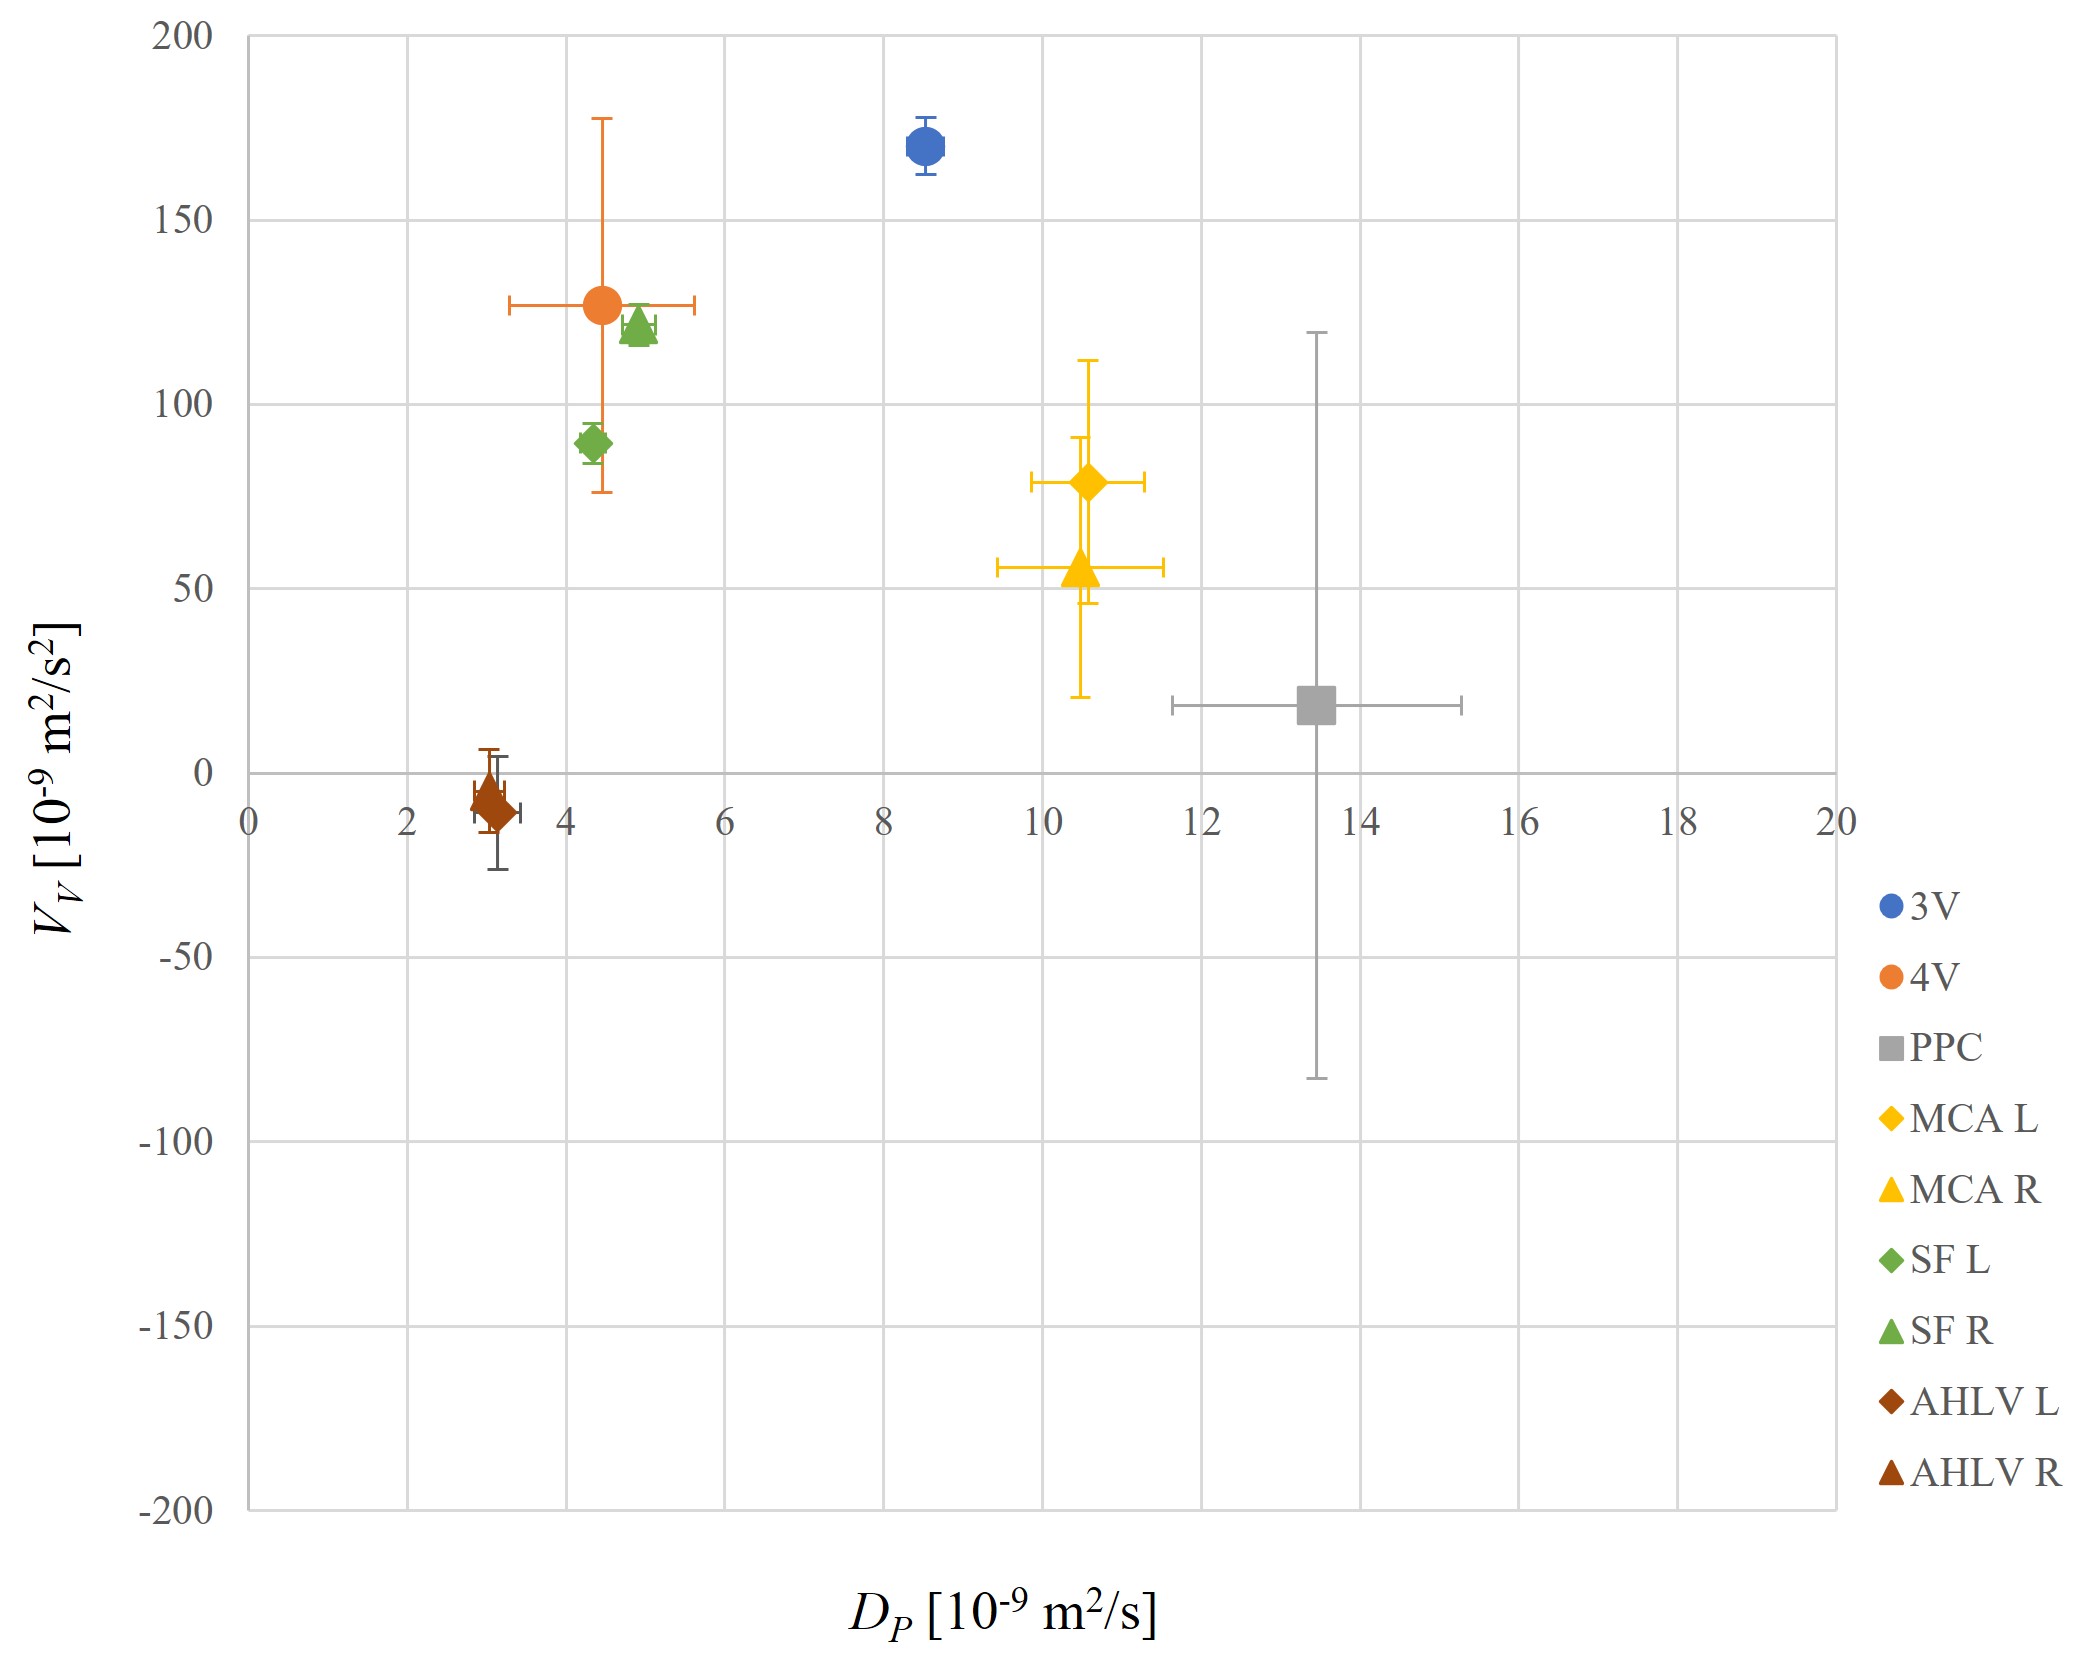
Figure 2 shows ellipsoid-representation maps of Low-b DTI in two typical ROIs, (a) third ventricle and (b) fourth ventricle, at three diffusion time τd. It shows gradually enlarging ellipsoids with the diffusion time. Figure 3 shows the average MDs and the linear fits in the above graphs, and estimated DP, VV and RMSE of the linear fitting in the below table. Figure 4 shows scatter plot of (DP, VV) of the typical ROIs. Figures 3 and 4 indicate that DP and VV vary depending on the ROIs. The figures also indicate that the precision and repeatability of the analysis is high in the third ventricle (3V), the sylvian fissure (SF) and the anterior horn of lateral ventricle (AHLV), moderate in the fourth ventricle (4V) and the subarachnoid space around MCA/M1, and low in the prepontine cistern (PPC).Discussion
Different DP and VV may mean different characteristics of the CSF motion in the ROIs. For example, low VV and low DP mean that the CSF motion is just molecular diffusion in AHLV. High VV and moderate DP mean that the motion is mostly ordered in 4V and SF. Moderate VV and high DP mean that the motion is mostly random in PPC and MCA (M1). The low repeatability in PPC and MCA/M1 may also mean that the CSF motion is not stable over time.Conclusion
An analysis technique for resolving intravoxel incoherent motion into ordered and disordered motions of the CSF is proposed. A normal subject study demonstrates that the proposed technique can differentiate characteristics of the CSF motion in the typical ROIs. The proposed technique is expected to be used for investigating complex motion of CSF.Acknowledgements
No acknowledgement found.References
1. Harrison IF, Siow B, Akilo AB, Evans PG, Ismail O, Ohene Y, Nahavandi P, Thomas DL, Lythgoe MF, Wells JA. Non-invasive imaging of CSF-mediated brain clearance pathways via assessment of perivascular fluid movement with diffusion tensor MRI. Elife 2018;7:e34028.
2. Hirschler L, Runderkamp B, van Veluw S, Caan M, van Osch M. Effects of the cardiac and respiratory cycles on CSF-mobility in human subarachnoid and perivascular spaces. In Proc. ISMRM 2022; #320.
3. Bito Y, Harada K, Ochi H, Kudo K. Low b-value diffusion tensor imaging for measuring pseudorandom flow of cerebrospinal fluid. Magn Reson Med 2021;86(3):1369-1382.
4. Bito Y, Ochi H, Harada K, Shirase R, Kudo K. Low b-value diffusion tensor imaging (Low-b DTI) for investigating CSF motion. In Proc. ISMRM Workshop on Neurofluids 2022.
Figures