3002
Sequential PET/MR reveals evidence of parasagittal dural hypertrophy in the setting of elevated Aβ burden in adults with Alzheimer’s disease1Neurology, Vanderbilt University Medical Center, Nashville, TN, United States, 2Vanderbilt Brain Institute, Vanderbilt University, Nashville, TN, United States, 3Radiology and Radiological Sciences, Vanderbilt University Medical Center, Nashville, TN, United States, 4Biostatistics, Vanderbilt University Medical Center, Nashville, TN, United States, 5Center for Quantitative Sciences, Vanderbilt University Medical Center, Nashville, TN, United States
Synopsis
Keywords: Neurofluids, Alzheimer's Disease
A pathological hallmark of Alzheimer’s disease (AD) is the elevated aggregation of protein amyloid-β (Aβ) in the cerebrum. Recent studies have suggested a role for the parasagittal dural (PSD) space in cerebrospinal fluid (CSF) egress and associated protein clearance. A fully connected neural network was used to generate PSD segmentation masks from 3D T2-weighted turbo-spin-echo data to assess the relationship between PSD space volume and Aβ burden estimated by 11C-Pittsburgh Compound B in AD participants. PSD space hypertrophy was significantly associated with elevated Aβ levels and was localized to the frontal and parietal subsegments of the PSD.Introduction
The overall goal of this work is to apply novel MRI methods to explore surrogate measures of cerebrospinal fluid (CSF) egress in the context of amyloid-β (Aβ) retention in Alzheimer’s disease (AD). The amyloid hypothesis proposes that the imbalance of Aβ production and clearance contributes to the development of AD. Studies have demonstrated that production rates of Aβ do not differ in AD1, and rather, it may be insufficient clearance of Aβ that predominately contributes to aggregation. Increasing evidence suggests that CSF clears central nervous waste products including Aβ via the bulk and possibly recently-proposed glymphatic system2. CSF egress from the subarachnoid space has been proposed partly to occur along the parasagittal dural (PSD) space which is located along the sagittal sinus2–4. As such, changes in PSD space morphology may have relevance to reduced clearance of Aβ in adults with AD. To elucidate this relationship, we measured Aβ accumulation using PET with 11C-Pittsburgh Compound B (PIB) in combination with a novel MR method for estimating PSD space volume to test the primary hypothesis that PSD hypertrophy scales with elevated global Aβ burden. Additionally, we visualize the topography of the hypothesized PSD hypertrophy to understand whether specific portions of the PSD may associate most closely with Aβ burden.Methods
All participants had a clinical diagnosis of AD or amnestic mild-cognitive-impairment with Aβ-positivity and were recruited from behavioral and cognitive neurology clinics and provided written, informed consent. Acquisition. MRI data were acquired at 3.0 Tesla (Philips) using a body coil radiofrequency transmission and phased array 32-channel reception. The scanning protocol consisted of a 3D T1-weighted magnetization-prepared-rapid-gradient-echo (TR=8.1 ms, TE=3.7 ms, spatial resolution=1.0x1.0x1.0 mm3) for anatomical reference and a 3D T2-weighted volume isotropic-turbo-spin-echo-acquisition (TR=2500 ms, TE=331 ms, spatial resolution=0.78x0.78x0.78 mm3) for PSD space volumetric measurement. PET data were acquired using a Digital PET/CT scanner (Philips Vereos) with three-dimensional emission acquisition. Following an intravenous bolus injection of 11C-PIB, a 70-minute dynamic PET scan was acquired and reconstructed with a direct Fourier method with Fourier reprojection (spatial resolution=2.0x2.0x2.0 mm3) algorithm. Analysis. PSD segmentations were generated from 3D T2-weighted TSE images with a combination of a fully connected neural network based on a stacked U-net architecture5. The first layer estimates a binary mask of the peri-sinus space, and the second layer estimates a label map of the PSD and superior sinus lumen based on T2-weighted signal intensities. The PSD was further segmented into prefrontal, frontal, parietal and occipital subsections. The prefrontal and frontal PSD are distinguished by a plane crossing the pituitary gland and rostrum of the corpus callosum such that the prefrontal PSD lies ventral to the plane and the frontal PSD dorsal. The parietal region is delineated from the frontal PSD by the central sulcus and extends to the parietal-occipital fissure. Finally, the occipital PSD is delineated from the parietal-occipital fissure to the posterior end of the PSD. All PSD volumes are expressed in cubic centimeters (cm3). T1-weighted data were used to segment region-of-interest masks from the AssemblyNet algorithm6. 11C-PIB PET data were used to generate parametric binding potential (BPND) maps from a two-step simplified reference tissue model (SRTM2)7, using cerebellar gray matter as a reference region, in PMOD (version 4.2, PMOD Technologies LLC, Zürich, Switzerland). Parametric BPND maps were transformed to native T1-weighted space and a region-based voxel-wise partial volume correction was applied8. Global Aβ burden was estimated from a mask of commonly observed Aβ aggregation topography9. Statistical testing. To test the primary hypothesis that PSD hypertrophies with increasing Aβ burden, a linear regression model was defined with 11C-PIB BPND as the dependent variable, PSD volume as the independent variable, and age and biological sex as explanatory variables. Additional analyses of the subsections of the PSD used a similar linear model with PSD subsection volume as the independent variable.Results
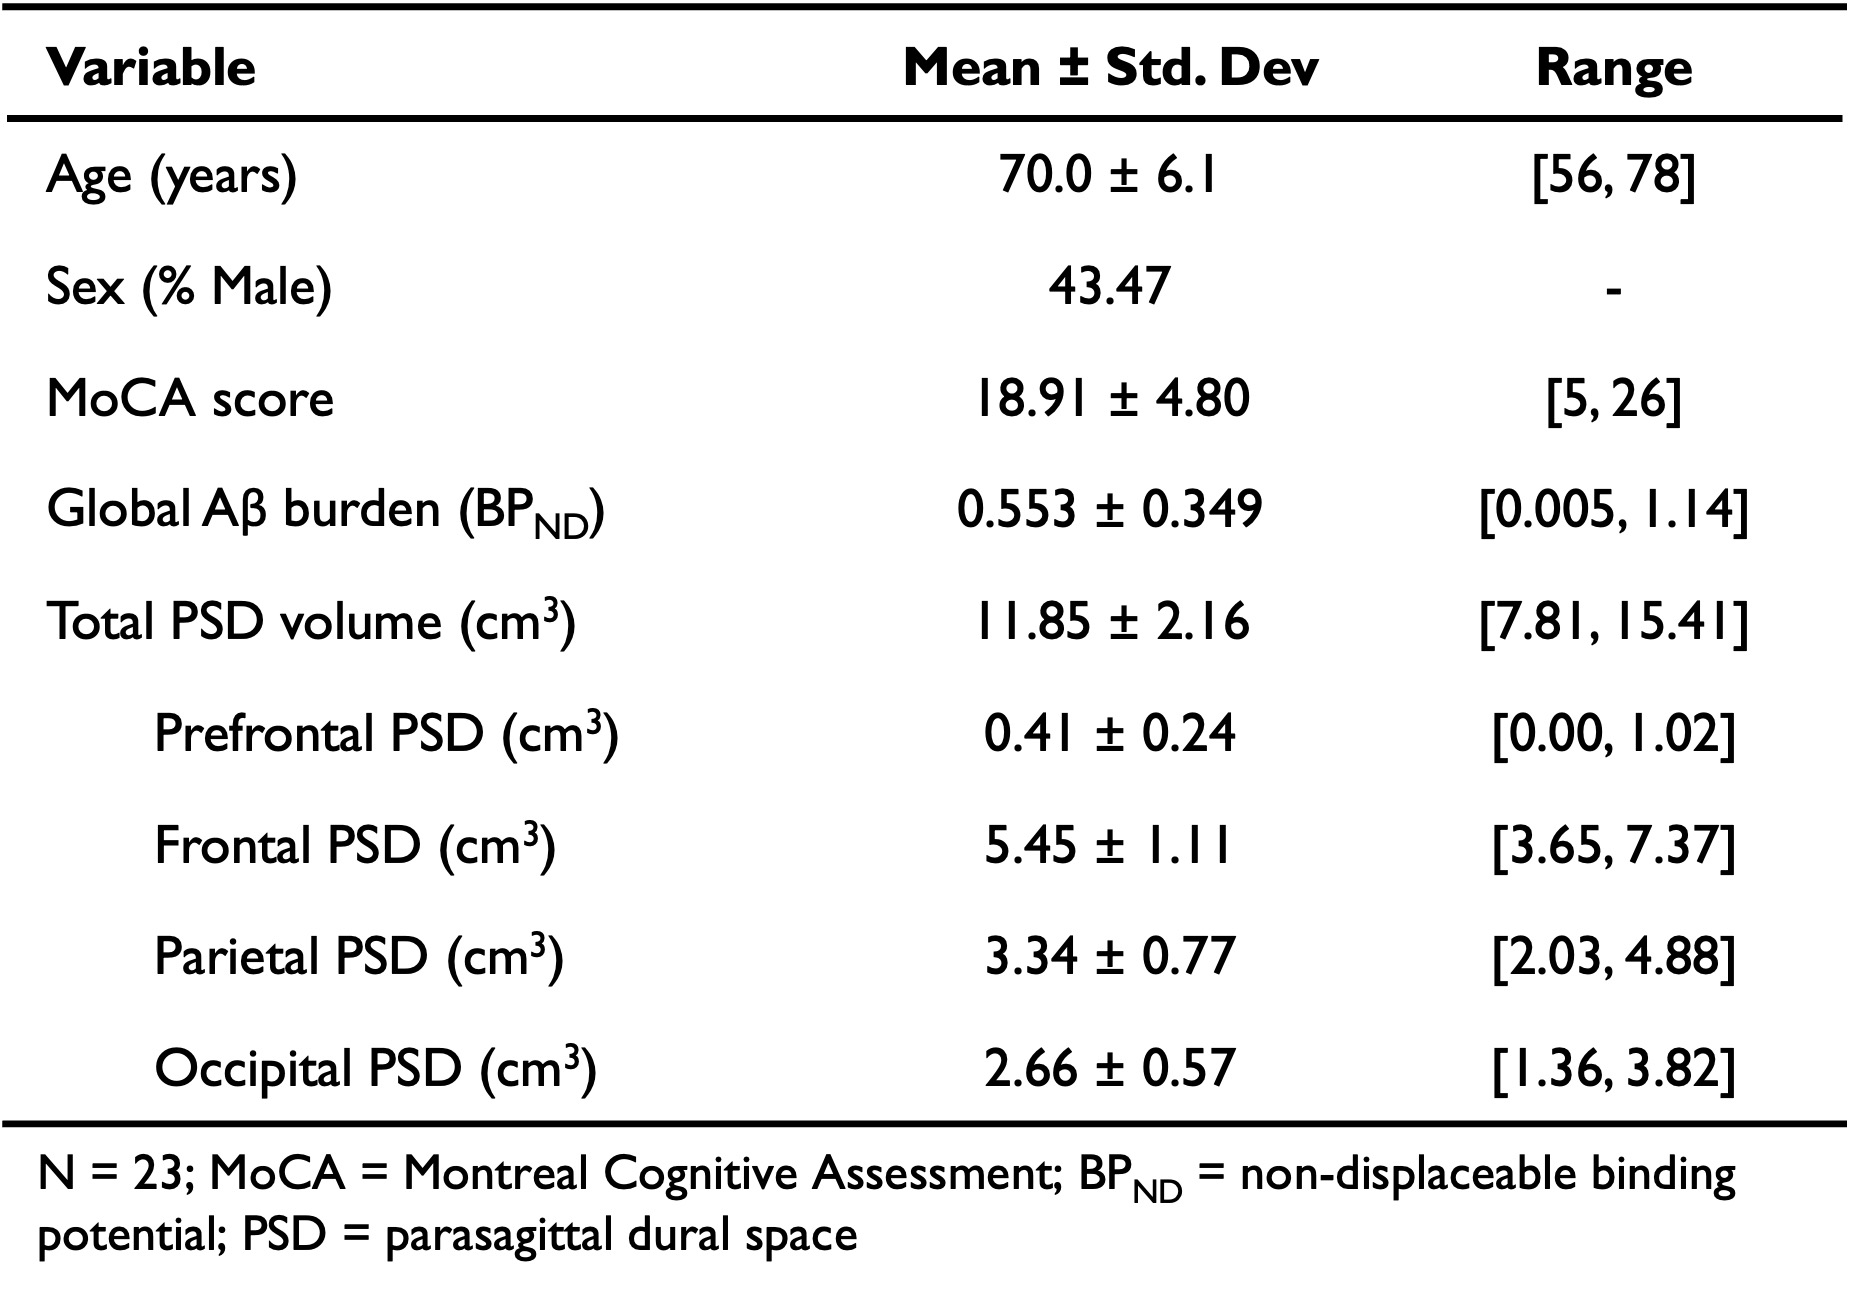
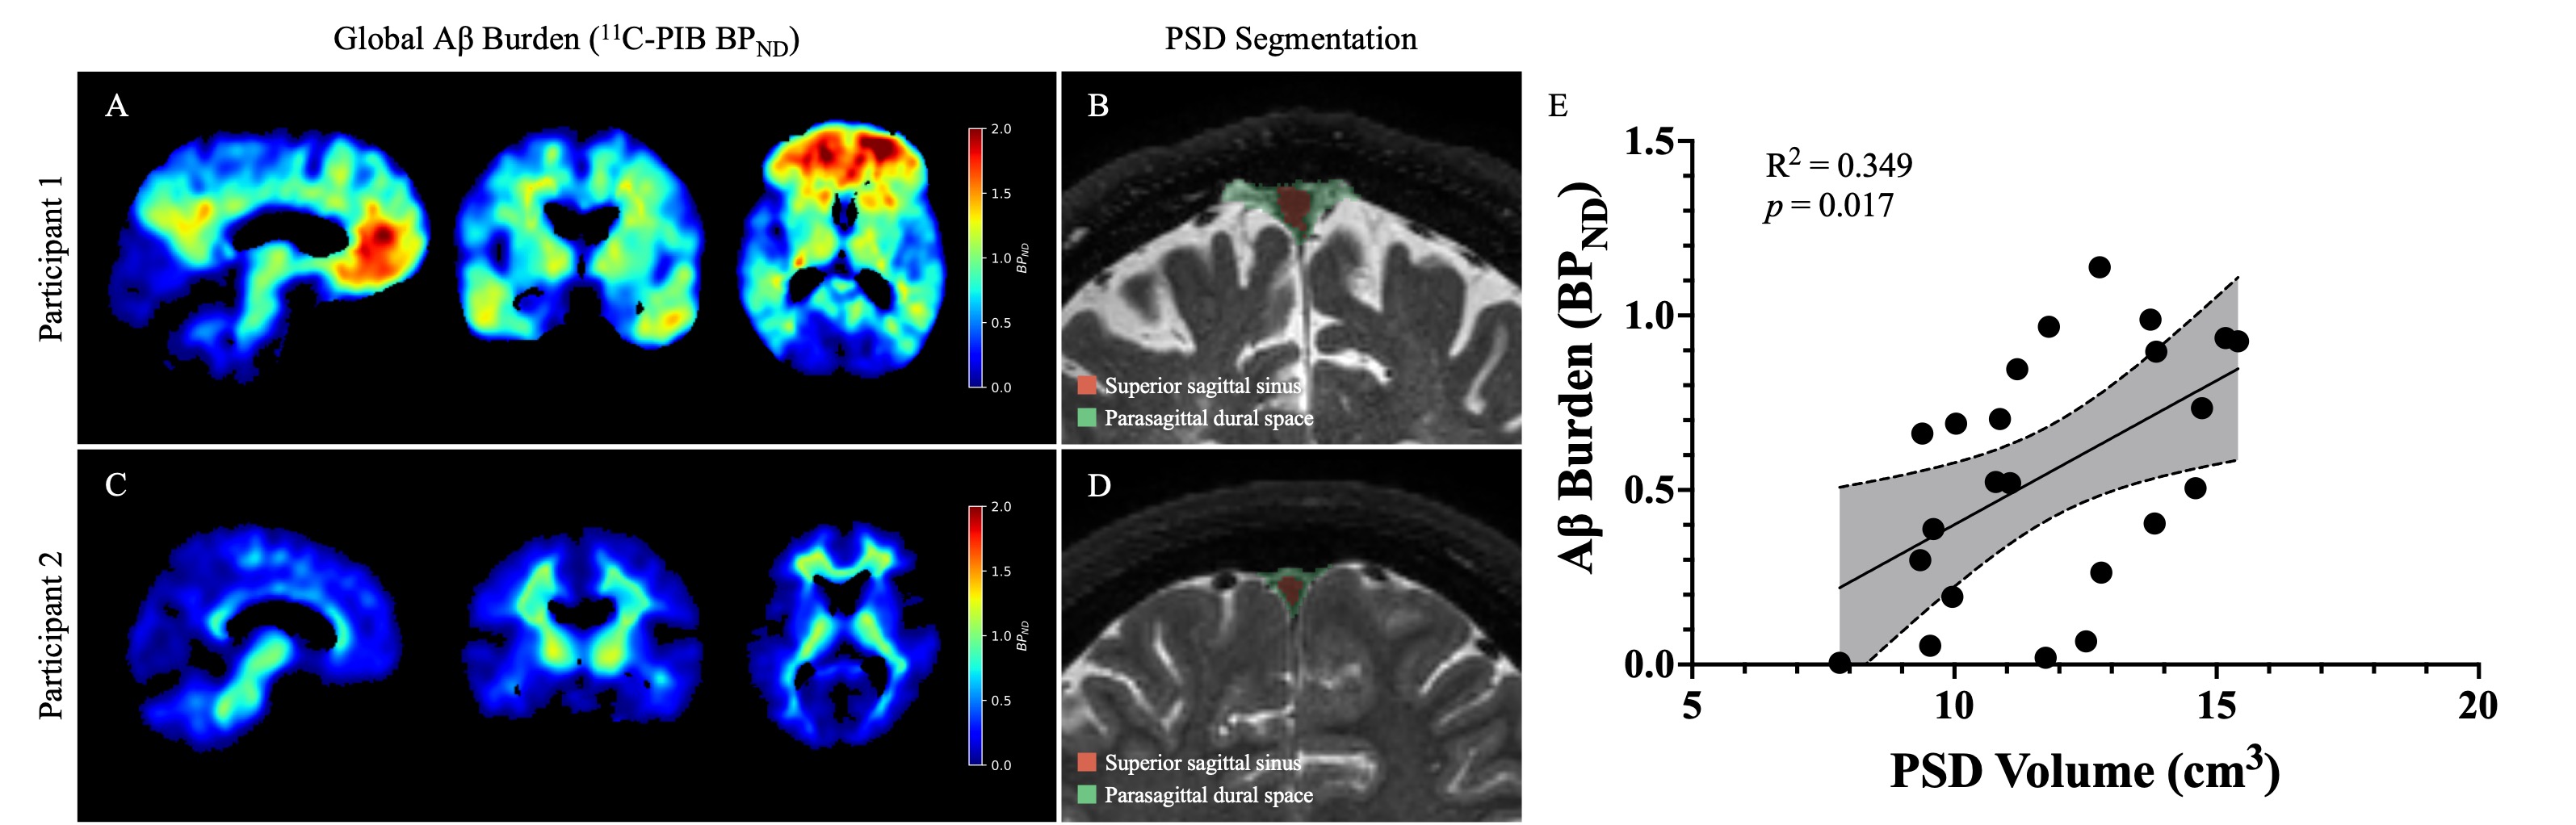
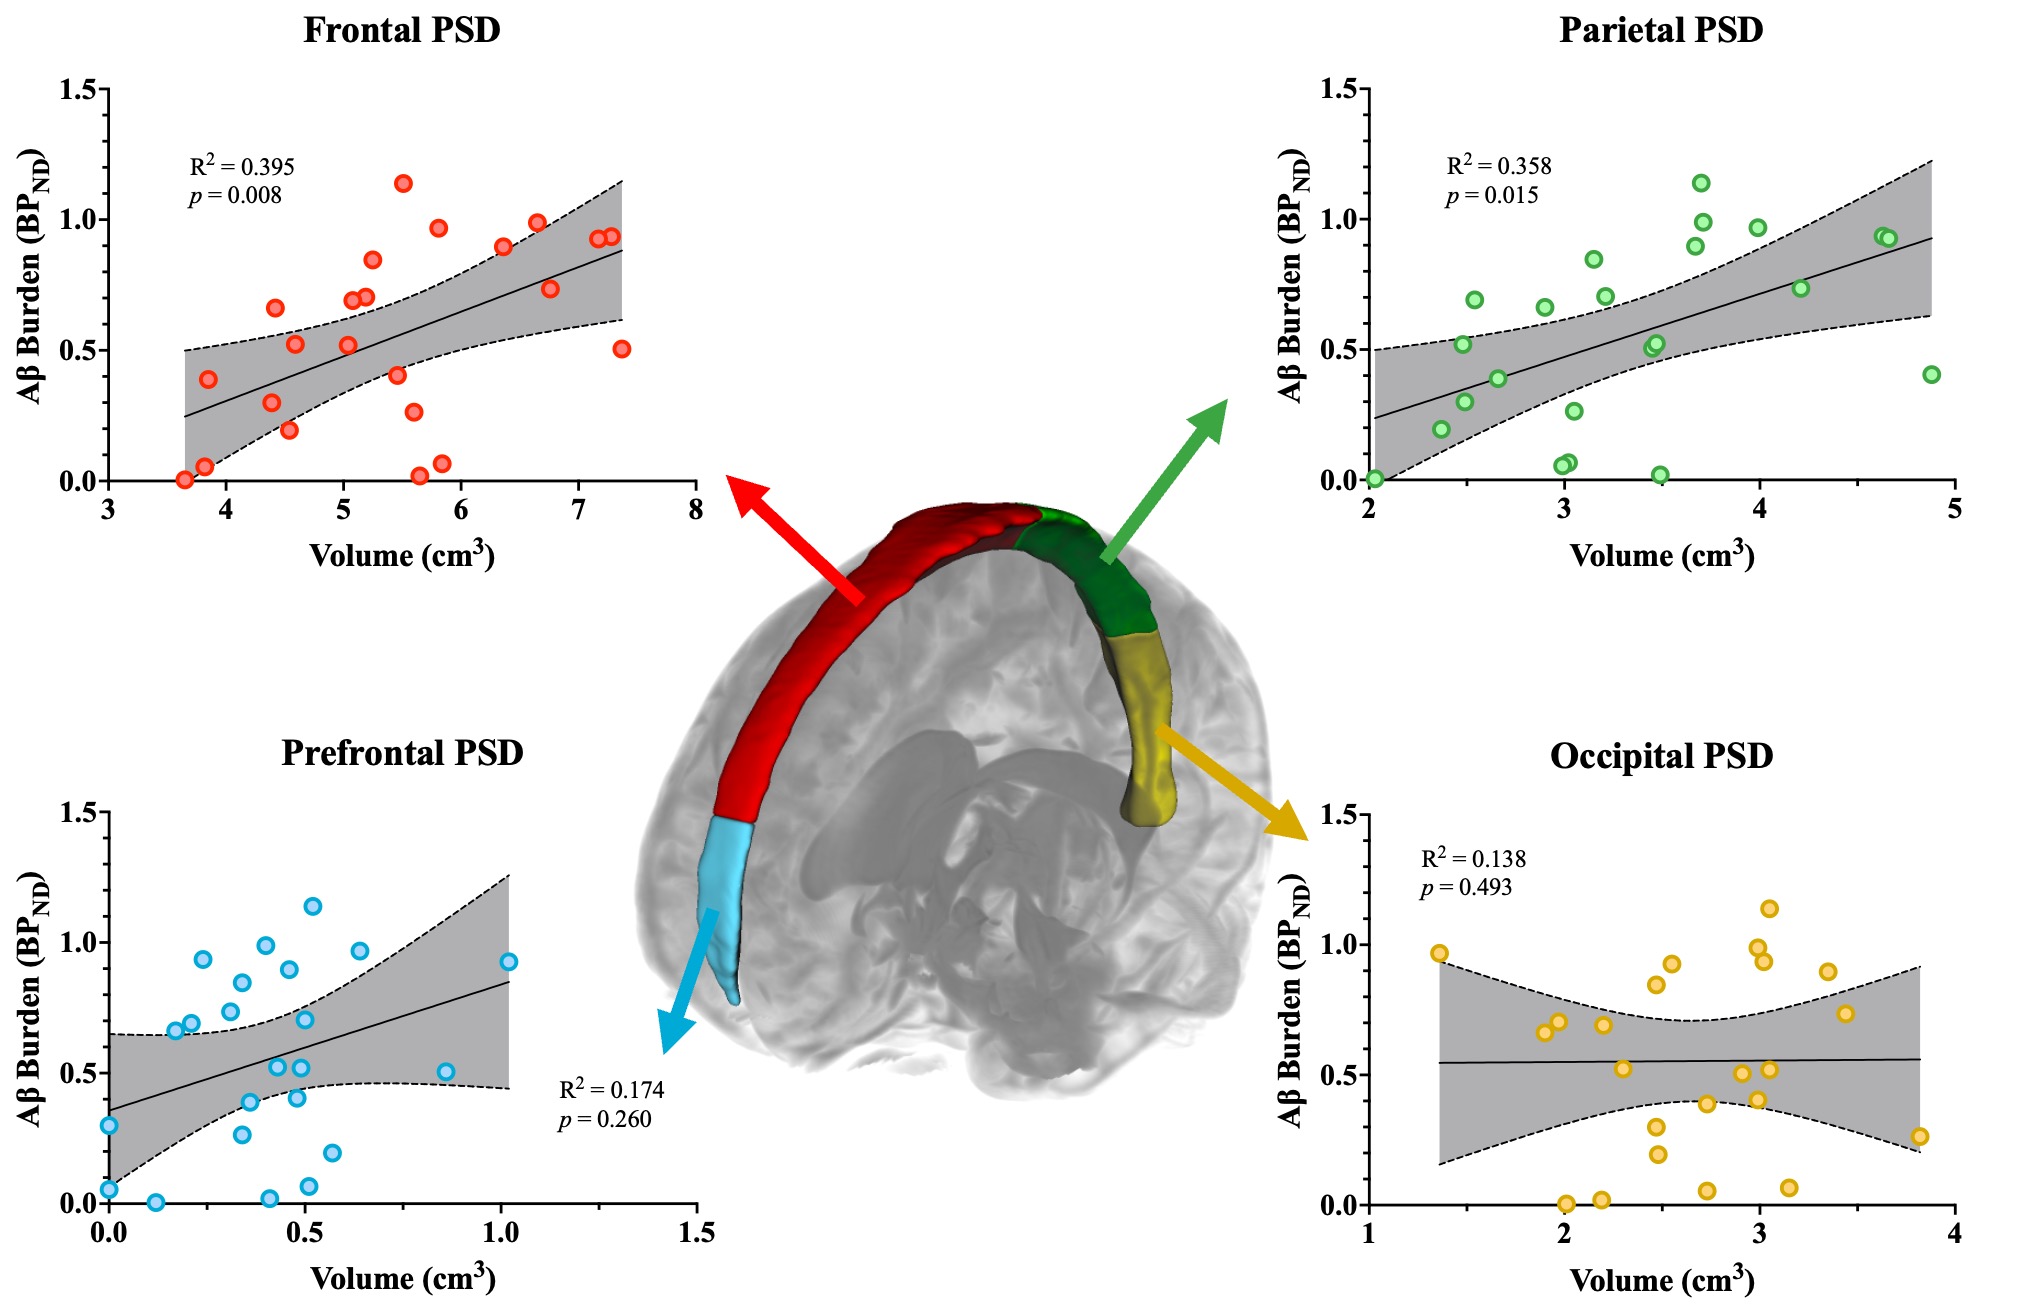
Table 1 summarizes the demographics and imaging outcomes for the 23 participants in the study. The linear model assessing the primary hypothesis revealed a significant, positive relationship between total PSD volume and global BPND (R2=0.349, p=0.017; Figure 1). Specifically, increases in total PSD volume were closely associated with increases in global BPND of 11C-PIB. A schematic of the PSD subregions and associated scatterplots for each subregion is depicted in Figure 2. Both the frontal and parietal PSD volumes were positively associated with global BPND of 11C-PIB and met significant criteria (frontal: R2=0.395, p=0.008; parietal: R2=0.373, p=0.014).Discussion
We evaluated how parasagittal dural space volume as estimated on 3D, high spatial resolution T2-weighted MRI relates to global Aβ burden in adults with varying levels of disease burden. Analyses revealed that hypertrophy of the total PSD space is associated with elevations in global Aβ burden specifically in the frontal and parietal subsegments. These findings suggest that CSF egress within these segments of the PSD may play a relevant role in the clearance of Aβ aggregates. This finding is particularly intriguing given that the strongest relationships are seen in subsegments correlated with commonly observed Aβ aggregation topography.Conclusion
Frontal and parietal parasagittal dural spaces, quantified from recently-validated deep learning algorithms applied to submillimeter 3D T2-weighted MRI, were significantly larger in Alzheimer’s disease patients with elevated levels of Aβ burden.Acknowledgements
No acknowledgement found.References
1. Mawuenyega KG, Sigurdson W, Ovod V, et al. Decreased Clearance of CNS β-Amyloid in Alzheimer’s Disease. Science (1979). 2010;330(6012):1774-1774. doi:10.1126/science.1197623
2. Eide PK, Ringstad G. Cerebrospinal fluid egress to human parasagittal dura and the impact of sleep deprivation. Brain Res. 2021;1772:147669. doi:10.1016/j.brainres.2021.147669
3. Iliff JJ, Chen MJ, Plog BA, et al. Impairment of Glymphatic Pathway Function Promotes Tau Pathology after Traumatic Brain Injury. The Journal of Neuroscience. 2014;34(49):16180-16193. doi:10.1523/JNEUROSCI.3020-14.2014
4. Ringstad G, Eide PK. Cerebrospinal fluid tracer efflux to parasagittal dura in humans. Nat Commun. 2020;11(1):354. doi:10.1038/s41467-019-14195-x
5. Hett K, McKnight CD, Eisma JJ, et al. Parasagittal dural space and cerebrospinal fluid (CSF) flow across the lifespan in healthy adults. Fluids Barriers CNS. 2022;19(1):24. doi:10.1186/s12987-022-00320-4
6. Coupé P, Mansencal B, Clément M, et al. AssemblyNet: A large ensemble of CNNs for 3D whole brain MRI segmentation. Neuroimage. 2020;219:117026. doi:10.1016/j.neuroimage.2020.117026
7. Wu Y, Carson RE. Noise Reduction in the Simplified Reference Tissue Model for Neuroreceptor Functional Imaging. Journal of Cerebral Blood Flow & Metabolism. 2002;22(12):1440-1452. doi:10.1097/01.WCB.0000033967.83623.34
8. Thomas BA, Erlandsson K, Modat M, et al. The importance of appropriate partial volume correction for PET quantification in Alzheimer’s disease. Eur J Nucl Med Mol Imaging. 2011;38(6):1104-1119. doi:10.1007/s00259-011-1745-9
9. Klunk WE, Koeppe RA, Price JC, et al. The Centiloid Project: Standardizing quantitative amyloid plaque estimation by PET. Alzheimer’s & Dementia. 2015;11(1):1. doi:10.1016/j.jalz.2014.07.003
Figures