3001
Changes in Brain Water Components in Normal Aging1Weill Cornell Medicine, New York, NY, United States, 2University of Pennsylvania, Philadelphia, PA, United States
Synopsis
Keywords: Neurofluids, Aging
Water homeostasis in brain involves the fluid dynamic through the intracellular fluid, extracellular fluid and CSF, and it’s important to help maintaining the brain function. The change of water compartments with aging may reflect the physiology and pathophysiology of the brain. We mapped the brain CSF water fraction, myelin water fraction and intro-extracellular water fraction using an MR FAST-T2 relaxometry approach. We found the brain CSF water quadratically increases with normal aging. Myelin water increases before the 50s and then decrease in adults. Intro-extracellular water decreases in the adult lifespan. This results are impactful for understanding the glymphatic clearance mechanism.Introduction
Water homeostasis in the brain involves the dynamic flow of fluid through the intracellular space, extracellular space, and CSF, which is important in maintaining brain function1,2. Changes in these water compartments with aging may reflect both the physiology and pathophysiology of the brain and can be mapped as intra-extracellular water (IEW), myelin water (MW), and parenchymal CSF by using MRI T2 spectrum3,4. Myelin water change reflects both demyelination and remyelination. Intra/extracellular water may reflect brain tissue dehydration and atrophy. CSF dynamics are believed to play a significant role in the clearance of brain metabolic waste. Dysfunctional brain clearance is postulated to be a cause of many neurodegenerative diseases5, and increased brain parenchymal CSF may reflect glymphatic fluid stasis. Understanding how the brain water components change in normal aging may help us differentiate the mechanisms leading to healthy aging versus neurodegeneration disease6 and has been incompletely assessed. In this study, we investigated how brain water components change with age for cognitively normal subjects using MRI-based multi-echo FAST-T2 relaxometry3.Material and methods
SubjectsThe T2 components of CSF fraction (CSFF), myelin water fraction (MWF), and intra-extracellular water fraction (IEWF) were examined using multi-echo FAST-T2 relaxometry on 66 healthy subjects (age range: 22-80 years, mean(sd) = 48.41 (16.7), female/male = 40/26). All the subjects were scanned on a 3T Siemens Prisma scanner with a 64-channel head-neck coil. The multi-echo (TE=0, 7.5, 17.5, 67.5, 147.5, 307.5) FAST-T2 with voxel dimension 0.93x0.93x5 mm3 for water components mapping, 0.5mm isotropic T1 MPRAGE for ROI parcellation and co-registration, 0.5 mm isotropic T2 SPACE for perivascular space (PVS) segmentation were acquired.
Processing
CSFF, MWF, and IEWF were obtained by fitting the multi-echo FAST-T2 data into the three-water components model using the nonlinear least square with a smoothing regularization term3. CSFF corresponds to the long T2 (T2>200 ms) component, IEWF is for the intermediate T2 (20 ms<T2<200 ms) component and MWF is for the short T2 (T2<20 ms) component. The partial volume effect was addressed by eroding the considered ROIs by 4 mm. All the water maps were coregistered to the FreeSurfer space and ROI values were extracted.
Analysis
Multivariate regression models were evaluated between water components in deep gray matter (combining caudate, thalamus, and putamen) and cerebral white matter, adjusted for age, gender, and regional volume. The relationships between PVS load and CSF were evaluated as well by using simple linear regression.
Results
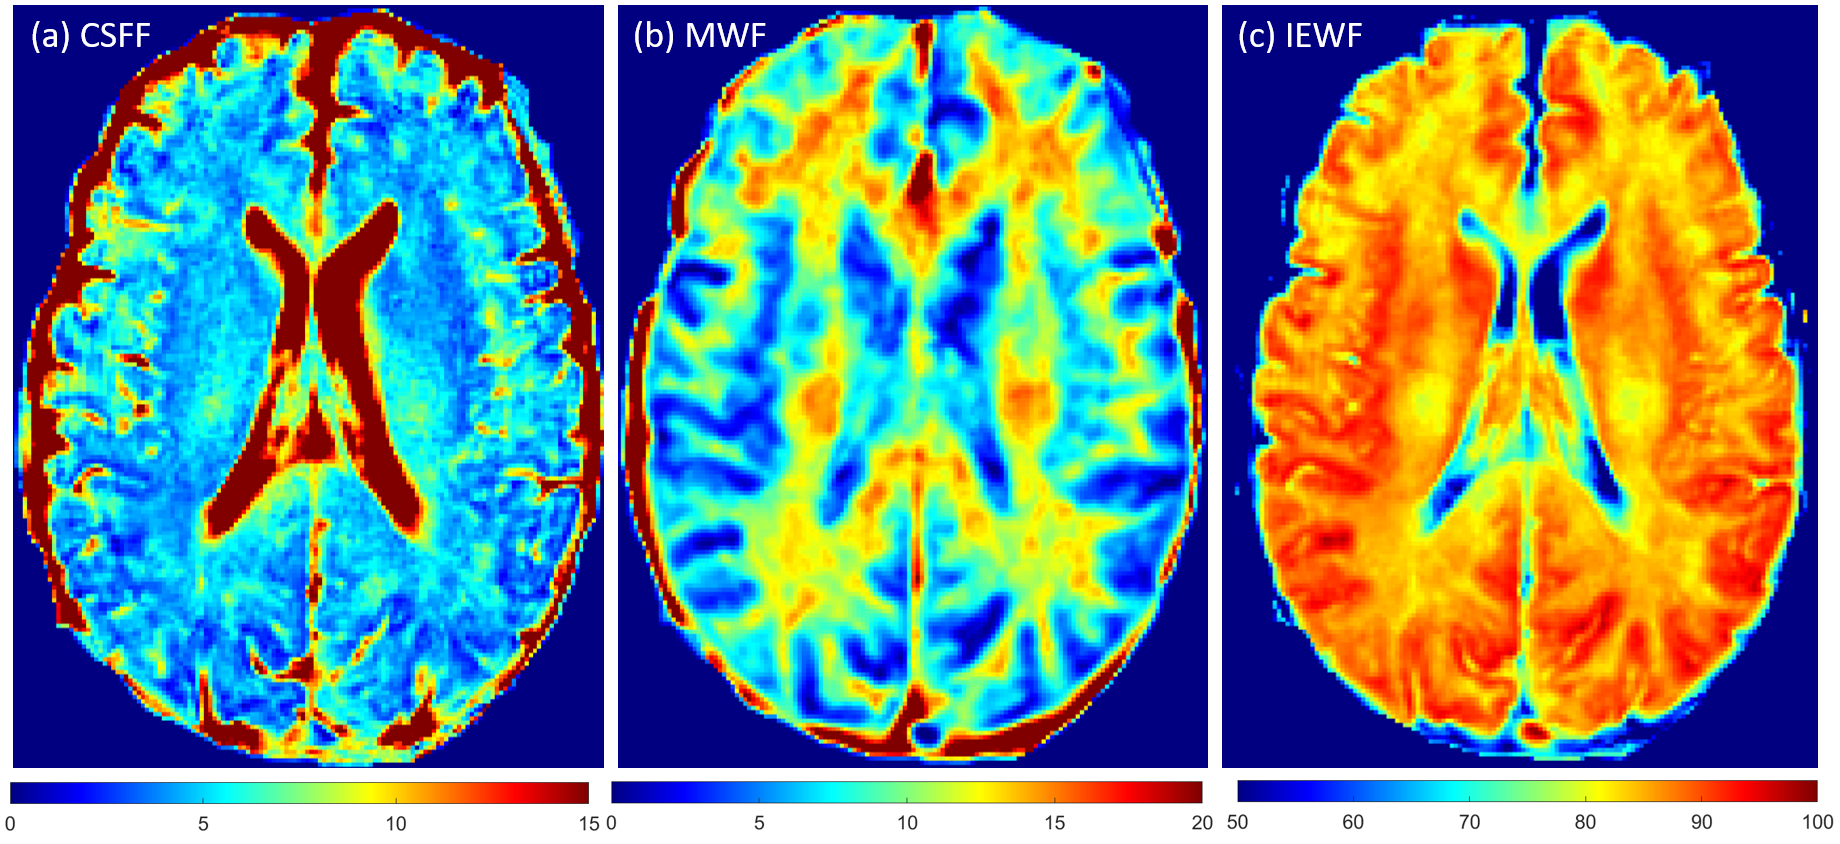
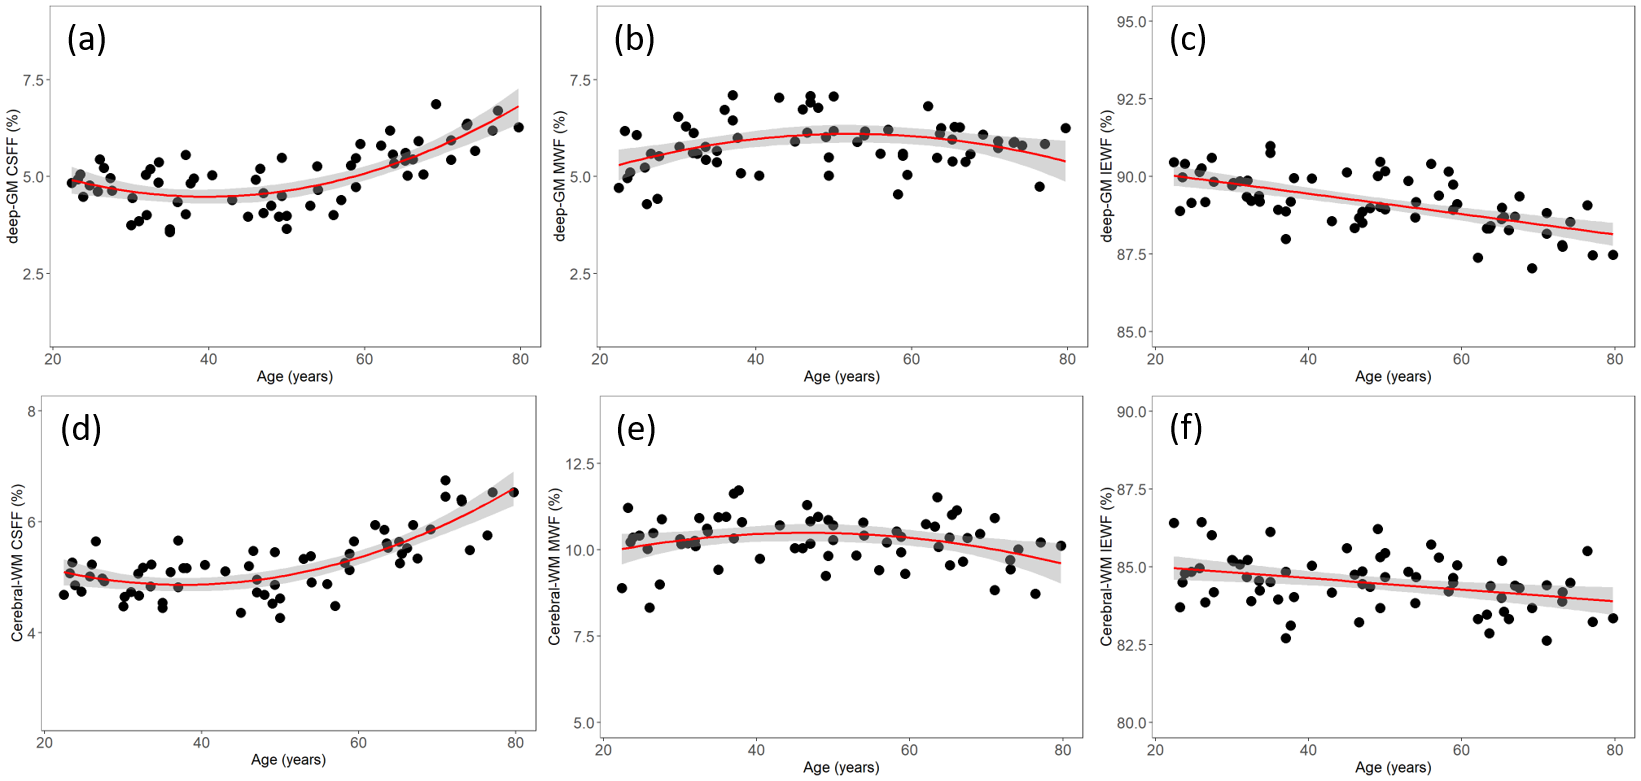
Figure 1 shows the maps for the three water components in a healthy subject.We found that the CSFF, MWF, and IEWF change with age but in different patterns. Specifically, CSFF changes quadratically with age in both deep gray matter and cerebral white matter, i.e., CSF water stays flat relative to age before the 50s, and increases after that in all considered regions (p < 0.0001) as shown in Figure 2 (a) and (d). MWF in the deep gray matter and cerebral white matter follows an inverted U-shape with age (p < 0.05), i.e., it increases before the 50s and decreases after that as shown in Figures 2 (b) and (e). IEWF decreases in all the considered ROIs (p < 0.001) shown in Figures 2(c) and (f).
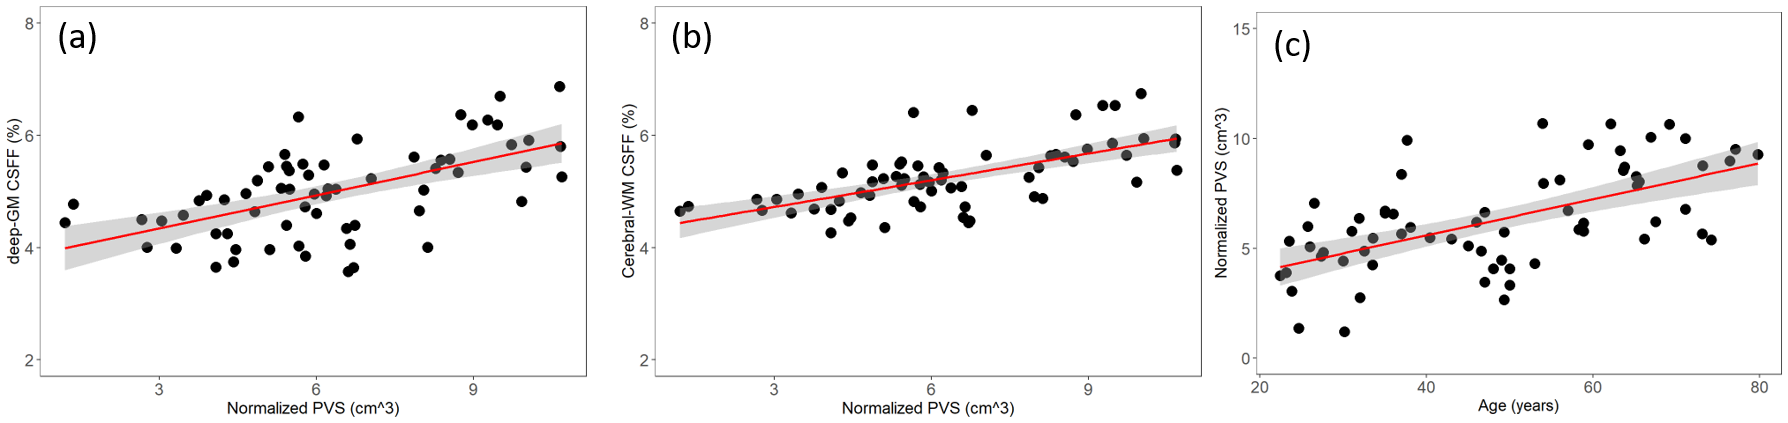
The CSFF is significantly correlated with PVS load in Figure 3 (a) and (b). PVS load is linearly related to age in Figure 3 (c).
Discussion
Brain water components change with normal aging in different patterns. Our results suggest that multi-echo FAST-T2 sequence-based water component maps could be a useful quantitative biomarker of normal aging and a helpful tool to better understand diseases related to dysfunctional water clearance.PVS is considered a key pathway of brain glymphatic clearance. The enlargement of PVS is an indicator of brain water stasis and clearance dysfunction. CSFF maps the free water in PVS in the brain parenchyma and in turn, reflects the total PVS load in the brain, beyond what is visible on T2w. Imaging processing of PVS load by segmentation tools could be biased by image resolution and noise level.
MWF increases and decreases at different time points for adults as has been reported elsewhere, which is confirmed by our results in Figure 2 (b) and (e).7,8
IEWF decreases with age in Figure 2 (c) and (f) and could be explained by brain atrophy and dehydration during normal aging. More experiments should be conducted to confirm the mechanism of intra-extracellular water changes during aging.
Conclusion
We describe the brain water components, CSFF, MWF, and IEWF, change with normal aging across the adult lifespan. The normal aging water component pattern could be helpful to understand many glymphatic clearance-related diseases, including neurodegenerative (e.g., AD/RD) and neuroinflammatory diseases (e.g. MS).Acknowledgements
This study is supported by NIH grant R01AG057848, R01AG068398, RF1AG057570 and R56AG058913.References
1. Kimelberg HK. Water homeostasis in the brain: Basic concepts. Neuroscience. 2004;129(4):851-860. doi:10.1016/j.neuroscience.2004.07.033
2. Min R, van der Knaap MS. Genetic defects disrupting glial ion and water homeostasis in the brain. Brain Pathology. 2018;28(3):372-387. doi:10.1111/bpa.12602
3. Nguyen TD, Deh K, Monohan E, et al. Feasibility and reproducibility of whole brain myelin water mapping in 4 minutes using fast acquisition with spiral trajectory and adiabatic T2prep (FAST-T2) at 3T. Magn Reson Med. 2016;76(2):456-465. doi:10.1002/mrm.25877
4. Lancaster JL, Andrews T, Hardies LJ, Dodd S, Fox PT. Three-pool model of white matter. J Magn Reson Imaging. 2003;17(1):1-10. doi:10.1002/jmri.10230
5. Benveniste H, Liu X, Koundal S, Sanggaard S, Lee H, Wardlaw J. The Glymphatic System and Waste Clearance with Brain Aging: A Review. GER. 2019;65(2):106-119. doi:10.1159/000490349
6. Zhou, Liangdong, Nguyen TD, Li, Yi. MRI-based parenchyma CSF fraction (CSFF) mapping is a potential biomarker of brain drainage function: a multimodal imaging study. Proc Intl Soc Mag Reson Med. 2022;30.
7. Dvorak AV, Swift-LaPointe T, Vavasour IM, et al. An atlas for human brain myelin content throughout the adult life span. Sci Rep. 2021;11:269. doi:10.1038/s41598-020-79540-3
8. Faizy, T.D., Kumar, D., Broocks, G. et al. Age-Related Measurements of the Myelin Water Fraction derived from 3D multi-echo GRASE reflect Myelin Content of the Cerebral White Matter. Sci Rep 8, 14991 (2018).
Figures