2998
Quantitative volumetric mapping of intracellular pH in the human brain at 7 T using endogenous CEST-MRI: A proof of principle study1Division of Medical Physics in Radiology, German Cancer Research Center (DKFZ), Heidelberg, Germany, 2Faculty of Physics and Astronomy, University of Heidelberg, Heidelberg, Germany, 3Faculty of Medicine, University of Heidelberg, Heidelberg, Germany
Synopsis
Keywords: CEST & MT, Molecular Imaging, intracellular pH, guanidyl protons, 7 Tesla
In this study, our method for quantitative pHi mapping using endogenous CEST-MRI was successfully transferred to examinations of the human brain at B0=7T. Applicability in vivo was demonstrated in n=3 healthy volunteers, showing an overall median pHi,CEST of 7.00 and 6.96 for gray and white matter, respectively. In order to proof the plausibility of the presented approach, the obtained pHi,CEST maps were additionally validated directly in vivo via 31P MRSI at 7T, showing an overall median pHi,31P of 7.02 and 7.01 for gray and white matter, respectively. Consequently, reliable CEST-based pHi mapping is now also possible in the human brain.
Introduction
Intracellular pH (pHi) is known to be increased in tumors and therefore a valuable biomarker for the assessment of cancer.1 Recently, we demonstrated that quantitative mapping of pHi in tumors in vivo is feasible in a preclinical setting using a combination of the endogenous amide (Δω=3.5ppm) and guanidyl (Δω=2.0ppm) CEST signals with a cw presaturation at B0=9.4T2,3. Moreover, we refined the method and demonstrated that employing a pulsed presaturation allows for reliable calculation of pH maps within the entire physiologically relevant range (i.e. 6.5–7.5) using only the guanidyl signal2–4.Therefore, the purpose of this study was (i) to translate the method for application in humans and (ii) to demonstrate the feasibility of quantitative pHi mapping in the human brain using pulsed CEST-MRI at 7T. In order to proof the plausibility of the pHi values obtained via CEST-MRI (pHi,CEST), the n=3 healthy volunteers were additionally examined via 31P MRSI at 7T to obtain reference pHi maps (pHi,31P).
Methods
Healthy volunteers (n=3, 24.3±3.2 years) were examined using a 7T whole-body MR scanner (Siemens Healthineers, MAGNETOM) and a 24-channel transmit/receive head coil (Nova Medical).For CEST-based mapping of pHi, the methodology of Boyd et al.2–4 was used, i.e. $$$pH=log_{10}\left[\frac{k_{ex}}{k_c}\right]$$$ [Eq.1], with the exchange rate kex and the exchange rate characterizing constant kc. The method was optimized for human scanners with B0=7T using (i) the previous calibration of kc = 53.2 µHz for guanidyl protons2,3 and (ii) a pulsed presaturation5 (Gaussian-shaped pulses, here with form factor c2=0.6171), thus shifting the pH sensitivity of guanidyl protons to the relevant range in vivo3,4.
For image acquisition, the 3D-Snapshot-CEST6 sequence was used (resolution=2.75×2.75×5mm³, matrix=80×64×12). Three CEST scans (B1=0.4, 0.6 and 0.8µT, tsat=3.74s, 40 offsets, tacq=3:57min/B1) and one WASABI7 scan for mapping of B0- and B1-inhomogeneities were acquired. The postprocessing steps were: (i) image co-registration8, (ii) correction for B0-inhomogeneities, (iii) denoising9, (iv) fitting of Z-spectra (Figure 1, 4-pool Lorentzian; DS, ssMT, amide and guanidyl), (v) contrast calculation via the relaxation-compensated inverse metric10–12 $$$MTR_{Rex}=\frac{1}{Z_{lab}(\Delta\omega)}-\frac{1}{Z_{ref}(\Delta\omega)}$$$ and (vi) contrast-B1-correction13.
Gray matter (GM) and white matter (WM) regions of interest (ROIs) were automatically segmented on an additionally acquired T1w anatomical image using SPM14 and re-scaled to match the resolution of the CEST measurements (Figure 2, rows 1–3).
To obtain reference pHi values, 31P MRSI at 7T was performed as described in Korzowski et al.15 (resolution=12.5x12.5x12.5mm³, matrix=20×24×16, tacq=51min, 32-channel 31P/1H head coil), and the obtained pHi,31P maps were mapped and re-scaled to match the resolution of the pHi,CEST maps (cf. Figure 2, fourth and bottom row).
Results
The quality of obtained Z-spectra and corresponding fits was sufficient to reliably extract the guanidyl resonance in GM and WM at multiple B1 (Figure 1), thus allowing to calculate quantitative pHi,CEST maps in all volunteers (Figure 2, fourth row).In the pHi,CEST maps, physiologically plausible pHi values of approximately 7.0 were obtained exhibiting slight regional differences (Figure 2, fourth row), which were also present in the pHi,31P maps with same regional tendencies (Figure 2, bottom row, in particular volunteers 1 and 3).
The ROI analysis showed, that the median pHi,CEST values of GM were consistently higher compared to WM, which was confirmed by 31P MRSI (Figure 3). For pHi,CEST, the GM/WM median ROI values were 6.99/6.95, 6.96/6.94, 7.05/6.97 for volunteers 1-3, respectively. For pHi,31P, the GM/WM median ROI values were 7.01/7.00, 7.04/7.03, 7.02/7.01 for volunteers 1-3, respectively.
Discussion
In general, the obtained values of pHi,CEST and pHi,31P were in good agreement with each other (Figure 3) as well as literature15, thus demonstrating the feasibility of quantitative pHi,CEST mapping in the human brain using the whole-body MR scanners. The broader variability of pHi,CEST can be explained by potential instabilities in precisely extracting the exchange rate kex, which is used to calculate pH via (Eq.1). However, this can be easily compensated by acquisition of additional CEST-scans at more B1 amplitudes, without adding significantly more time (3:57min/B1).A slight mismatch was observed between the obtained median pHi,CEST and pHi,31P values (Figure 3, compare rows). Importantly, however, the median pHi,CEST ROI values of GM and WM, respectively, exhibited the same tendencies as the median pHi,31P ROI values across all volunteers (Figure 3, compare vertical lines).
In addition, the pHi,CEST and pHi,31P maps also exhibited similar regional tendencies of varying pHi which, in particular, was visible for volunteers 1 and 3 (Figure 2, compare fourth and bottom row), further supporting the validity of the proposed approach.
Finally, to further assess the specificity of the proposed method, pHi,CEST will be applied to ongoing tumor patient studies.
Conclusion
In this study, our method for quantitative CEST-based pHi mapping (pHi,CEST) was successfully transferred to examinations of the human brain at 7T. Applicability in vivo was demonstrated in n=3 healthy volunteers showing an overall median pHi,CEST of approximately 7.00 and 6.96 compared to an overall median pHi,31P of approximately 7.02 and 7.01 for GM and WM, respectively. Importantly, pHi values were validated directly in vivo via 31P MRSI, demonstrating reliable calculation of pHi,CEST maps in the human brain.In the future, the proposed method might enable the quantitative assessment of pHi in patients with glioma and thus provide further physiological insights.
Acknowledgements
We cordially thank the German Research Foundation (DFG project number: 445704496) for the financial support.References
1. Webb BA, Chimenti M, Jacobson MP, et al. Dysregulated pH: a perfect storm for cancer progression. Nat Rev Cancer. 2011;11:671–677.
2. Boyd PS, Breitling J, Korzowski A, et al. Mapping intracellular pH in tumors using amide and guanidyl CEST-MRI at 9.4 T. Magn Reson Med. 2022;87:2436–2452.
3. Boyd PS. Mapping intracellular pH of tumors in vivo using CEST-MRI: methodological development and preclinical investigation. Dissertation; University of Heidelberg 2022. DOI: 10.11588/heidok.00032083.
4. Boyd PS, Diederichs L, Breitling J, et al. Presaturation pulse shape enables shifting the pH sensitivity of guanidyl CEST-MRI for absolute pH mapping at 9.4 T. Proc 31th Annu Meet Int Soc Magn Reson Med.;Abstract #2803.
5. Meissner J-E, Goerke S, Rerich E, et al. Quantitative pulsed CEST-MRI using Ω-plots. NMR Biomed. 2015;28:1196–1208.
6. Zaiss M, Ehses P, Scheffler K. Snapshot-CEST: Optimizing spiral-centric-reordered gradient echo acquisition for fast and robust 3D CEST MRI at 9.4 T. NMR Biomed. 2018;31:e3879.
7. Schuenke P, Windschuh J, Roeloffs V, et al. Simultaneous Mapping of Water Shift and B1 (WASABI)—Application to Field-Inhomogeneity Correction of CEST MRI Data. Magn Reson Med. 2017;77:571–580.
8. Breitling J, Korzowski A, Kempa N, et al. Motion correction for three-dimensional chemical exchange saturation transfer imaging without direct water saturation artifacts. NMR Biomed. 2022;35:e4720.
9. Breitling J, Deshmane A, Goerke S, et al. Adaptive denoising for chemical exchange saturation transfer MR imaging. NMR Biomed. 2019;32:e4133.
10. Zaiss M, Xu J, Goerke S, et al. Inverse Z-spectrum analysis for spillover-, MT-, and T1-corrected steady-state pulsed CEST-MRI – application to pH-weighted MRI of acute stroke. NMR Biomed. 2014;27:240–252.
11. Zaiss M, Bachert P. Chemical exchange saturation transfer (CEST) and MR Z-spectroscopy in vivo: a review of theoretical approaches and methods. Phys Med Biol. 2013;58:R221–R269.
12. Zaiss M, Bachert P. Exchange-dependent relaxation in the rotating frame for slow and intermediate exchange – modeling off-resonant spin-lock and chemical exchange saturation transfer. NMR Biomed. 2013;26:507–518.
13. Windschuh J, Zaiss M, Meissner J-E, et al. Correction of B1-inhomogeneities for relaxation-compensated CEST imaging at 7 T. NMR Biomed. 2015;28:529–537.
14. Ashburner J, Friston KJ. Unified segmentation. NeuroImage. 2005;26:839–851.
15. Korzowski A, Weinfurtner N, Mueller S, et al. Volumetric mapping of intra- and extracellular pH in the human brain using 31P MRSI at 7T. Magn Reson Med. 2020;84:1707–1723.
Figures
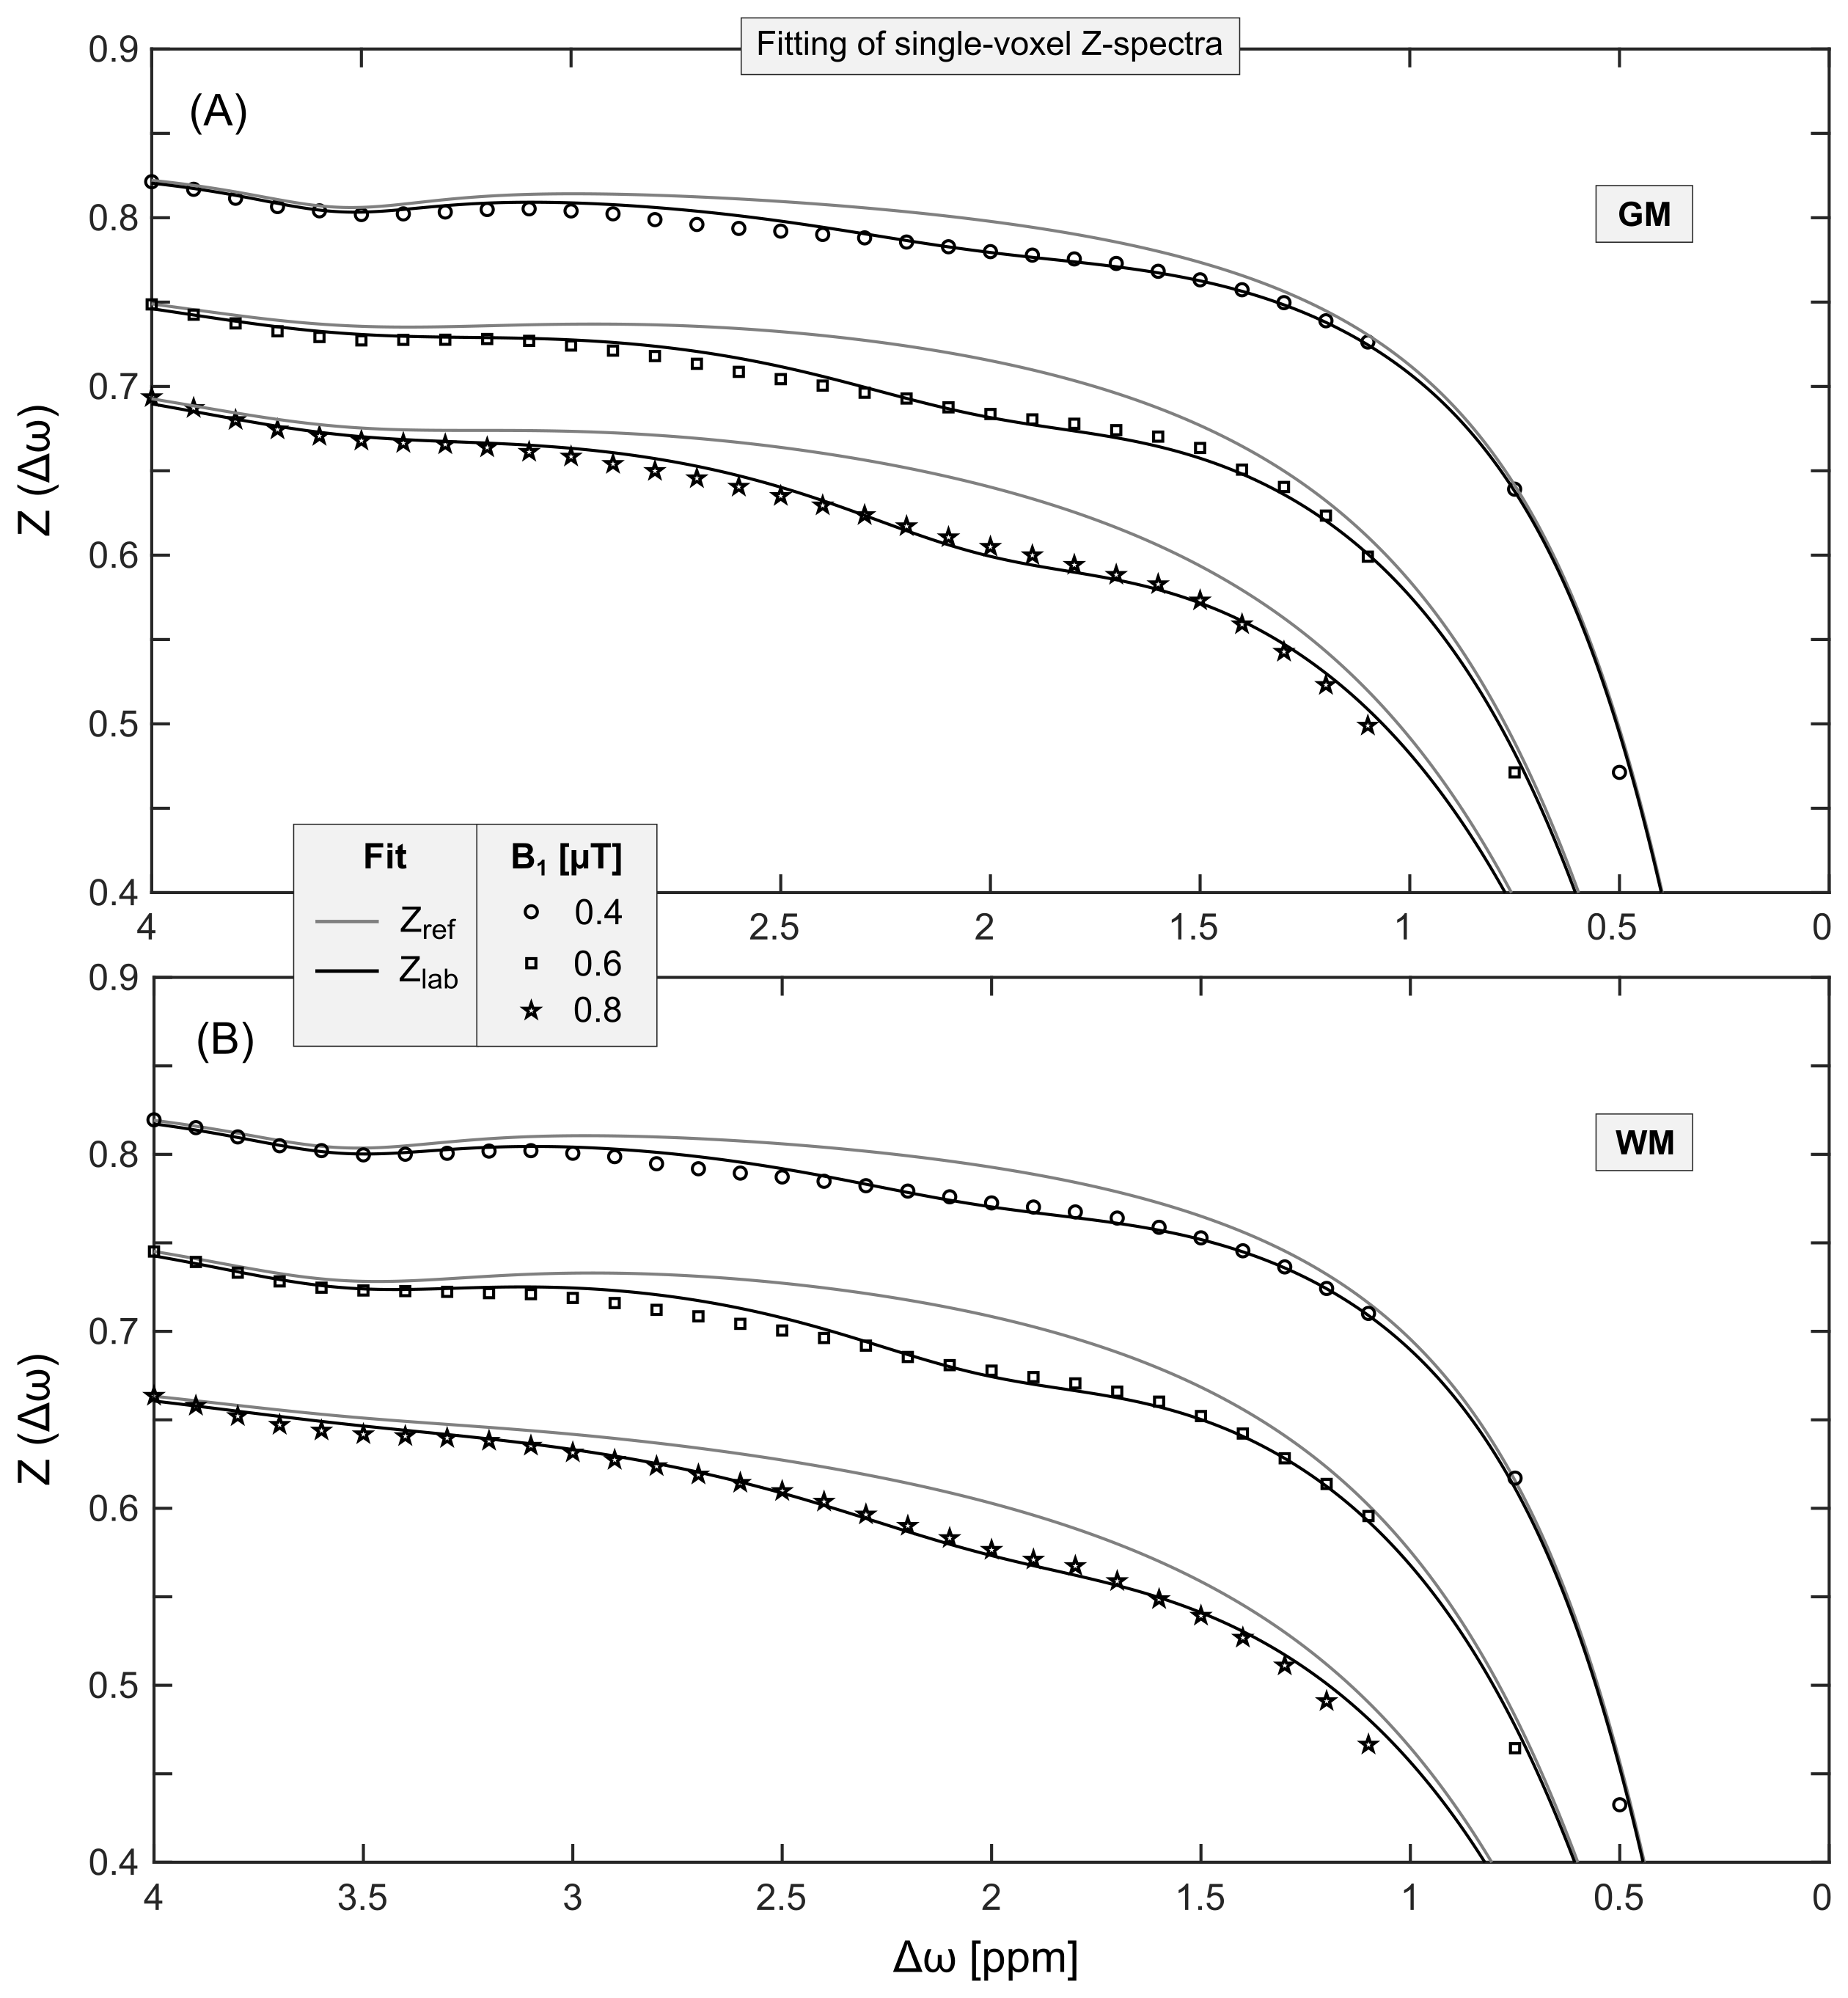
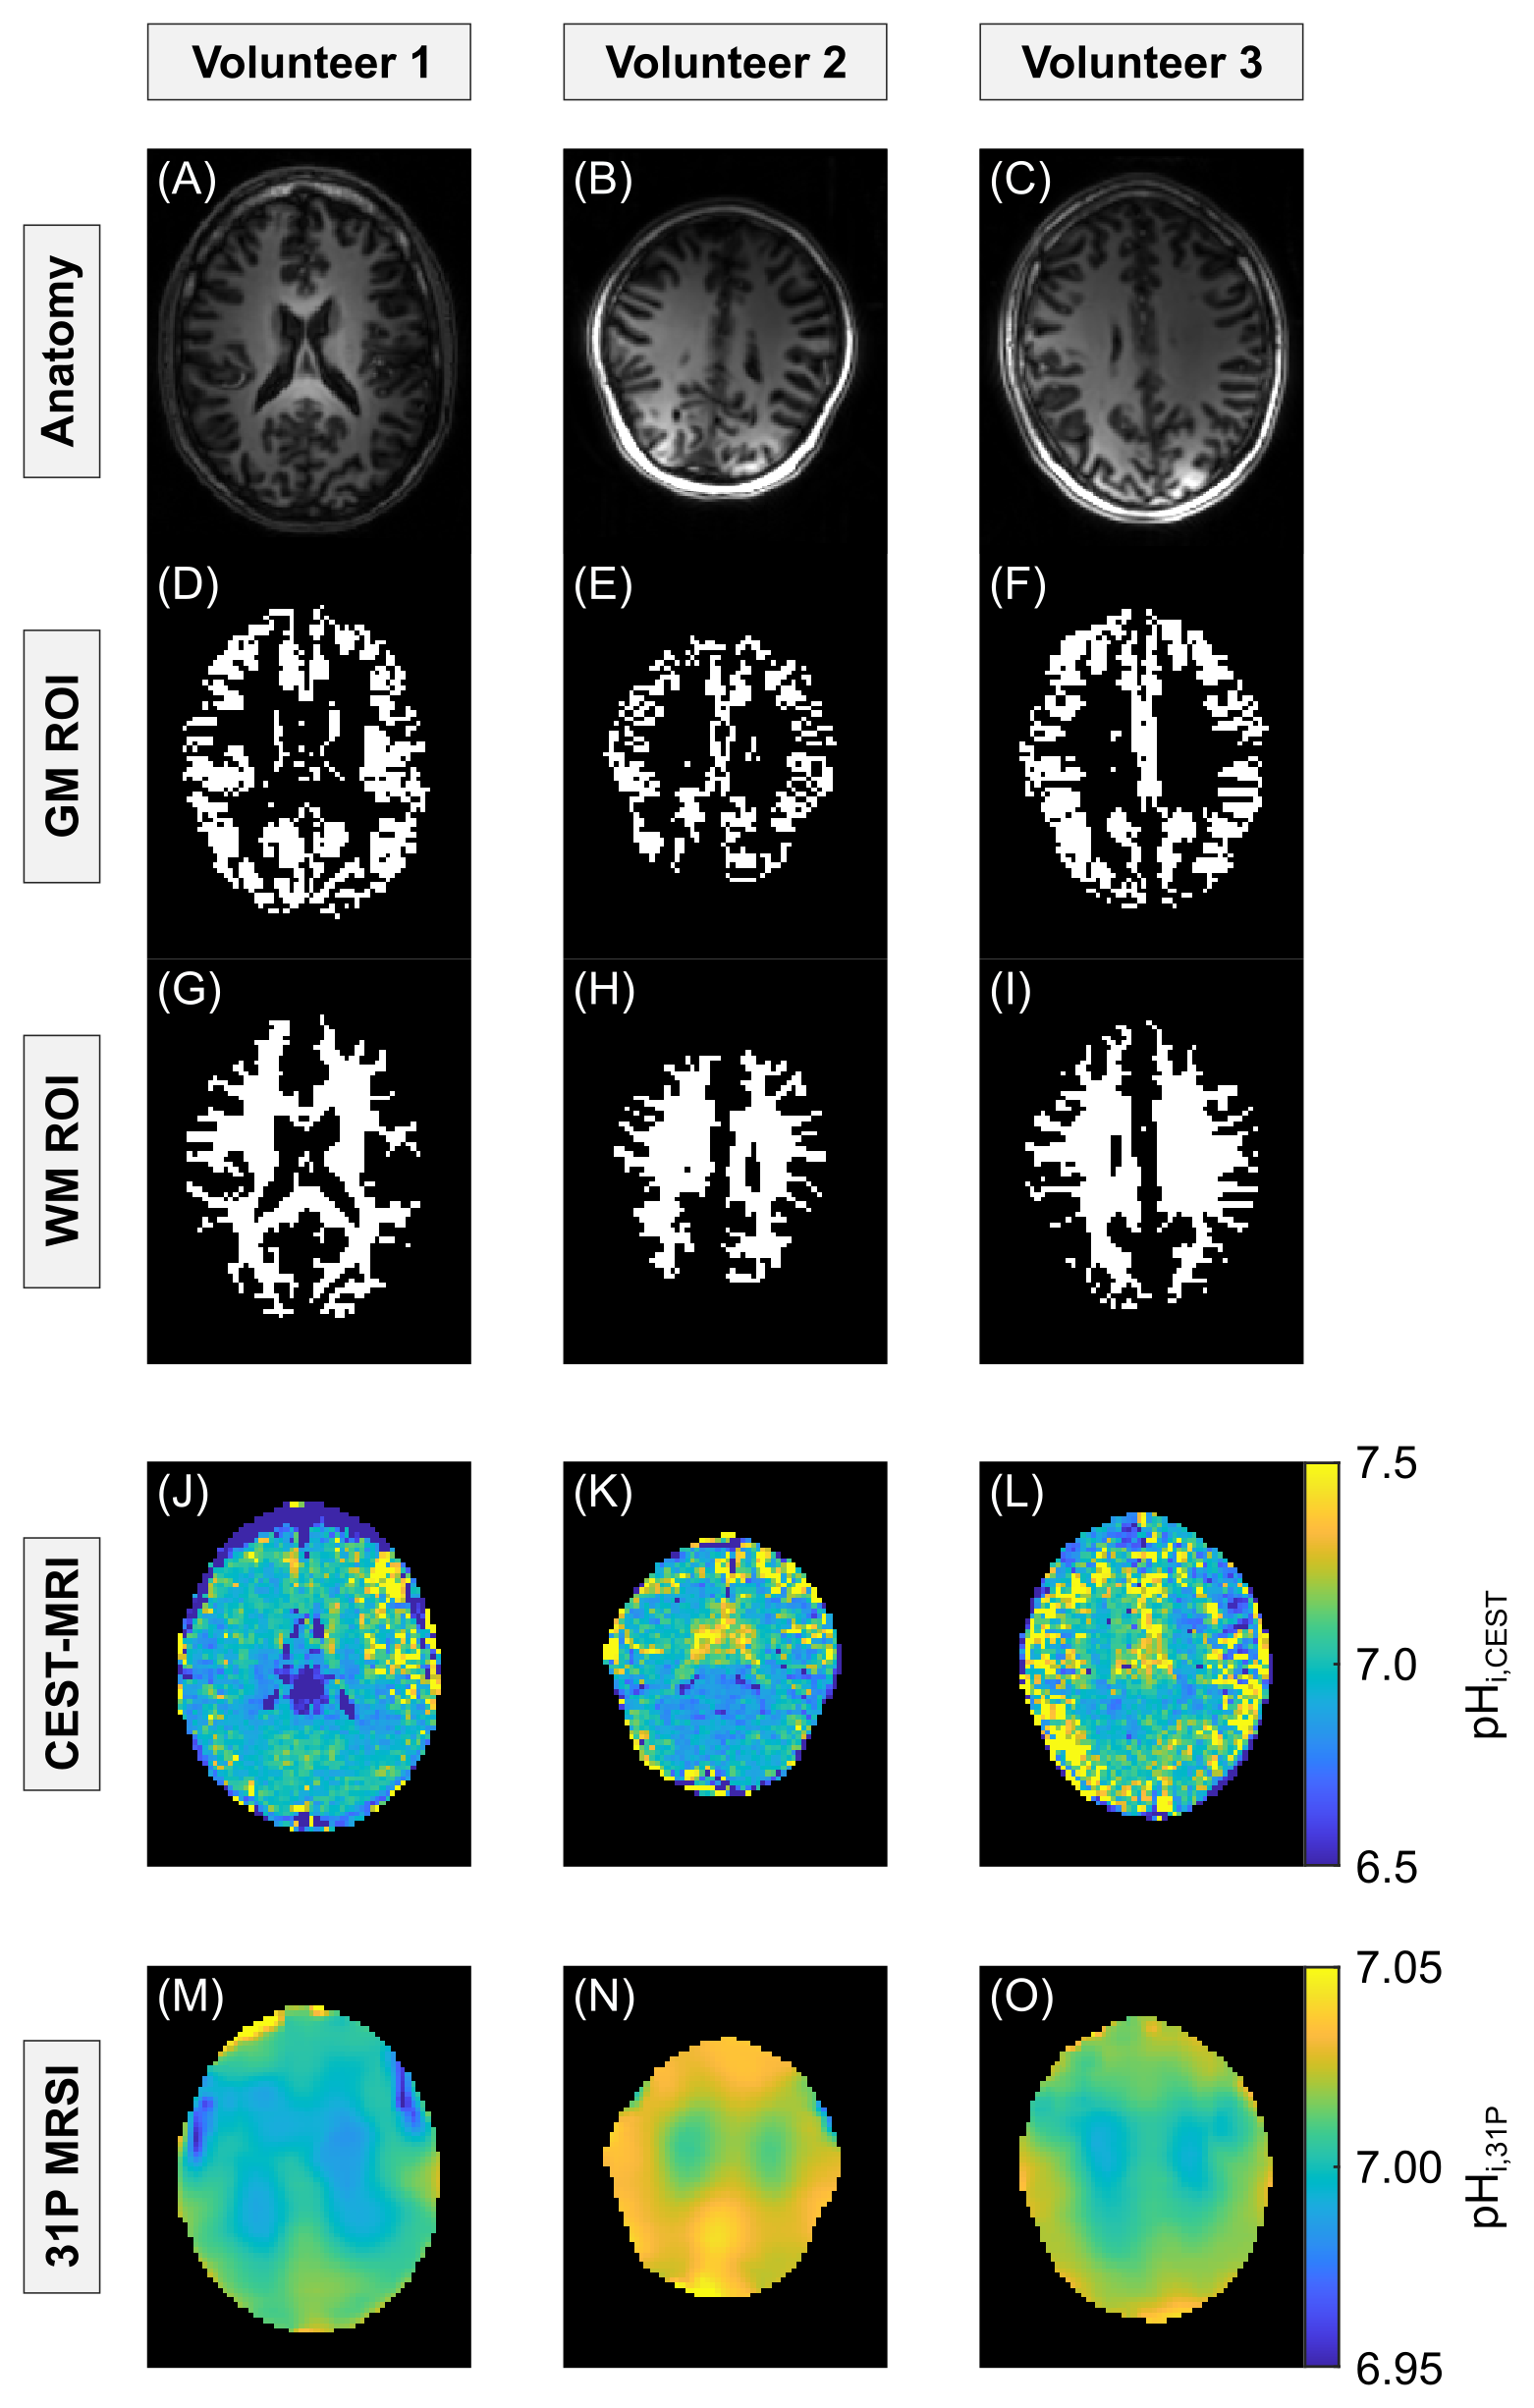
Figure 2: Anatomy (top row) with corresponding GM and WM ROIs (second and third row, respectively) shown for n = 3 healthy volunteers (columns; CEST-slice 8/12, 7/12 and 6/12, respectively). The pHi maps obtained from CEST-MRI (pHi,CEST, fourth row) and 31P MRSI (pHi,31P, bottom row) exhibit the same regional tendencies of lower and higher pHi. The pHi,31P maps were re-scaled to match the nominal resolution of the pHi,CEST maps. Note the different scaling for pHi,CEST and pHi,31P maps.
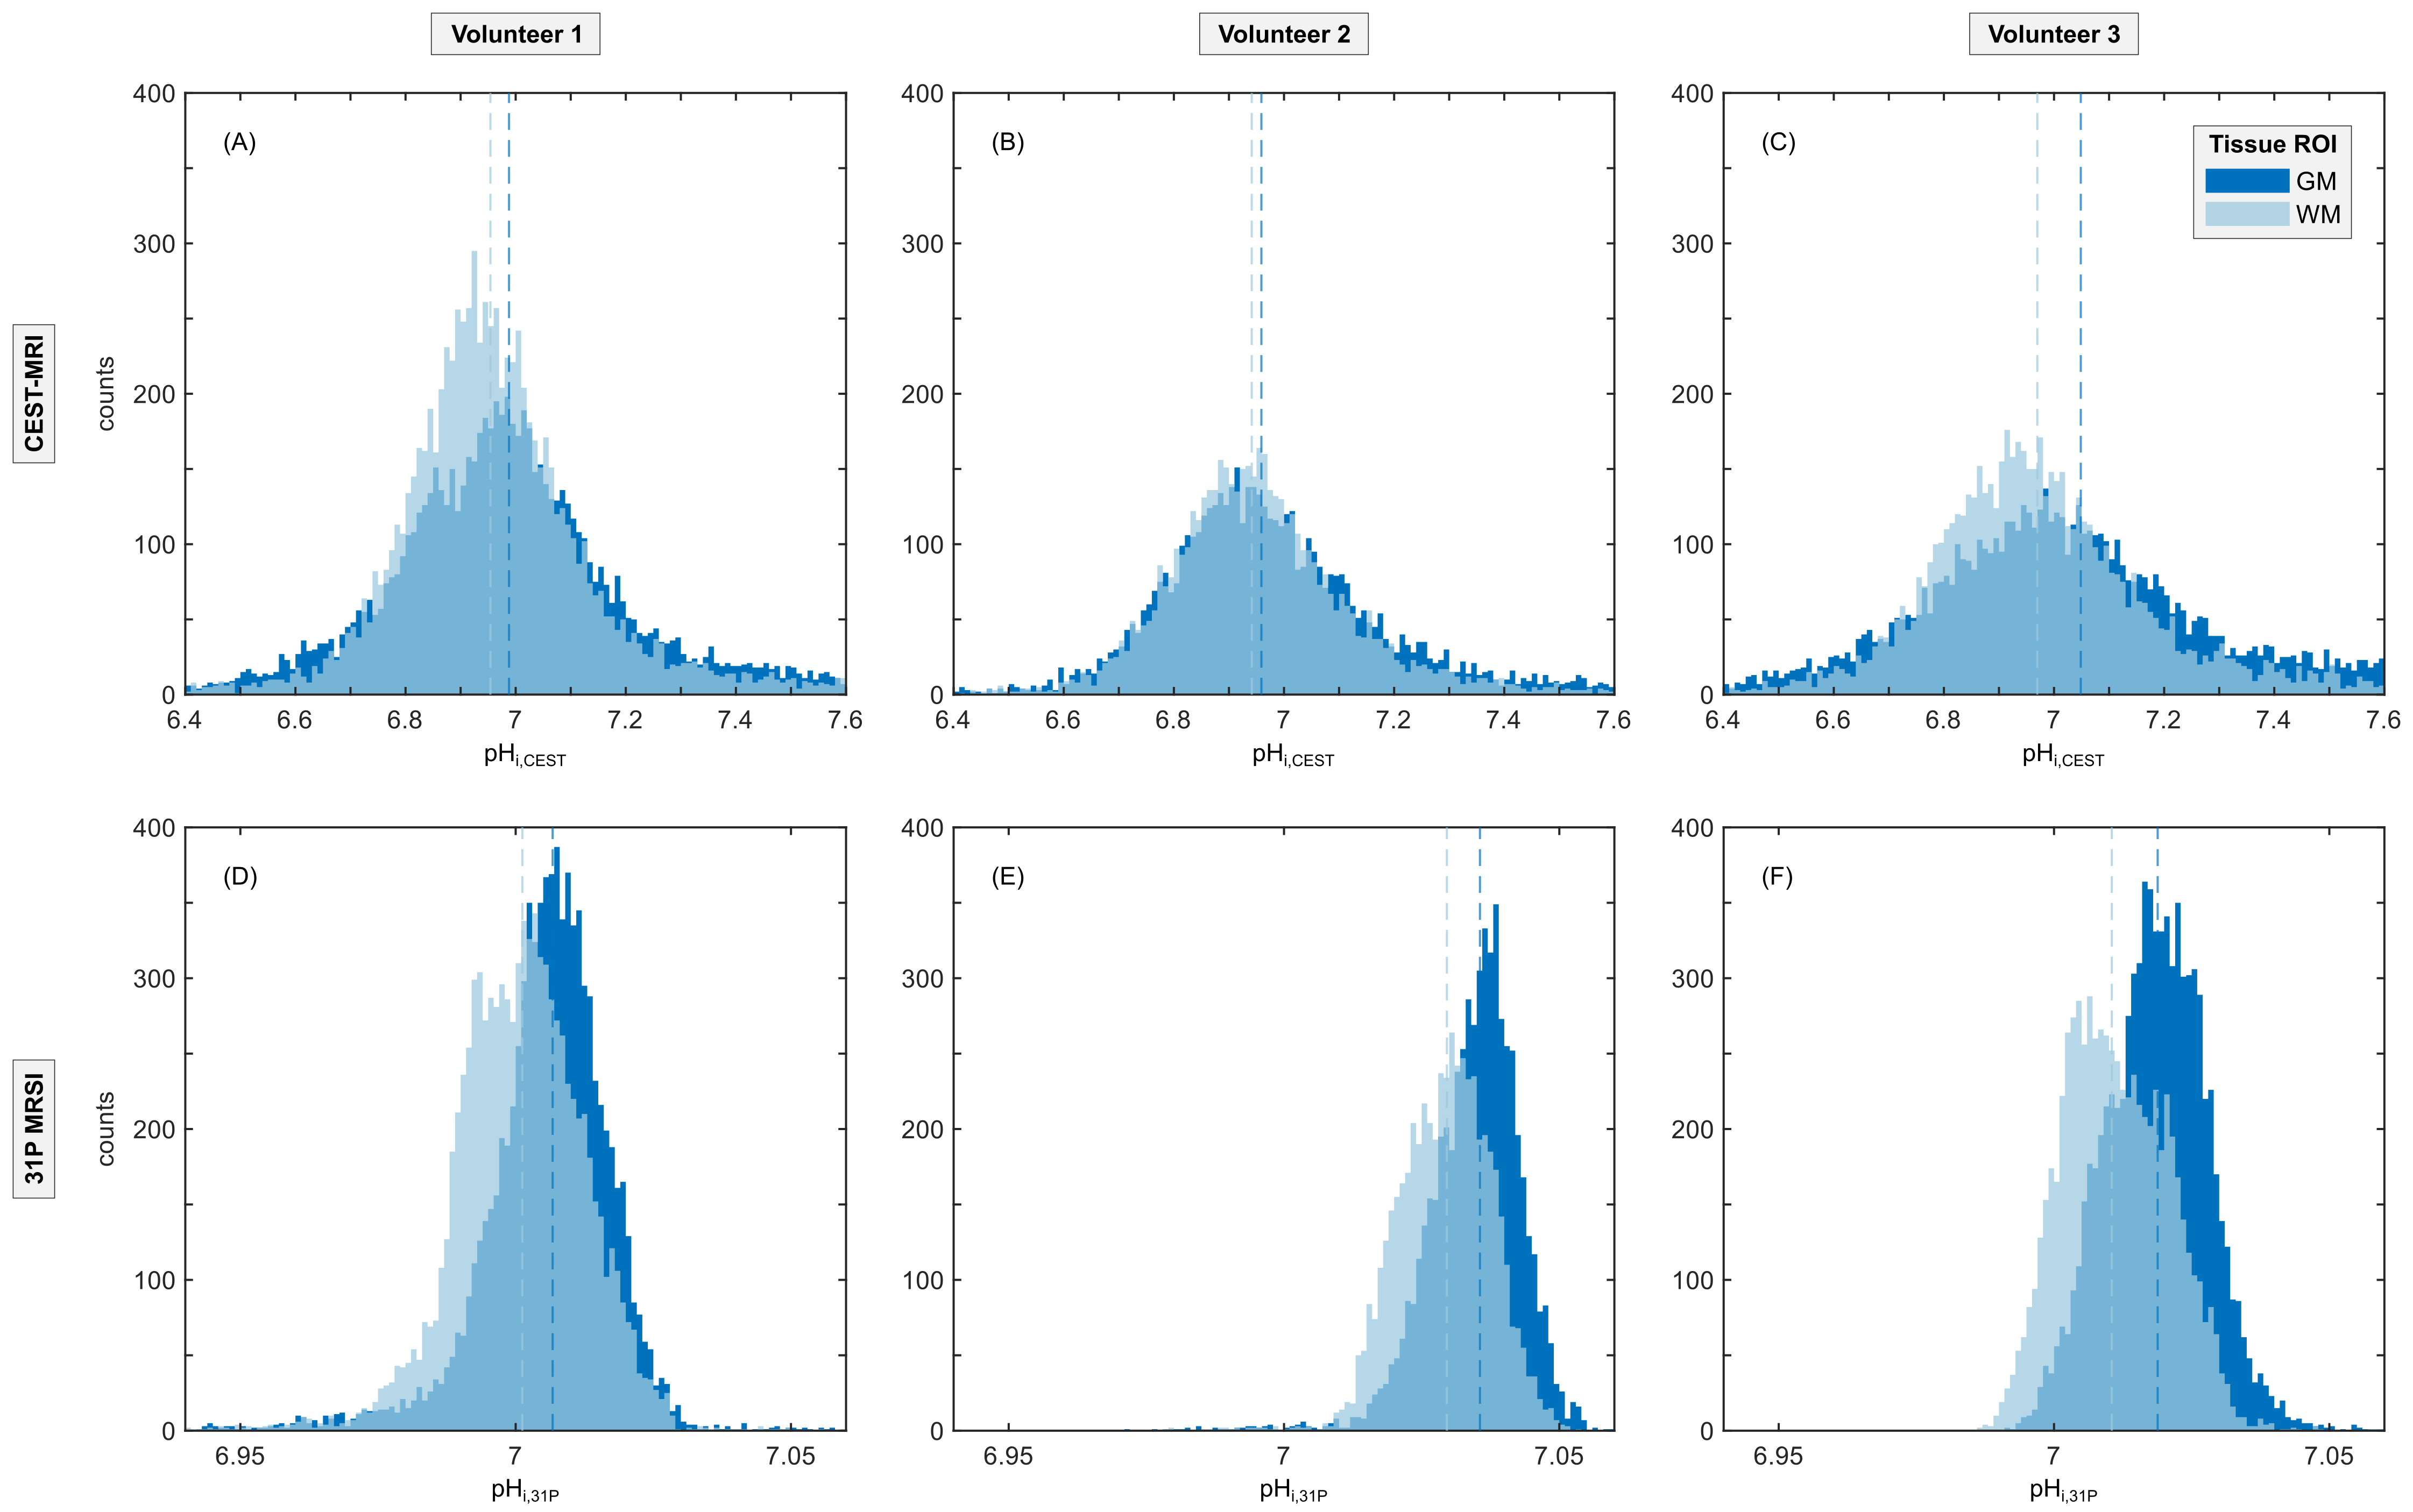
Figure 3: ROI analysis of GM (dark blue) and WM (light blue) shown for n = 3 healthy volunteers (columns). The pHi,CEST and pHi,31P values (top and bottom row, respectively) exhibit the same tendencies with pHi,GM > pHi,WM as depicted by the median ROI values (vertical dashed lines). Note the different scaling of the pHi axes. For each volunteer and tissue ROI, respectively, the ROI analysis was only performed using slices in which ROIs could be appropriately obtained (CEST-slices 3–11 of 12).