2996
Imaging treatment efficacy of repeated photodynamic therapy in glioblastoma using CEST MRI1Department of Biomedical Engineering, City University of Hong Kong, Hong Kong, China, 2Hong Kong Centre for Cerebro-Cardiovascular Health Engineering (COCHE), Hong Kong, China, 3Incando Therapeutics Pte Ltd, Singapore, Singapore, 4Russell H. Morgan Department of Radiology and Radiological Science, The Johns Hopkins University School of Medicine, Baltimore, MD, United States, 5City University of Hong Kong Shenzhen Research Institute, Shenzhen, China, 6Tung Biomedical Sciences Centre, City University of Hong Kong, Hong Kong, China
Synopsis
Keywords: CEST & MT, Tumor
Glioblastoma (GBM) is hard to treat and has poor prognosis. Photodynamic therapy (PDT) is a promising treatment for GBM. Here, we detect the treatment efficacies of different PDT schemes (repeated (re-) and single (s-) PDT) on a rodent model of GBM using CEST MRI to monitor the molecular changes associated with tumor physiology and necrosis. Significant decreases in APT and rNOE signals were detected in the rePDT group as well as decreased proliferative activities in histology when compared with sPDT. This indicates that both APT and rNOE can be a reliable approach to assess PDT treatment efficacy against GBM.
Introduction
Glioblastoma (GBM) is the most prevalent and aggressive form of astrocytoma1. One major challenge is in the lack of non-invasive imaging approaches to assess the treatment responses at the molecular level, since conventional MRI only reveals changes in tumor sizes. Secondly, the acute molecular effects of photodynamic therapy (PDT), a potential treatment for GBM with promising clinical evidence1, has not been explored. Chemical Exchange Saturation Transfer (CEST)MRI has shown promises in the identification of tumor recurrency from radiation necrosis based on CEST signals at 3.5 and -3.5ppm2-9, which represent amide proton transfer (APT) and relayed nuclear Overhauser enhancement (rNOE), respectively. The APT signal predominantly indicates changes in amide protons of mobile peptides and proteins, while rNOE predominantly indicates changes in aliphatic protons of mobile proteins and lipids4. Increases in APT and rNOE signals positively correlates to tumor progression3,5-7, while a decrease in APT and rNOE signals corresponds to positive treatment response8 and tumor necrosis9, respectively. Here, we demonstrated the use of CEST as a unique MRI approach to detect and quantify the treatment effects of PDT non-invasively, in particular evaluated the treatment efficacies of single-dose application (sPDT) and repeated applications (rePDT). With the non-invasive longitudinal assessment of PDT with CEST, evidence is generated to further support clinical applications of rePDT as an efficacious treatment for GBM.Methods
Nineteen NSG mice (6-8 weeks, 13 male and 6 female) were used. A 10μl Hamilton syringe (26G) was used to inject U87-MG cells (0.5M/ 3μl) at 0.2mm anterior, 2.0mm right lateral and 3.8mm below the bregma. Mice were divided into rePDT, sPDT and control groups. Mice in the rePDT group were subjected to four PDT sessions and the sPDT group to one single PDT session, each administered with 250mg/kg of 5-aminolevulinic acid (ALA) 6 hours prior to each session. A 630nm LED light was used to effectuate PDT, with each session lasting for one hour. T2-weighted (T2W) and CEST MRI data were acquired at approximately 24 hours after each PDT session. Schematics of the experiment are shown in Figure 1. MRI was performed using 3T Bruker Biospec system (Bruker, Ettlingen, Germany). T2W images were acquired using the rapid acquisition with relaxation enhancement (RARE) sequence (TR= 2000ms; TE= 97.05ms; RARE factor= 16; FOV= 20 × 20mm; image size = 256 × 256) to determine tumor location. Slice thickness of 1mm and B1 power of 0.8μT was selected for CEST imaging. H&E and Ki67 histological staining were assessed to validate observations in CEST. No Day 7 data from the control group was obtained as all tumors had reached ethical limits after Day 5 and the animals were euthanized. Hence Day 0-5 and Day 7 data of treatment groups were separately compared.Results and Discussion
APT at 3.5ppm decreased by 8.7% and rNOE at -3.5ppm decreased by 10.5% in the rePDT group from Day 3 onwards which were significantly lower when compared to baseline (P<0.05; Day 0; Fig. 2D). In the sPDT group, these CEST signals decreased slightly at Day 1, then recovered to near baseline level longitudinally (Fig. 2D). Among the three groups of mice, we observed a significant decrease in both APT and rNOE (P<0.05) between rePDT and control at Day 3 onwards, which corresponds to a 11.9% and 12% decrease, respectively. Significant differences in APT and rNOE between rePDT and sPDT were consistent at Day 5 and Day 7 (P<0.05). No substantial difference was observed between control and sPDT.APT signal has been shown to reflect endogenous mobile proteins and peptides specifically involved in tumor proliferation10. Hence, a decrease in APT signal indicates treatment efficacy in suppressing tumor progression. The observed decrease of APT signal in rePDT was validated with Ki67 staining for tumor proliferation (Fig. 3B), where rePDT had the lowest proliferative index. rNOE signals specifically detects lipids and mobile proteins, and a decrease in cellularity during necrosis is associated with a decrease in rNOE signal9. The cellularity was significantly lower in both rePDT and sPDT when compared with control (Fig. 4B). RePDT had less proliferative tumor cells than sPDT, and a lower cellularity than control. Thus, we observed a strong correlation between APT and the number of proliferative cells (r=0.9060, P<0.001), and between rNOE and the number of proliferative cells (r=0.8436, P<0.01; Fig. 3C).
In addition, CEST enables early detection of treatment responses of rePDT since both APT and rNOE decreased substantially at Day 3. When compared to control, tumor size and cell count showed substantial decrease in rePDT (P<0.001, P<0.0001) and sPDT (P<0.05, P<0.01) (Fig. 4B,C). Importantly, while conventional tumor size comparison alone did not differentiate between the sPDT and rePDT groups, CEST analysis was able to quantify significant differences in therapeutic molecular effects between the two treatment modalities. This suggested that APT and rNOE analysis through CEST can be a powerful tool in assessing the therapeutic efficacies of new therapeutic approaches.
Conclusion
RePDT is a promising treatment for GBM, which resulted in more consistent anti-tumor effects than sPDT. Both APT and rNOE could sensitively and non-invasively detect treatment effects at an early stage, correlated with proliferative activity and cellularity, which are valuable information for assessing treatment efficacy.Acknowledgements
Authors would like to thank the funding support from Research Grants Council (11102218, PDFS2122-1S01, 11200422, RFS2223-1S02, C1134-20G); City University of Hong Kong (7005433, 7005626, 9239070, 9609307, 9610560); National Natural Science Foundation China (81871409); Tung Biomedical Sciences Centre; Hong Kong Centre for Cerebro-cardiovascular Health Engineering; Incando Therapeutics Pte Ltd.References
1. Vermandel M, Dupont C, Lecomte F, Leroy HA, Tuleasca C, Mordon S, et al. Standardized intraoperative 5-ALA photodynamic therapy for newly diagnosed glioblastoma patients: a preliminary analysis of the INDYGO clinical trial. J Neurooncol. 2021;152(3):501-14.
2. Zhou J, Tryggestad E, Wen Z, Lal B, Zhou T, Grossman R, et al. Differentiation between glioma and radiation necrosis using molecular magnetic resonance imaging of endogenous proteins and peptides. Nat Med. 2011;17(1):130-4.
3. Huang J, Chen Z, Park SW, Lai JHC, Chan KWY. Molecular Imaging of Brain Tumors and Drug Delivery Using CEST MRI: Promises and Challenges. Pharmaceutics. 2022;14(2).
4. Desmond KL, Moosvi F, Stanisz GJ. Mapping of amide, amine, and aliphatic peaks in the CEST spectra of murine xenografts at 7 T. Magn Reson Med. 2014;71(5):1841-53.
5. Su C, Liu C, Zhao L, Jiang J, Zhang J, Li S, et al. Amide Proton Transfer Imaging Allows Detection of Glioma Grades and Tumor Proliferation: Comparison with Ki-67 Expression and Proton MR Spectroscopy Imaging. AJNR Am J Neuroradiol. 2017;38(9):1702-9.
6. Su C, Xu S, Lin D, He H, Chen Z, Damen FC, et al. Multi-parametric Z-spectral MRI may have a good performance for glioma stratification in clinical patients. Eur Radiol. 2022;32(1):101-11.
7. Regnery S, Adeberg S, Dreher C, Oberhollenzer J, Meissner JE, Goerke S, et al. Chemical exchange saturation transfer MRI serves as predictor of early progression in glioblastoma patients. Oncotarget. 2018;9(47):28772-83.
8. Dula AN, Arlinghaus LR, Dortch RD, Dewey BE, Whisenant JG, Ayers GD, et al. Amide proton transfer imaging of the breast at 3 T: establishing reproducibility and possible feasibility assessing chemotherapy response. Magn Reson Med. 2013;70(1):216-24.
9. Zaiss M, Windschuh J, Paech D, Meissner JE, Burth S, Schmitt B, et al. Relaxation-compensated CEST-MRI of the human brain at 7T: Unbiased insight into NOE and amide signal changes in human glioblastoma. Neuroimage. 2015;112:180-8.
10. Sagiyama K, Mashimo T, Togao O, Vemireddy V, Hatanpaa KJ, Maher EA, et al. In vivo chemical exchange saturation transfer imaging allows early detection of a therapeutic response in glioblastoma. Proc Natl Acad Sci U S A. 2014;111(12):4542-7.
Figures
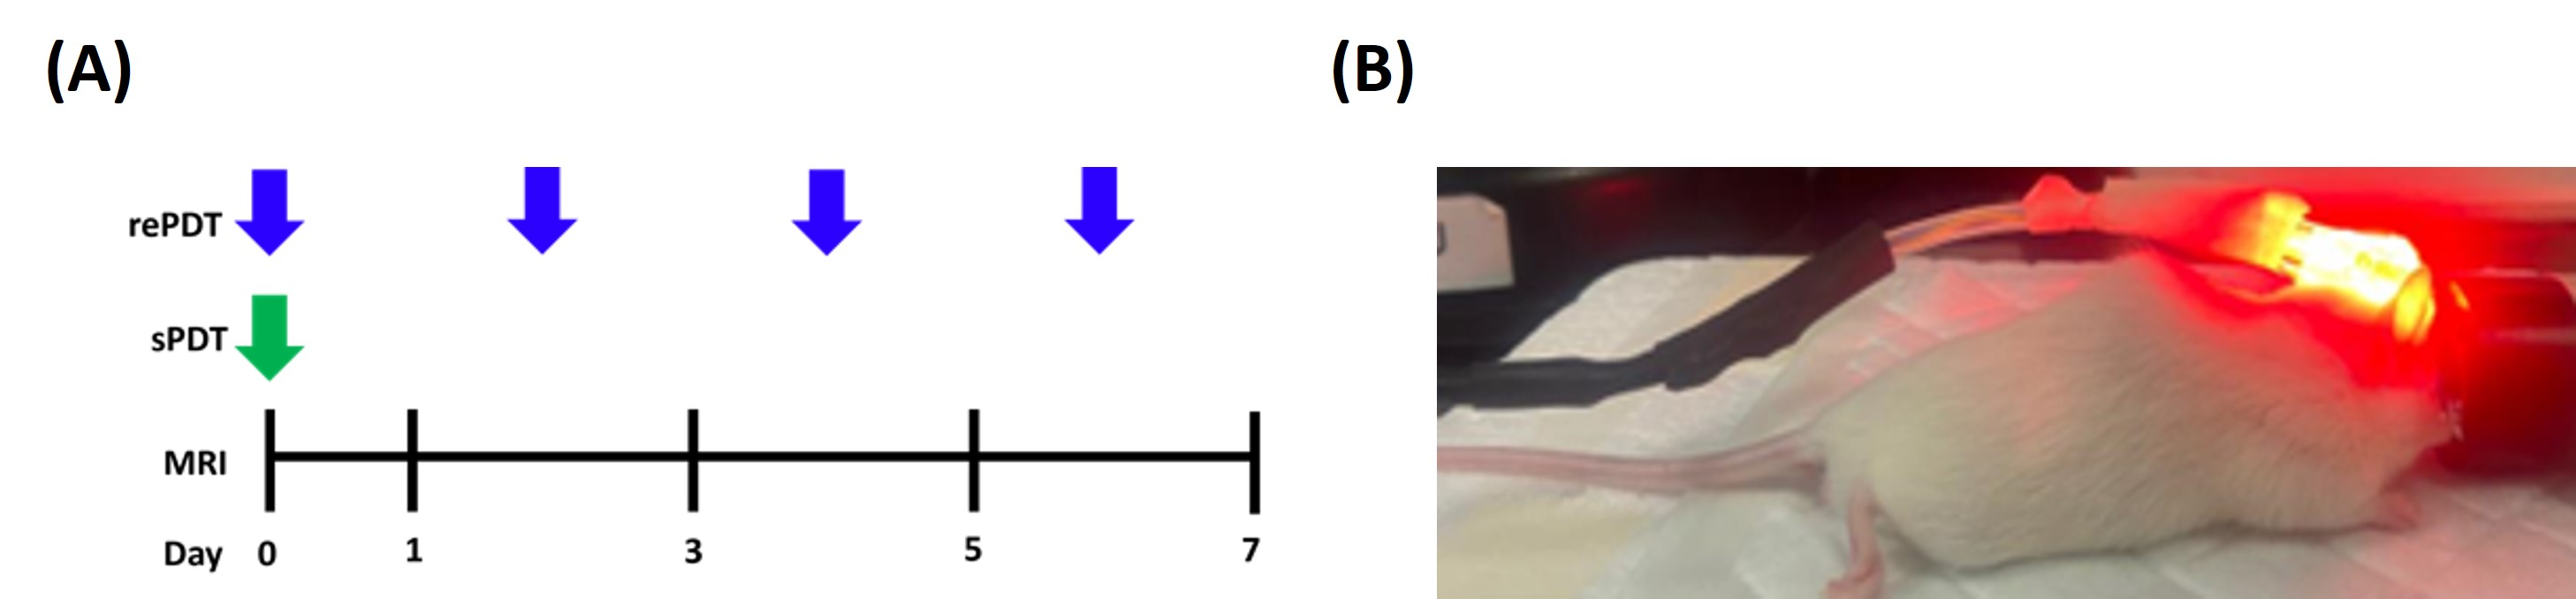
Figure 1 (A) Experimental timeline of control, sPDT and rePDT groups. (B) Demonstration of an animal undergoing PDT.
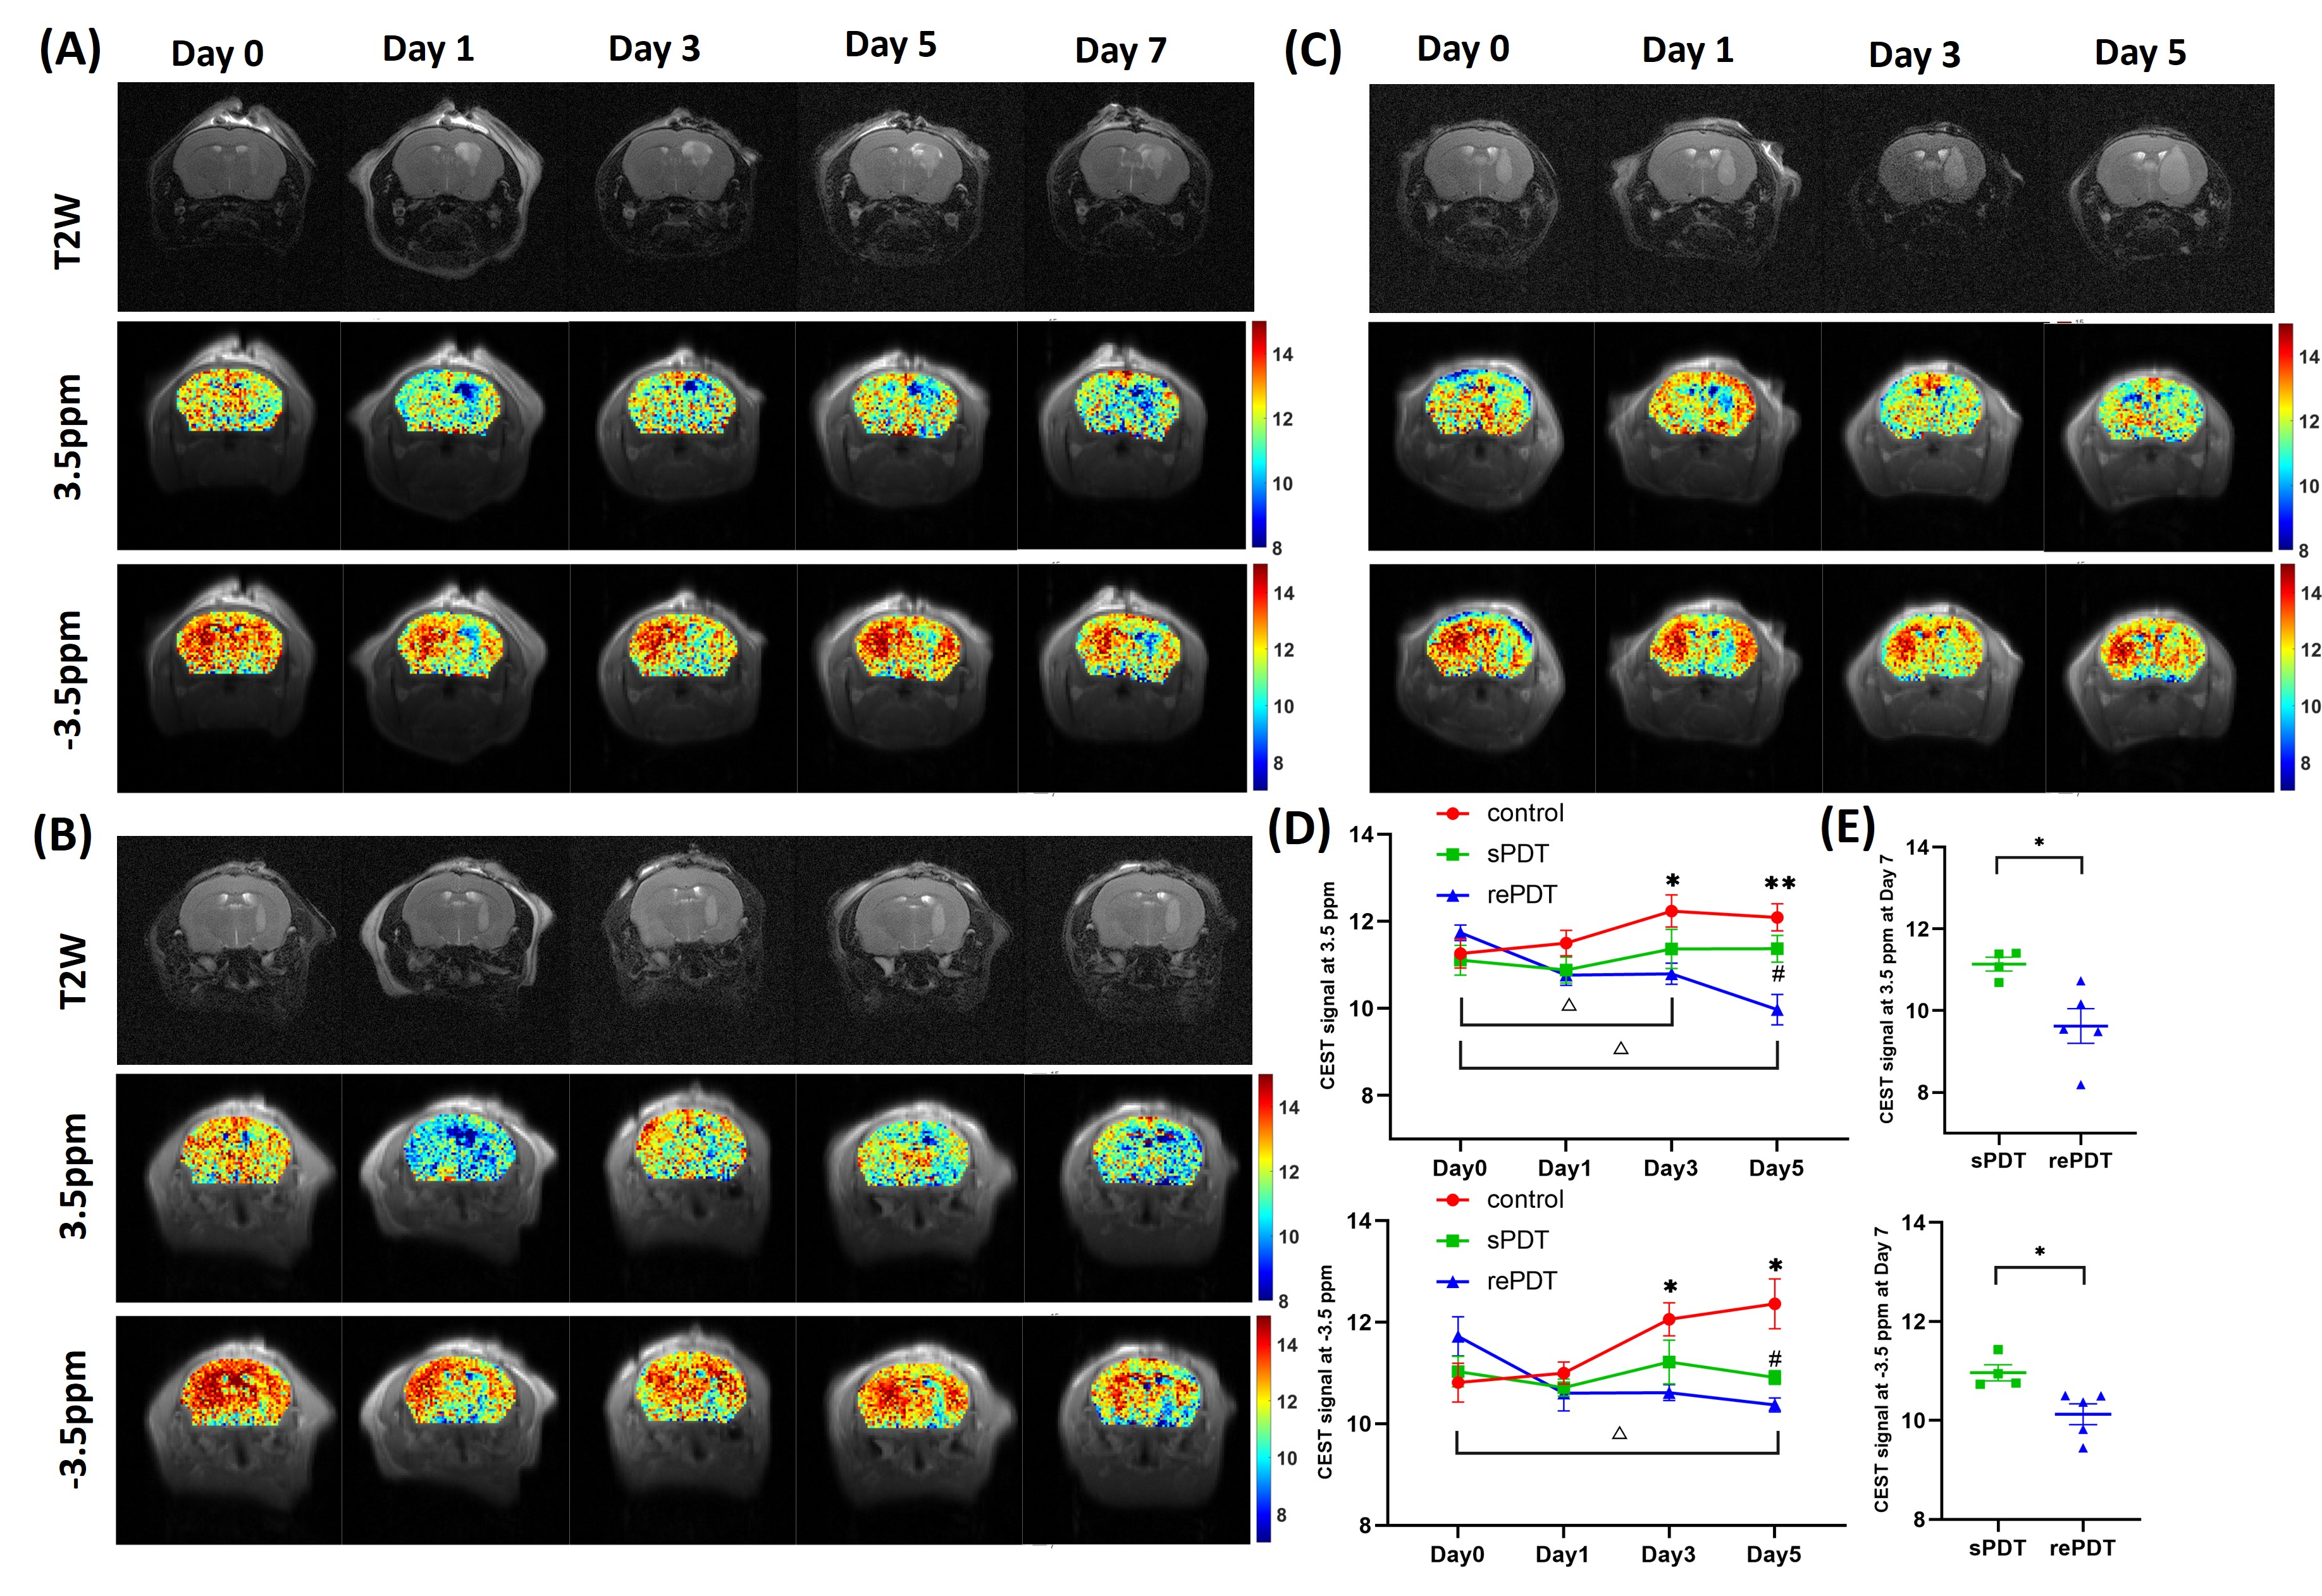
Figure 2 Representative T2-weighted(T2W) and CEST maps of (A) rePDT, (B) sPDT and (C) control at different treatment timepoint. (D) CEST signal at 3.5ppm and -3.5ppm from Day 0 to 5 and (E) Day 7. *, # and △represents significance of comparison between rePDT vs control, rePDT vs sPDT and longitudinal change in signal of rePDT ,respectively. Data were presented as mean ± SEM. N=4-6 (control), 4-7 (sPDT), 5-6 (rePDT). *P<0.05, **P<0.01, 2-way ANOVA(Day 0 to 5), T-test (Day 7).
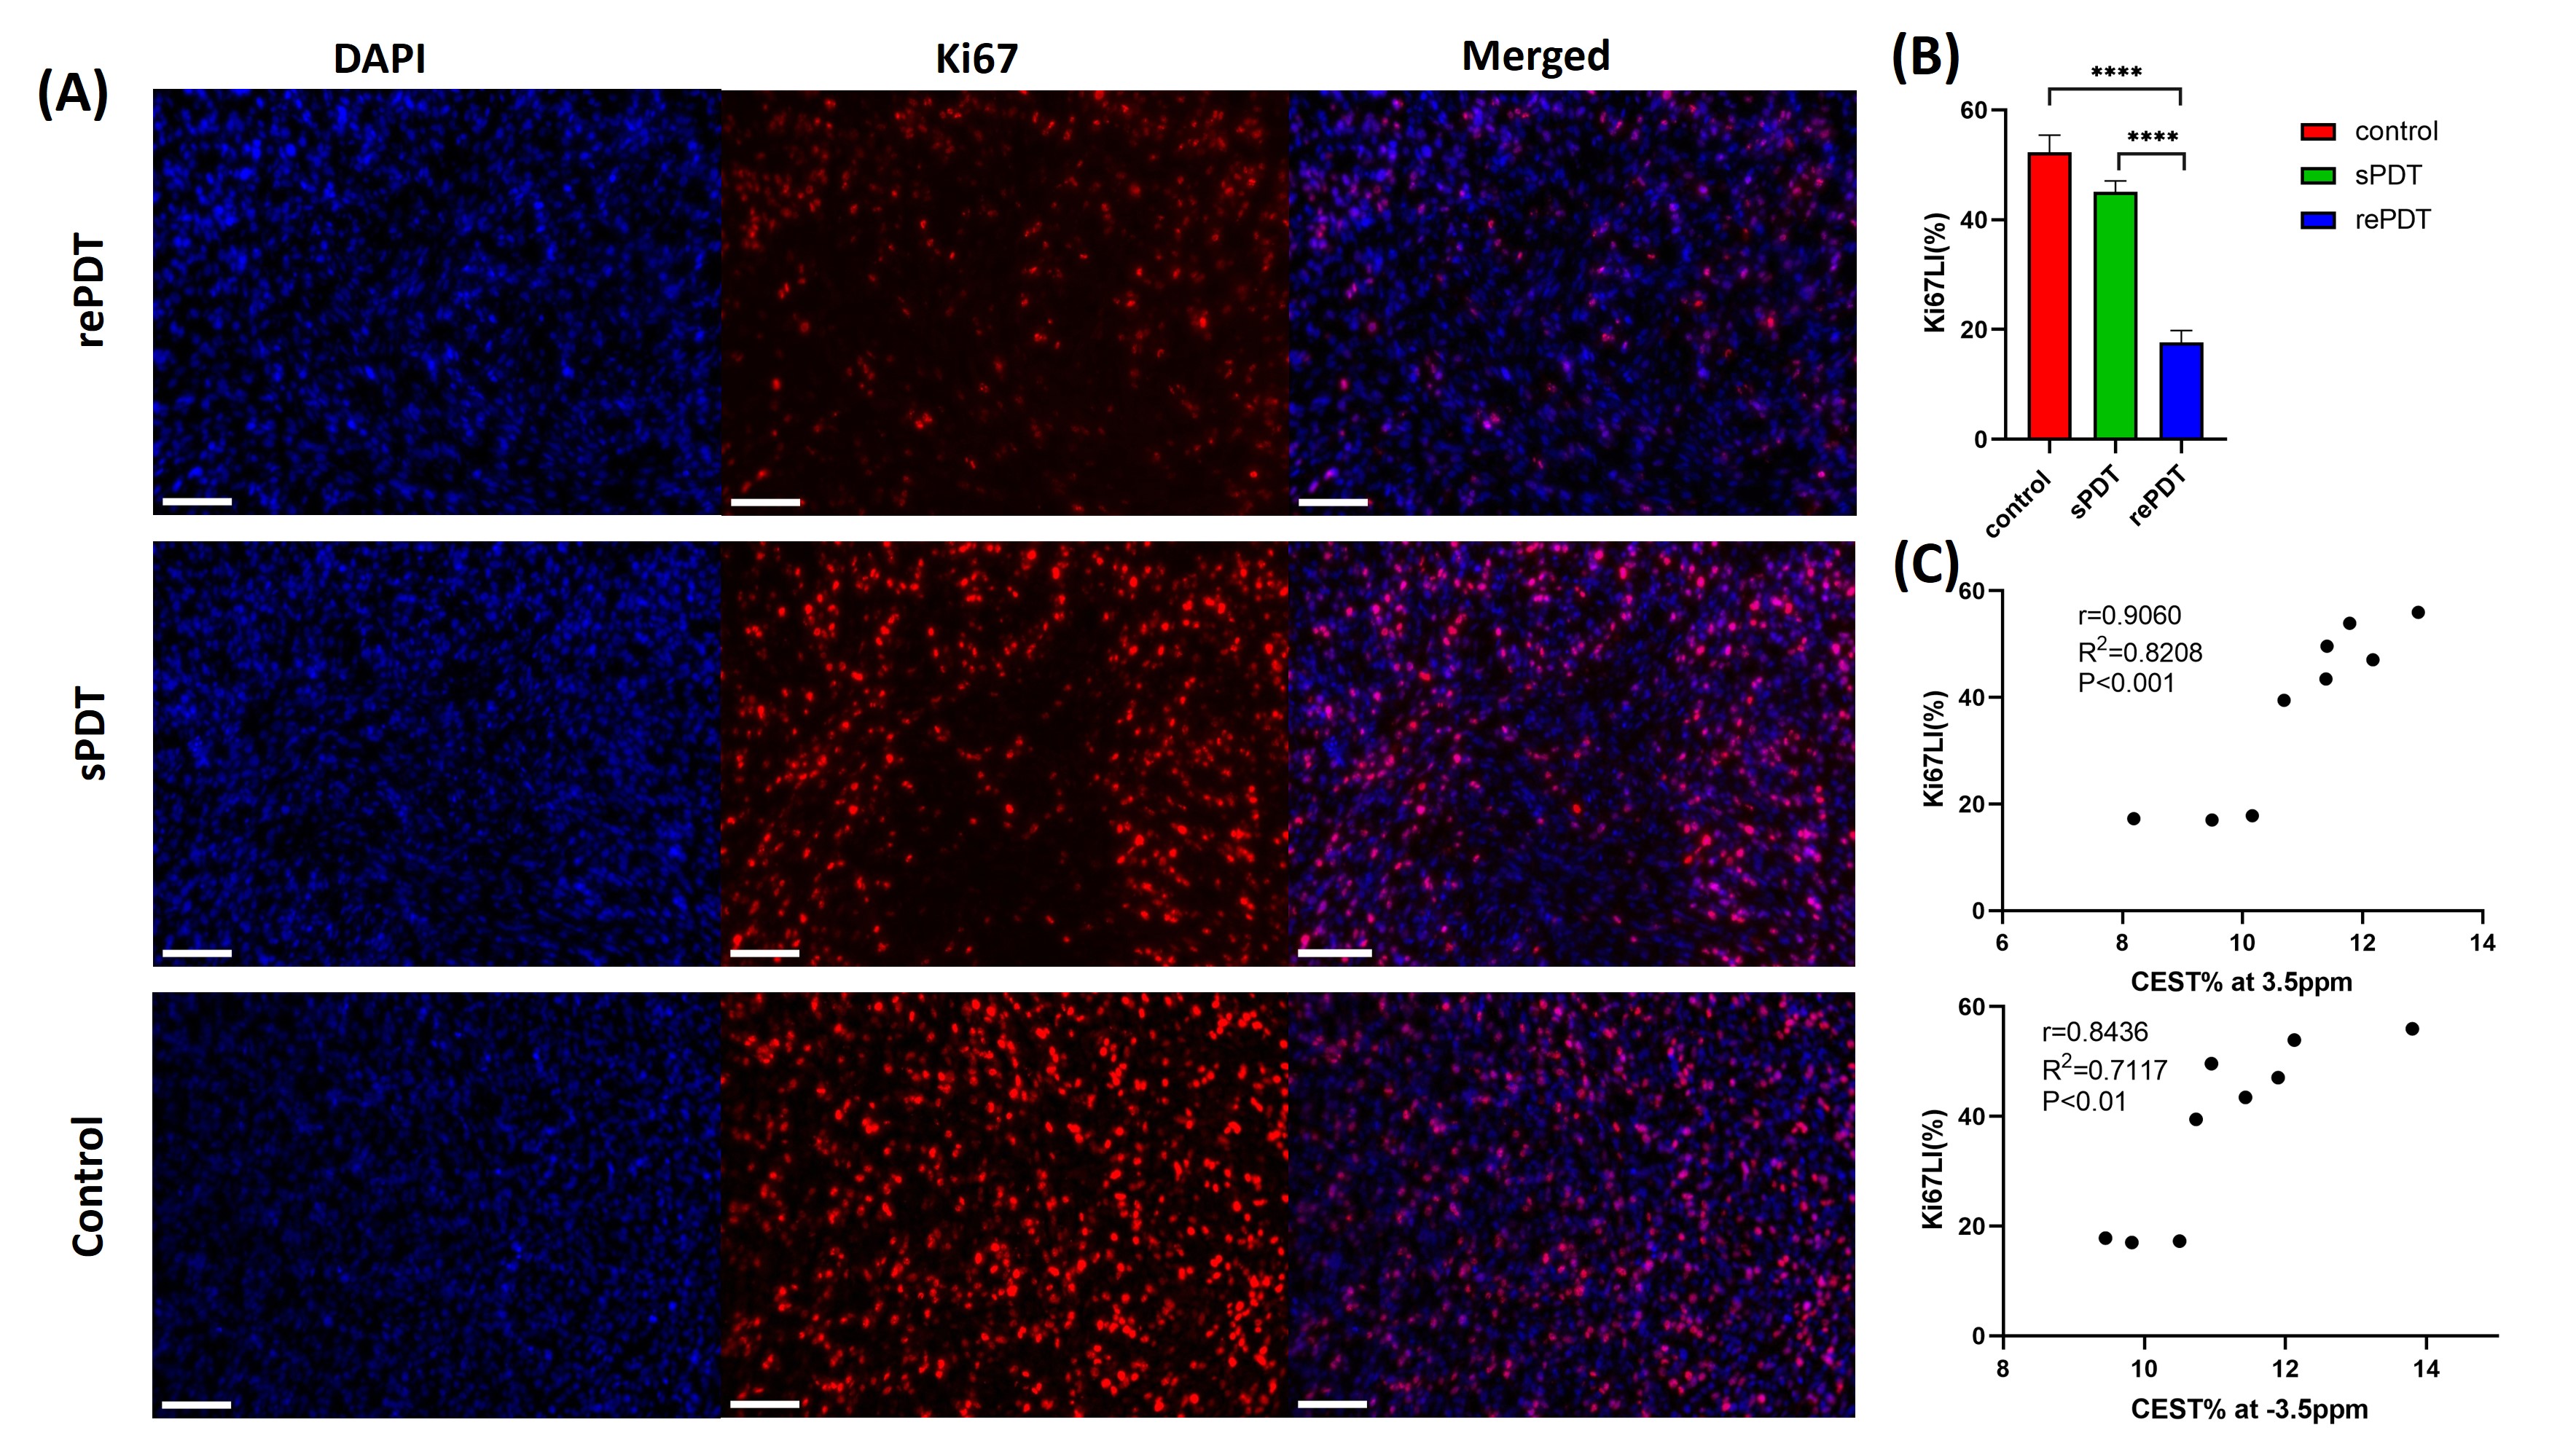
Figure 3 Ki67 staining results of representative animals of (A) rePDT, sPDT (Day 7) and control (Day 5) with 20X (scale bar: 100μm) magnification. (B) Ki67 labeling index (Ki67LI) calculated based on the percentage of Ki67+ cells, N=3. 1-way ANOVA. (C) Correlation test between Ki67LI and CEST signal at 3.5 and -3.5ppm, N=9. All data were presented as mean ± SEM. ****P<0.0001.
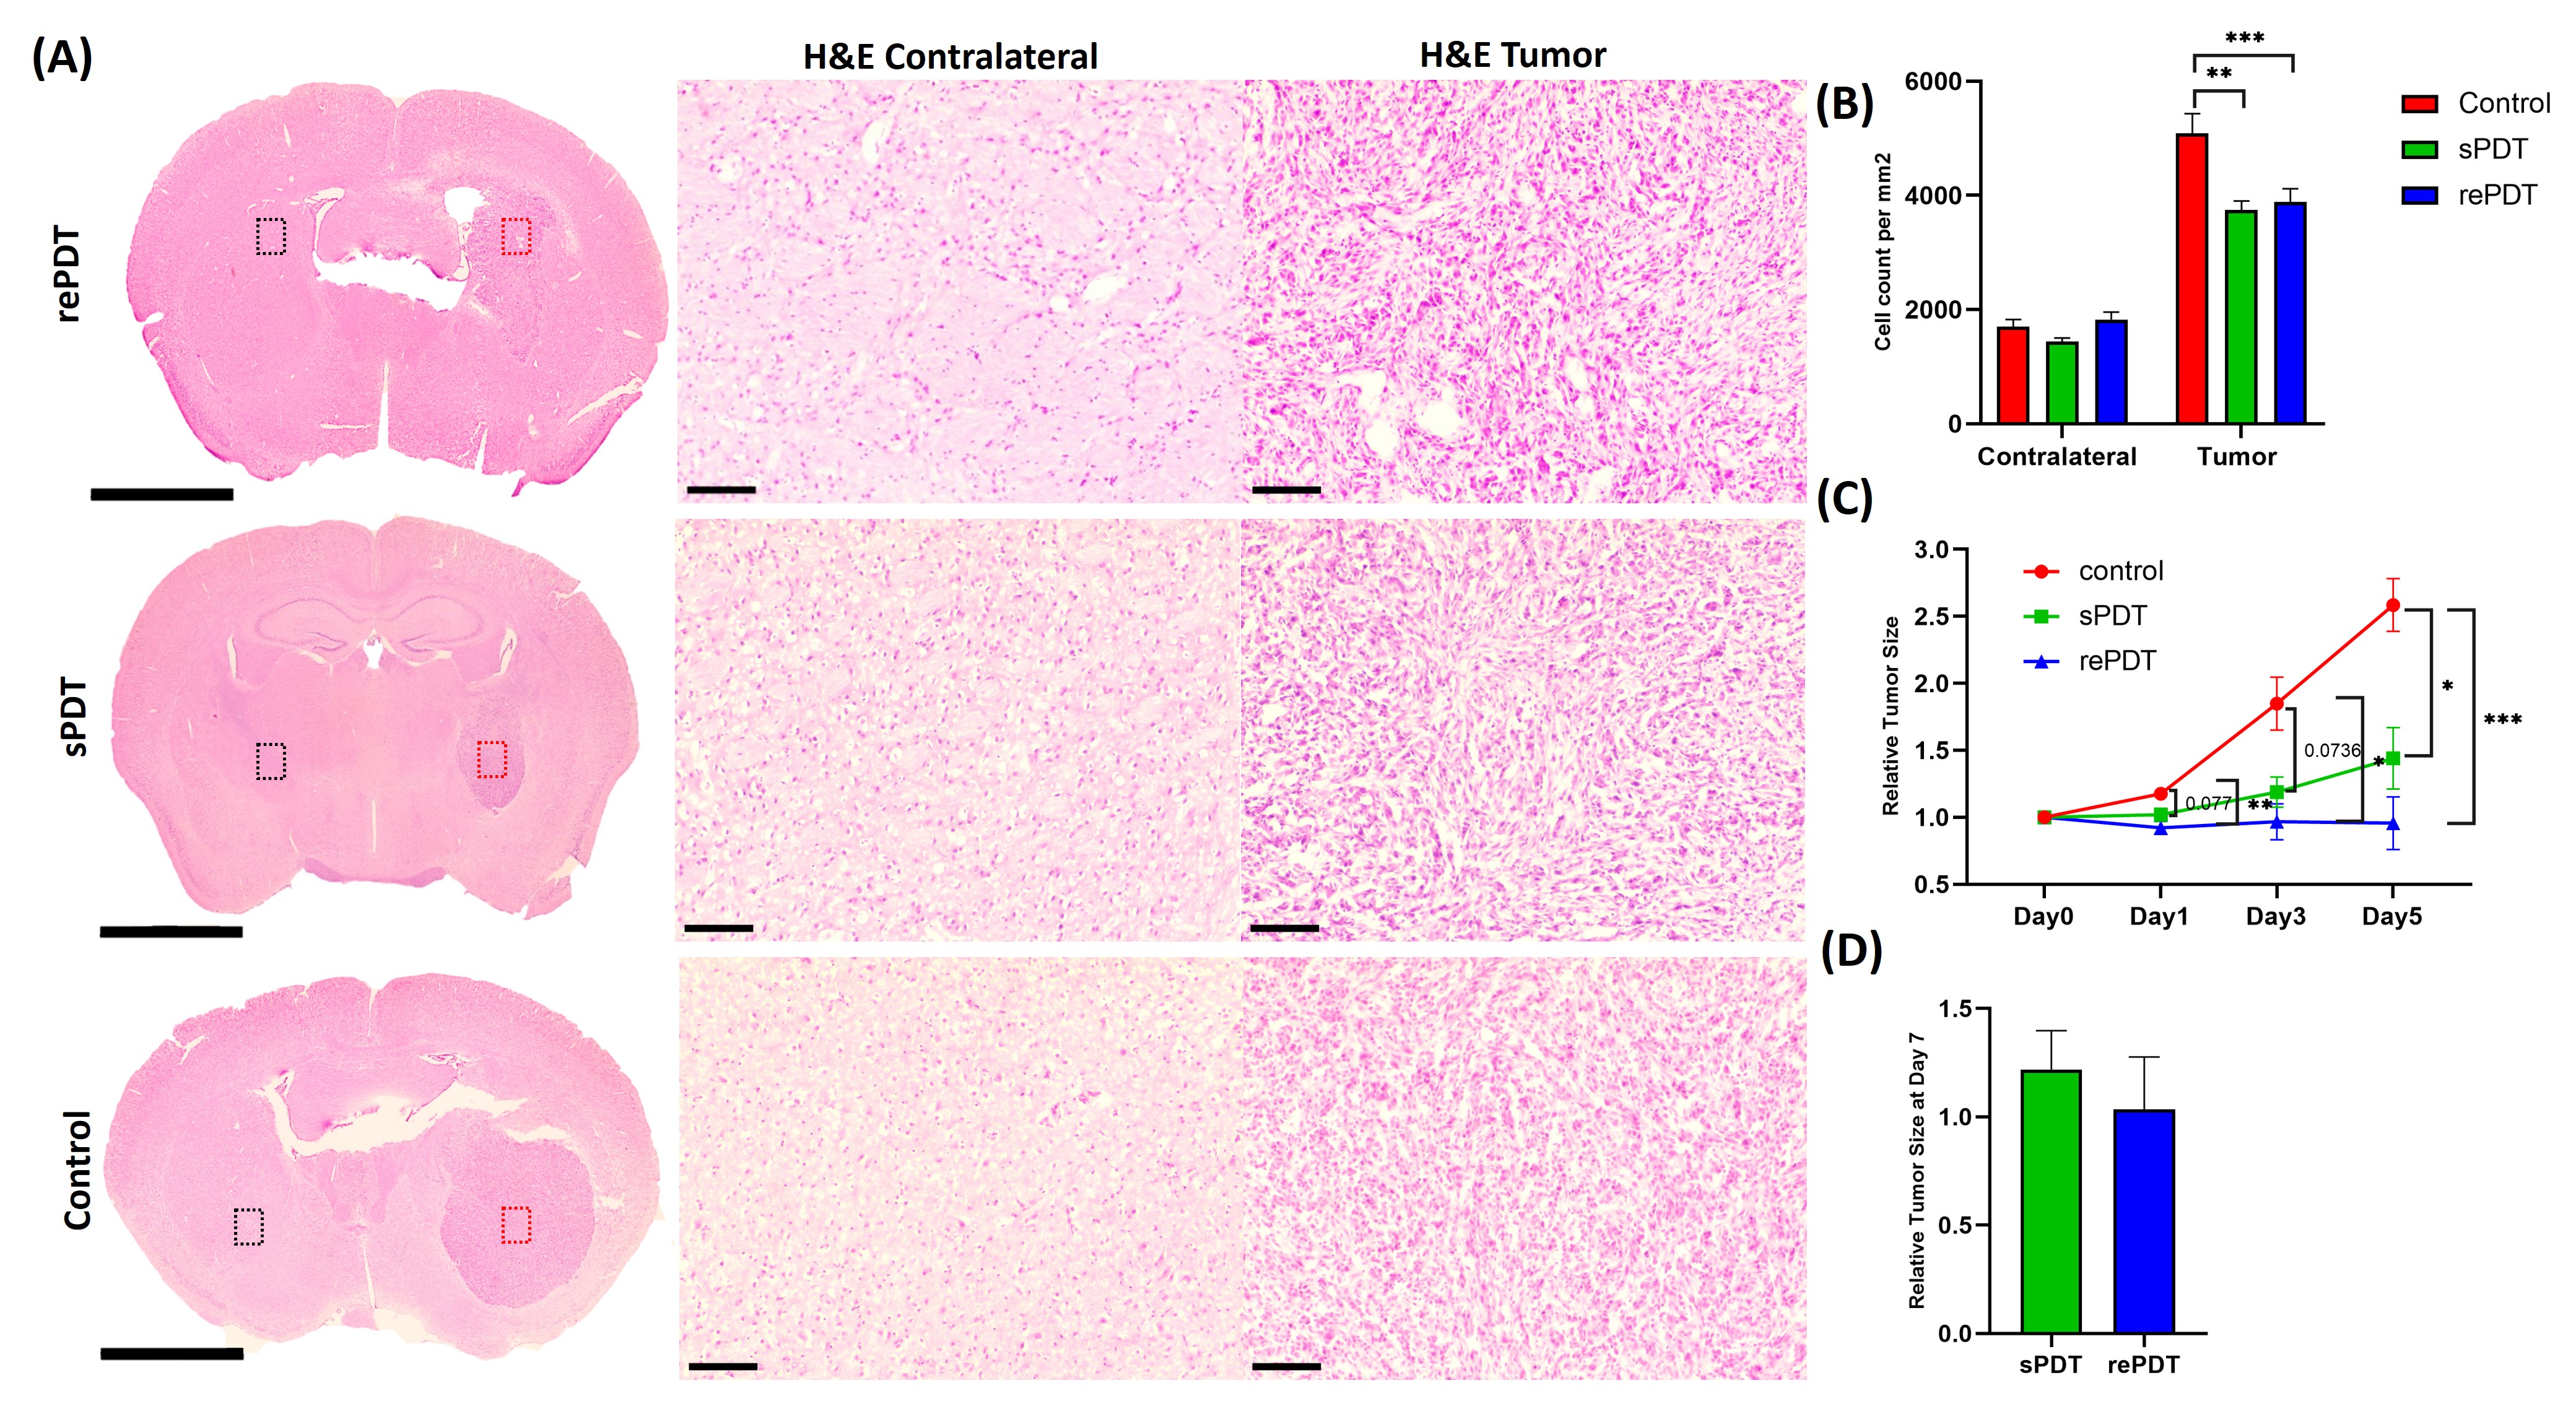
Figure 4 H&E staining results of representative animals of (A) rePDT, sPDT (Day 7) and control (Day 5) with 4X (scale bar: 1mm) and 20X (scale bar: 100μm) magnification side-by-side. FoV at 20X: Tumor(Red dots); Contralateral (Black dots). (B) Cell count per mm2 was calculated based on 20X H&E images, N=3. (C) Longitudinal change of relative tumor size (Day 0-5) and (D) Day 7, calculated based on T2W images. All data were presented as mean ± SEM. *P<0.05, **P<0.01, ***P<0.001. 2-way ANOVA.