2995
Subspace denoising for CEST MRI with non-local low-rank constraint and spectral-smoothness regularization
Xinran Chen1, Jian Wu1, Liangjie Lin2, Zhiliang Wei3, Lin Chen1, and Zhong Chen1
1Department of electronic science, Xiamen University, Xiamen, China, 2Clinical & Technical Support, Philips Healthcare, Beijing, China, 3Russell H. Morgan Department of Radiology and Radiological Science, Johns Hopkins University School of Medicine, Baltimore, MD, United States
1Department of electronic science, Xiamen University, Xiamen, China, 2Clinical & Technical Support, Philips Healthcare, Beijing, China, 3Russell H. Morgan Department of Radiology and Radiological Science, Johns Hopkins University School of Medicine, Baltimore, MD, United States
Synopsis
Keywords: CEST & MT, Data Processing, Denoising
Chemical exchange saturation transfer (CEST) is a powerful technique that enables non-invasive detection of endogenous metabolites in living tissues. Since the observed water signal is decreased due to the transfer of saturated spins, CEST imaging inherently suffers from low SNR, hence degrading accuracy and reproducibility. Inspired by the spatial-spectral correlation of CEST images, here we propose a Subapace denoising method with Non-Local Low-Rank constraint and Spectral-Smoothness regularization (SNLRSS) to diminish the noise, which improves the accuracy of subsequent quantitative analyses of CEST images.Introduction
Chemical exchange saturation transfer (CEST) MRI is a versatile imaging technique that enables indirect detection of diluted molecules by manipulating the water proton signal through selective saturation of exchangeable protons1. Currently, CEST MRI has been applied to detect various metabolites for the assessment of different diseases, including ischemia, neurological disorders, and tumors2. Despite the wide potential applicability of CEST MRI, clinical exploitation is still limited by low CEST contrast (commonly in the range of 1%-10%) and low signal-to-noise (SNR) of acquired images, which challenge its reproducibility and reliability. Several efforts have been made to improve the SNR in CEST MRI by exploring the spatial-spectral correlation of CEST images, such as PCA, NlmCED, and MLSVD. Although the abovementioned approaches work well generally, only limited prior information was utilized. In this work, we propose a novel subspace denoising method termed Subspace-based Non-Local Low-Rank and Spectral-Smoothness constraint (SNLRSS) to fully exploit the spectral low-rankness, non-local self-similarity and spectral-smoothness properties of CEST images.Methods
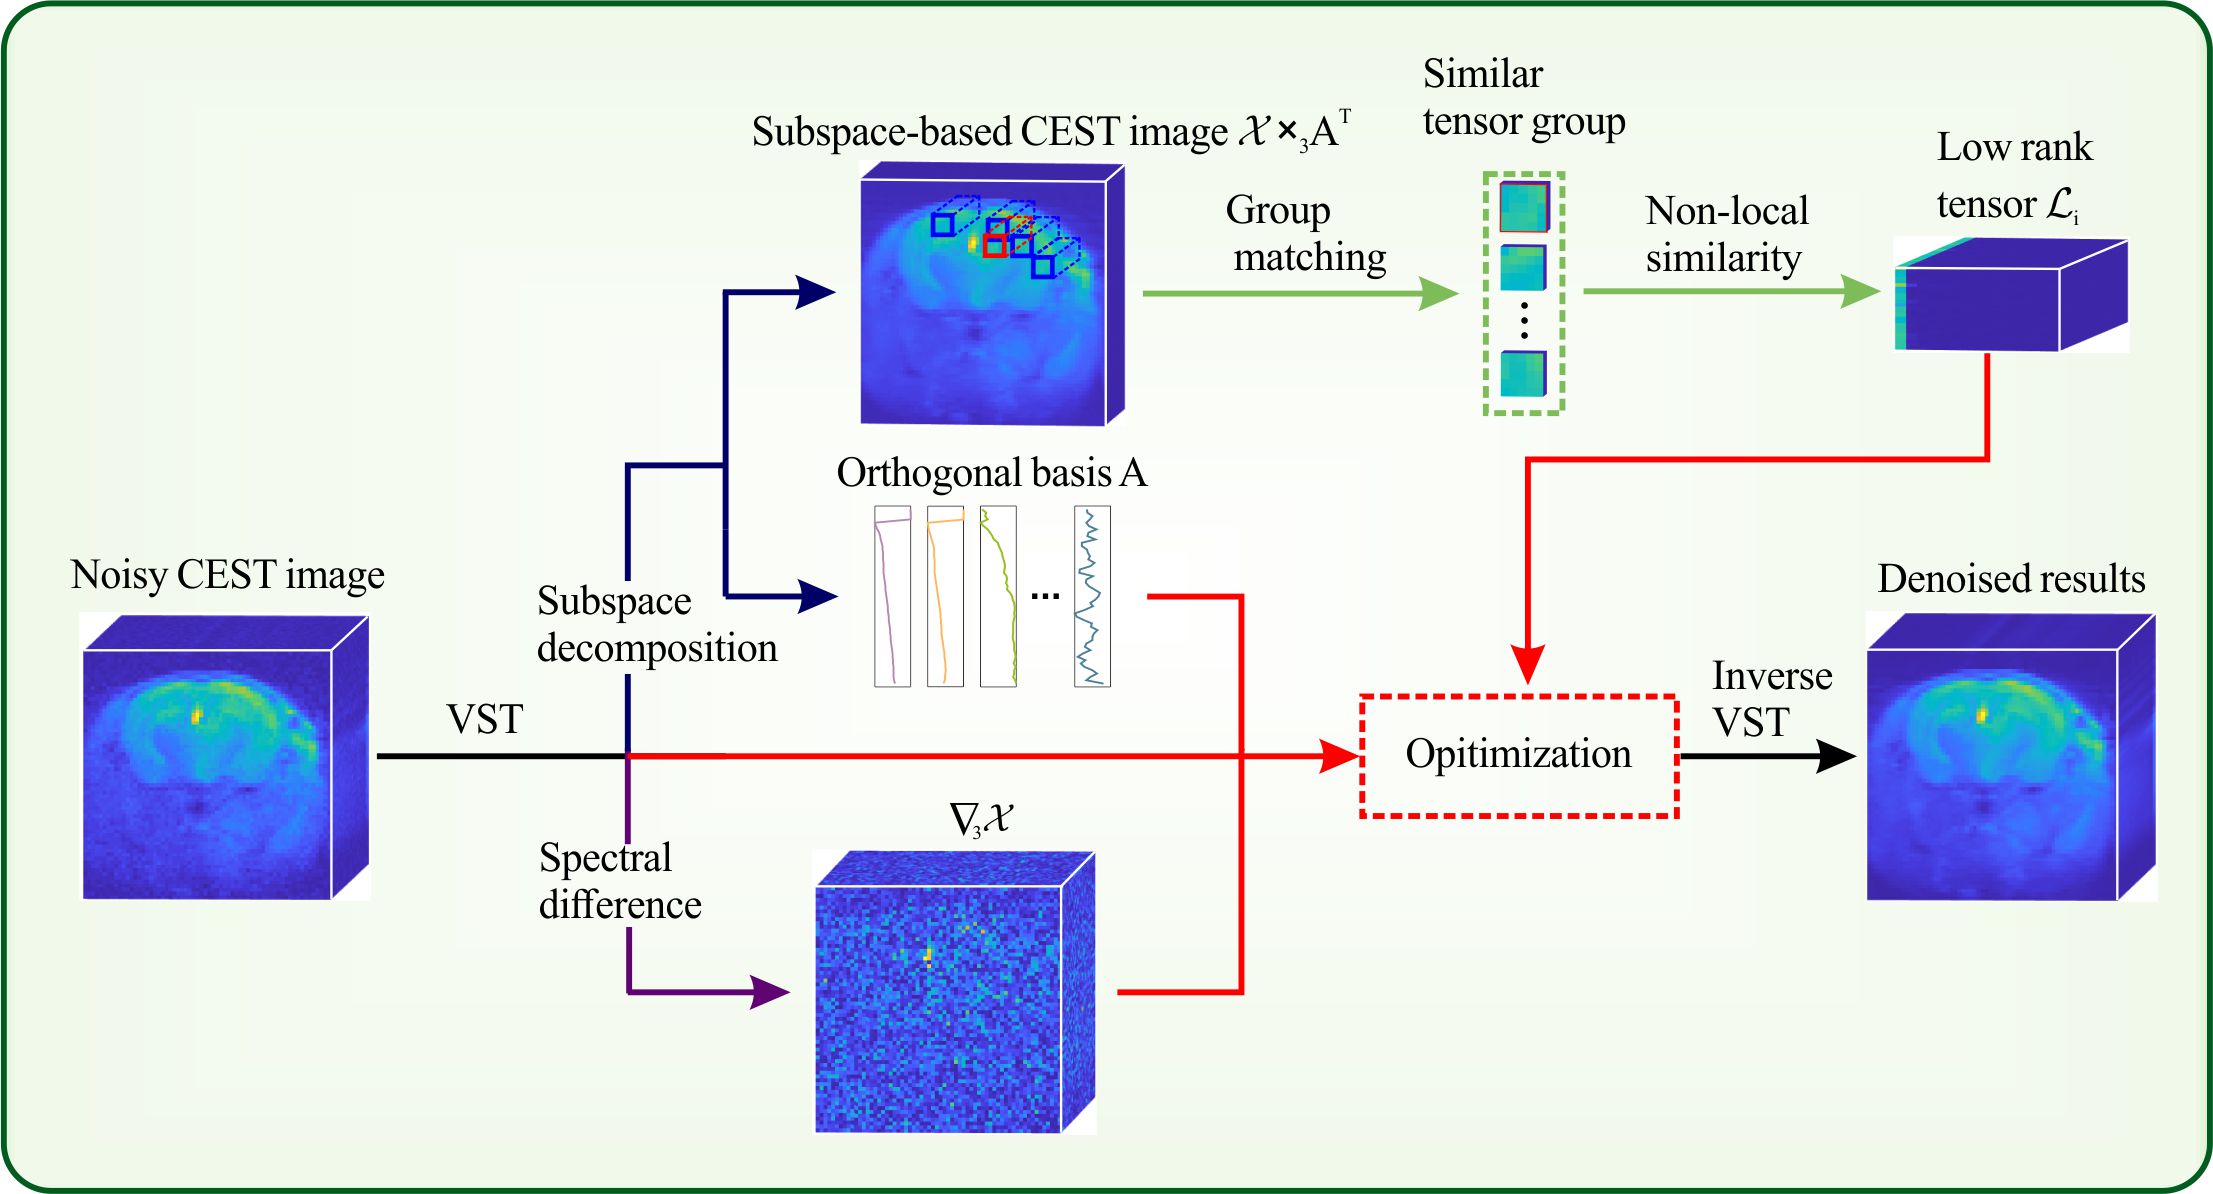
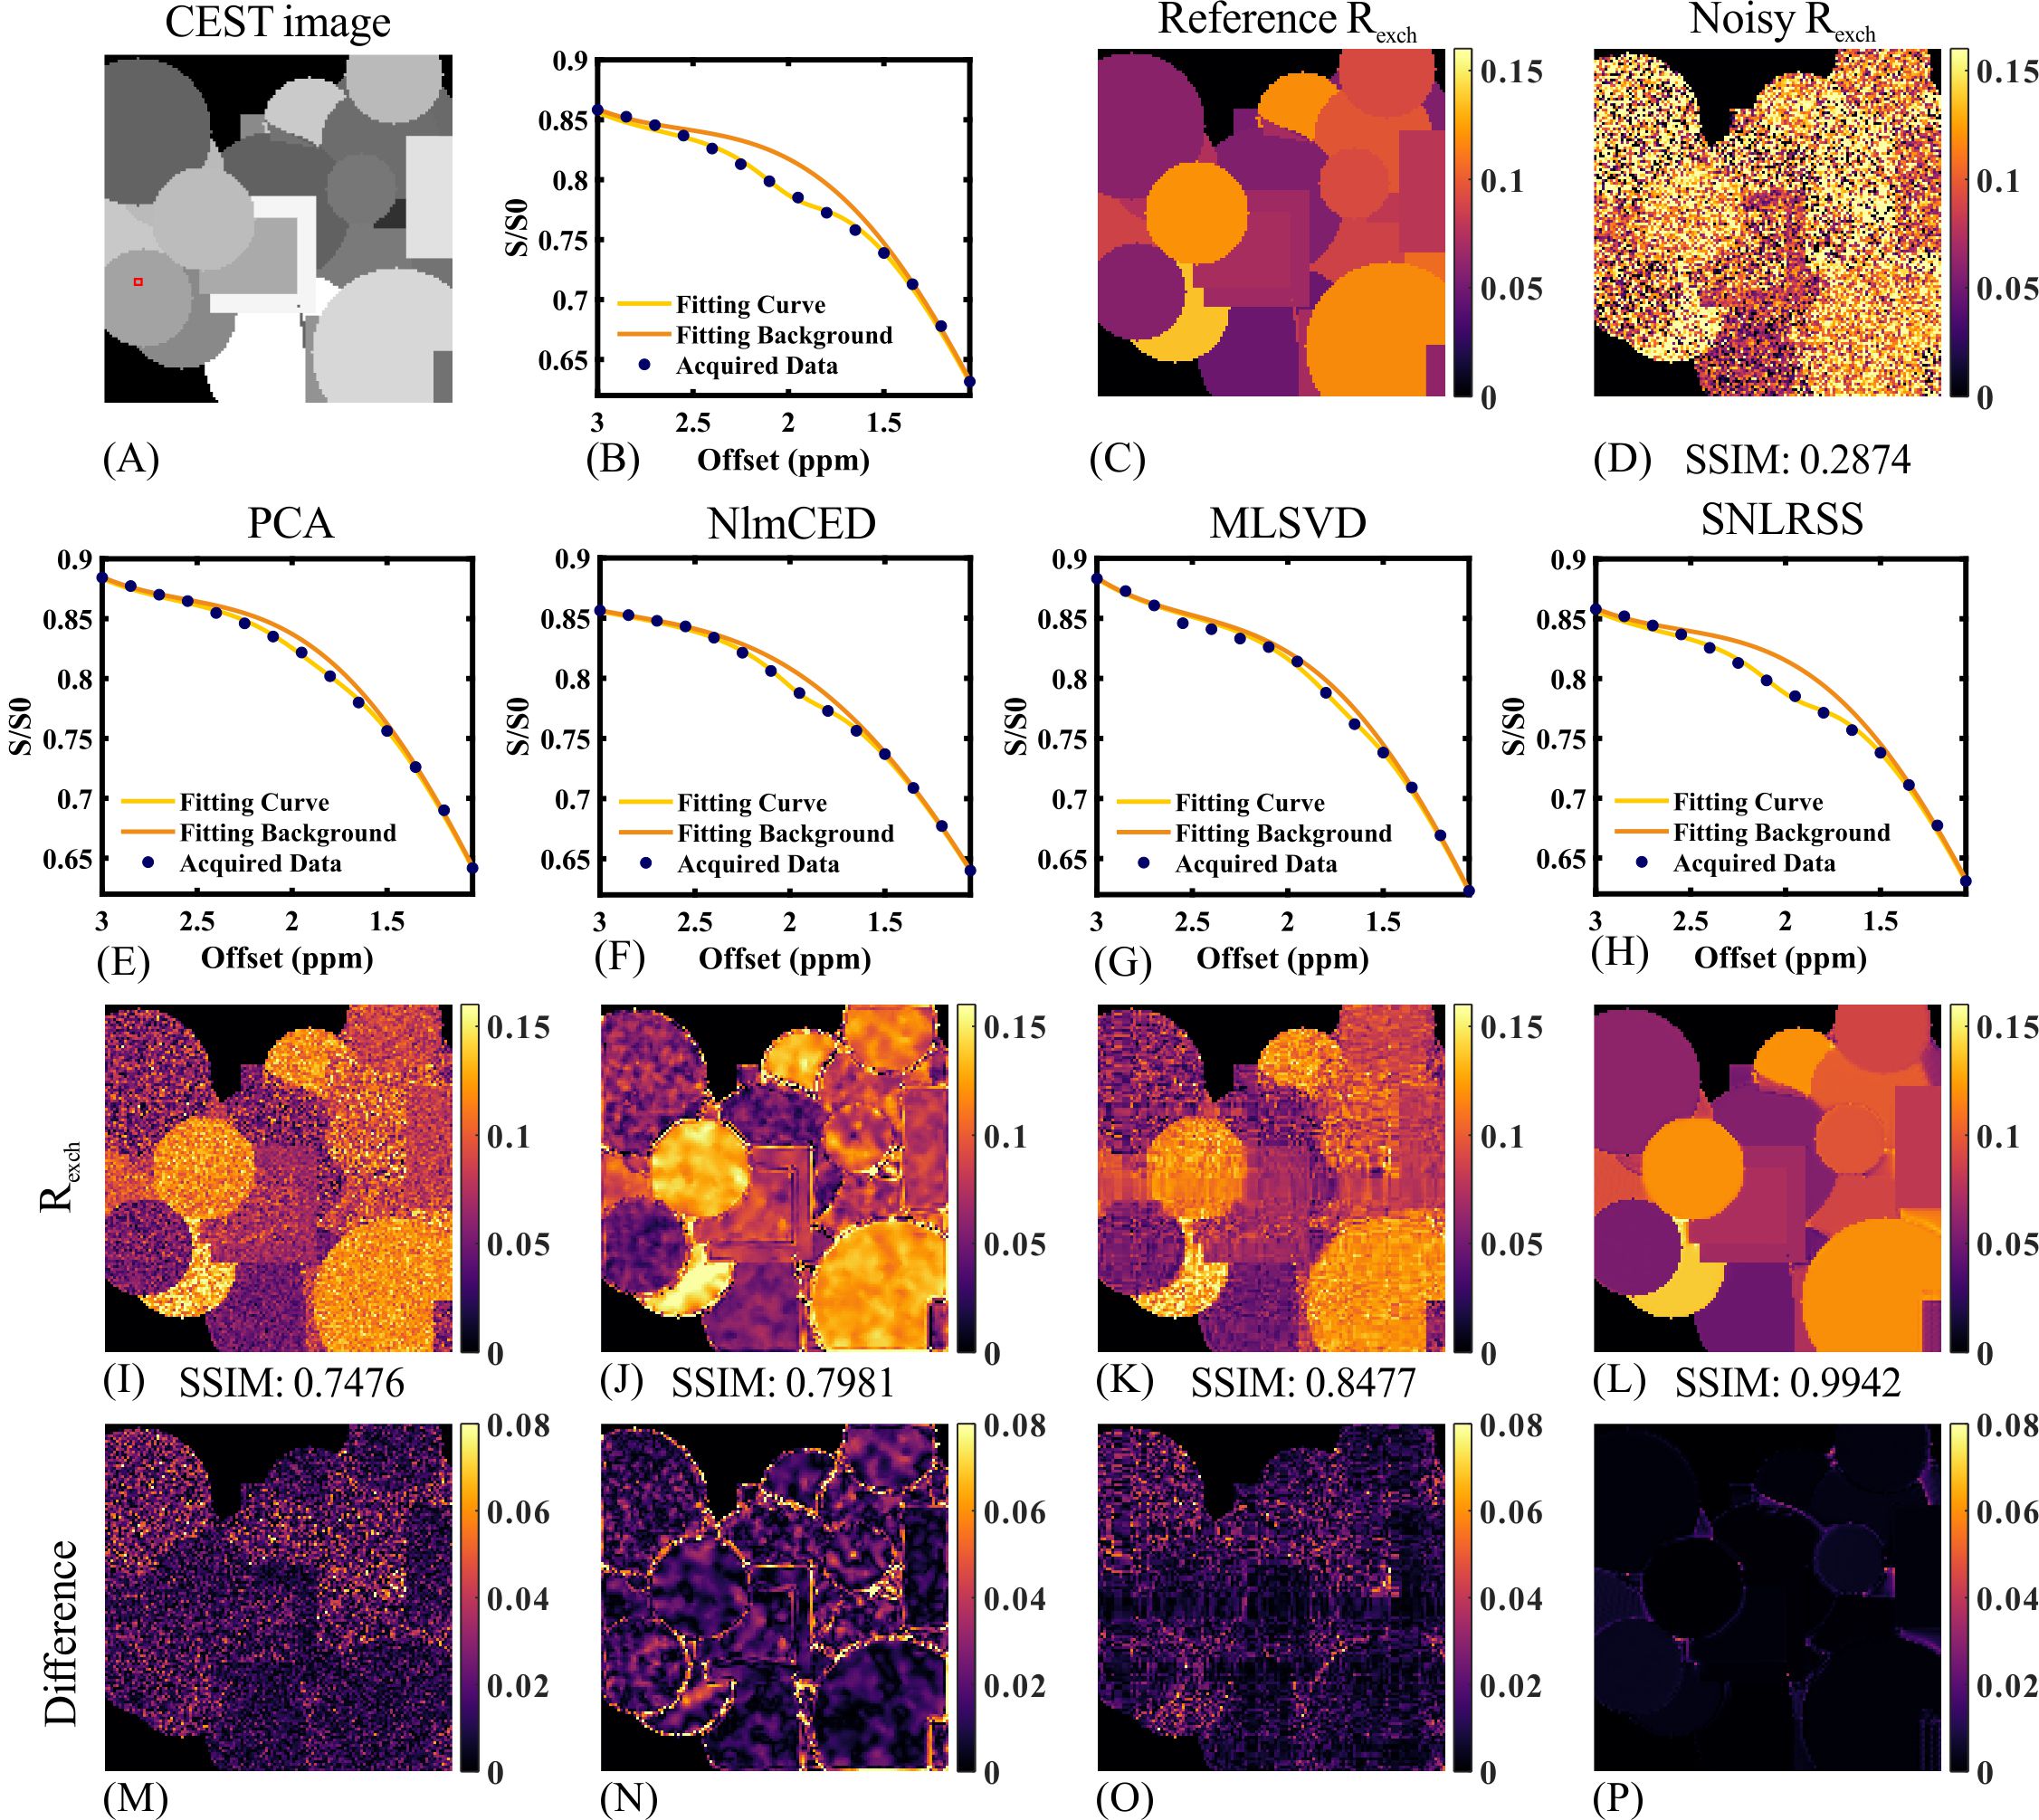
Theory of SNLRSS: The flowchart of SNLRSS is shown in Figure 1. Forward variance-stabilizing transformation (VST) is utilized to convert the signal-dependent Rician noise into Gaussian-distributed noise in CEST images. The subspace decomposition is applied to transform CEST images into low-dimensional orthogonal bases and subspace-based images according to the spectral low-rank prior. Non-local similarity prior is utilized to remove the noise of subspace-based images. The spectral-smoothness regularization is implemented to further reduce oscillations in Z-spectrum. The proposed model is solved by the alternating minimization (AM) scheme and alternating direction method of multipliers (ADMM).Simulation: Synthetic CEST data with a matrix size of 128 × 128 were generated to evaluate the performance of the denoising methods quantitatively. The Z-spectra were generated using the Bloch-McConnell equation with three pools (bulk water, MT pool, and creatine pool)3. The concentration of creatine pool in different patterns was randomly selected from 10mM~100mM. A continuous-wave saturation scheme (1 µT × 3 s) with 81 frequency offsets sampled from −6 to 6 ppm was employed in the simulation.
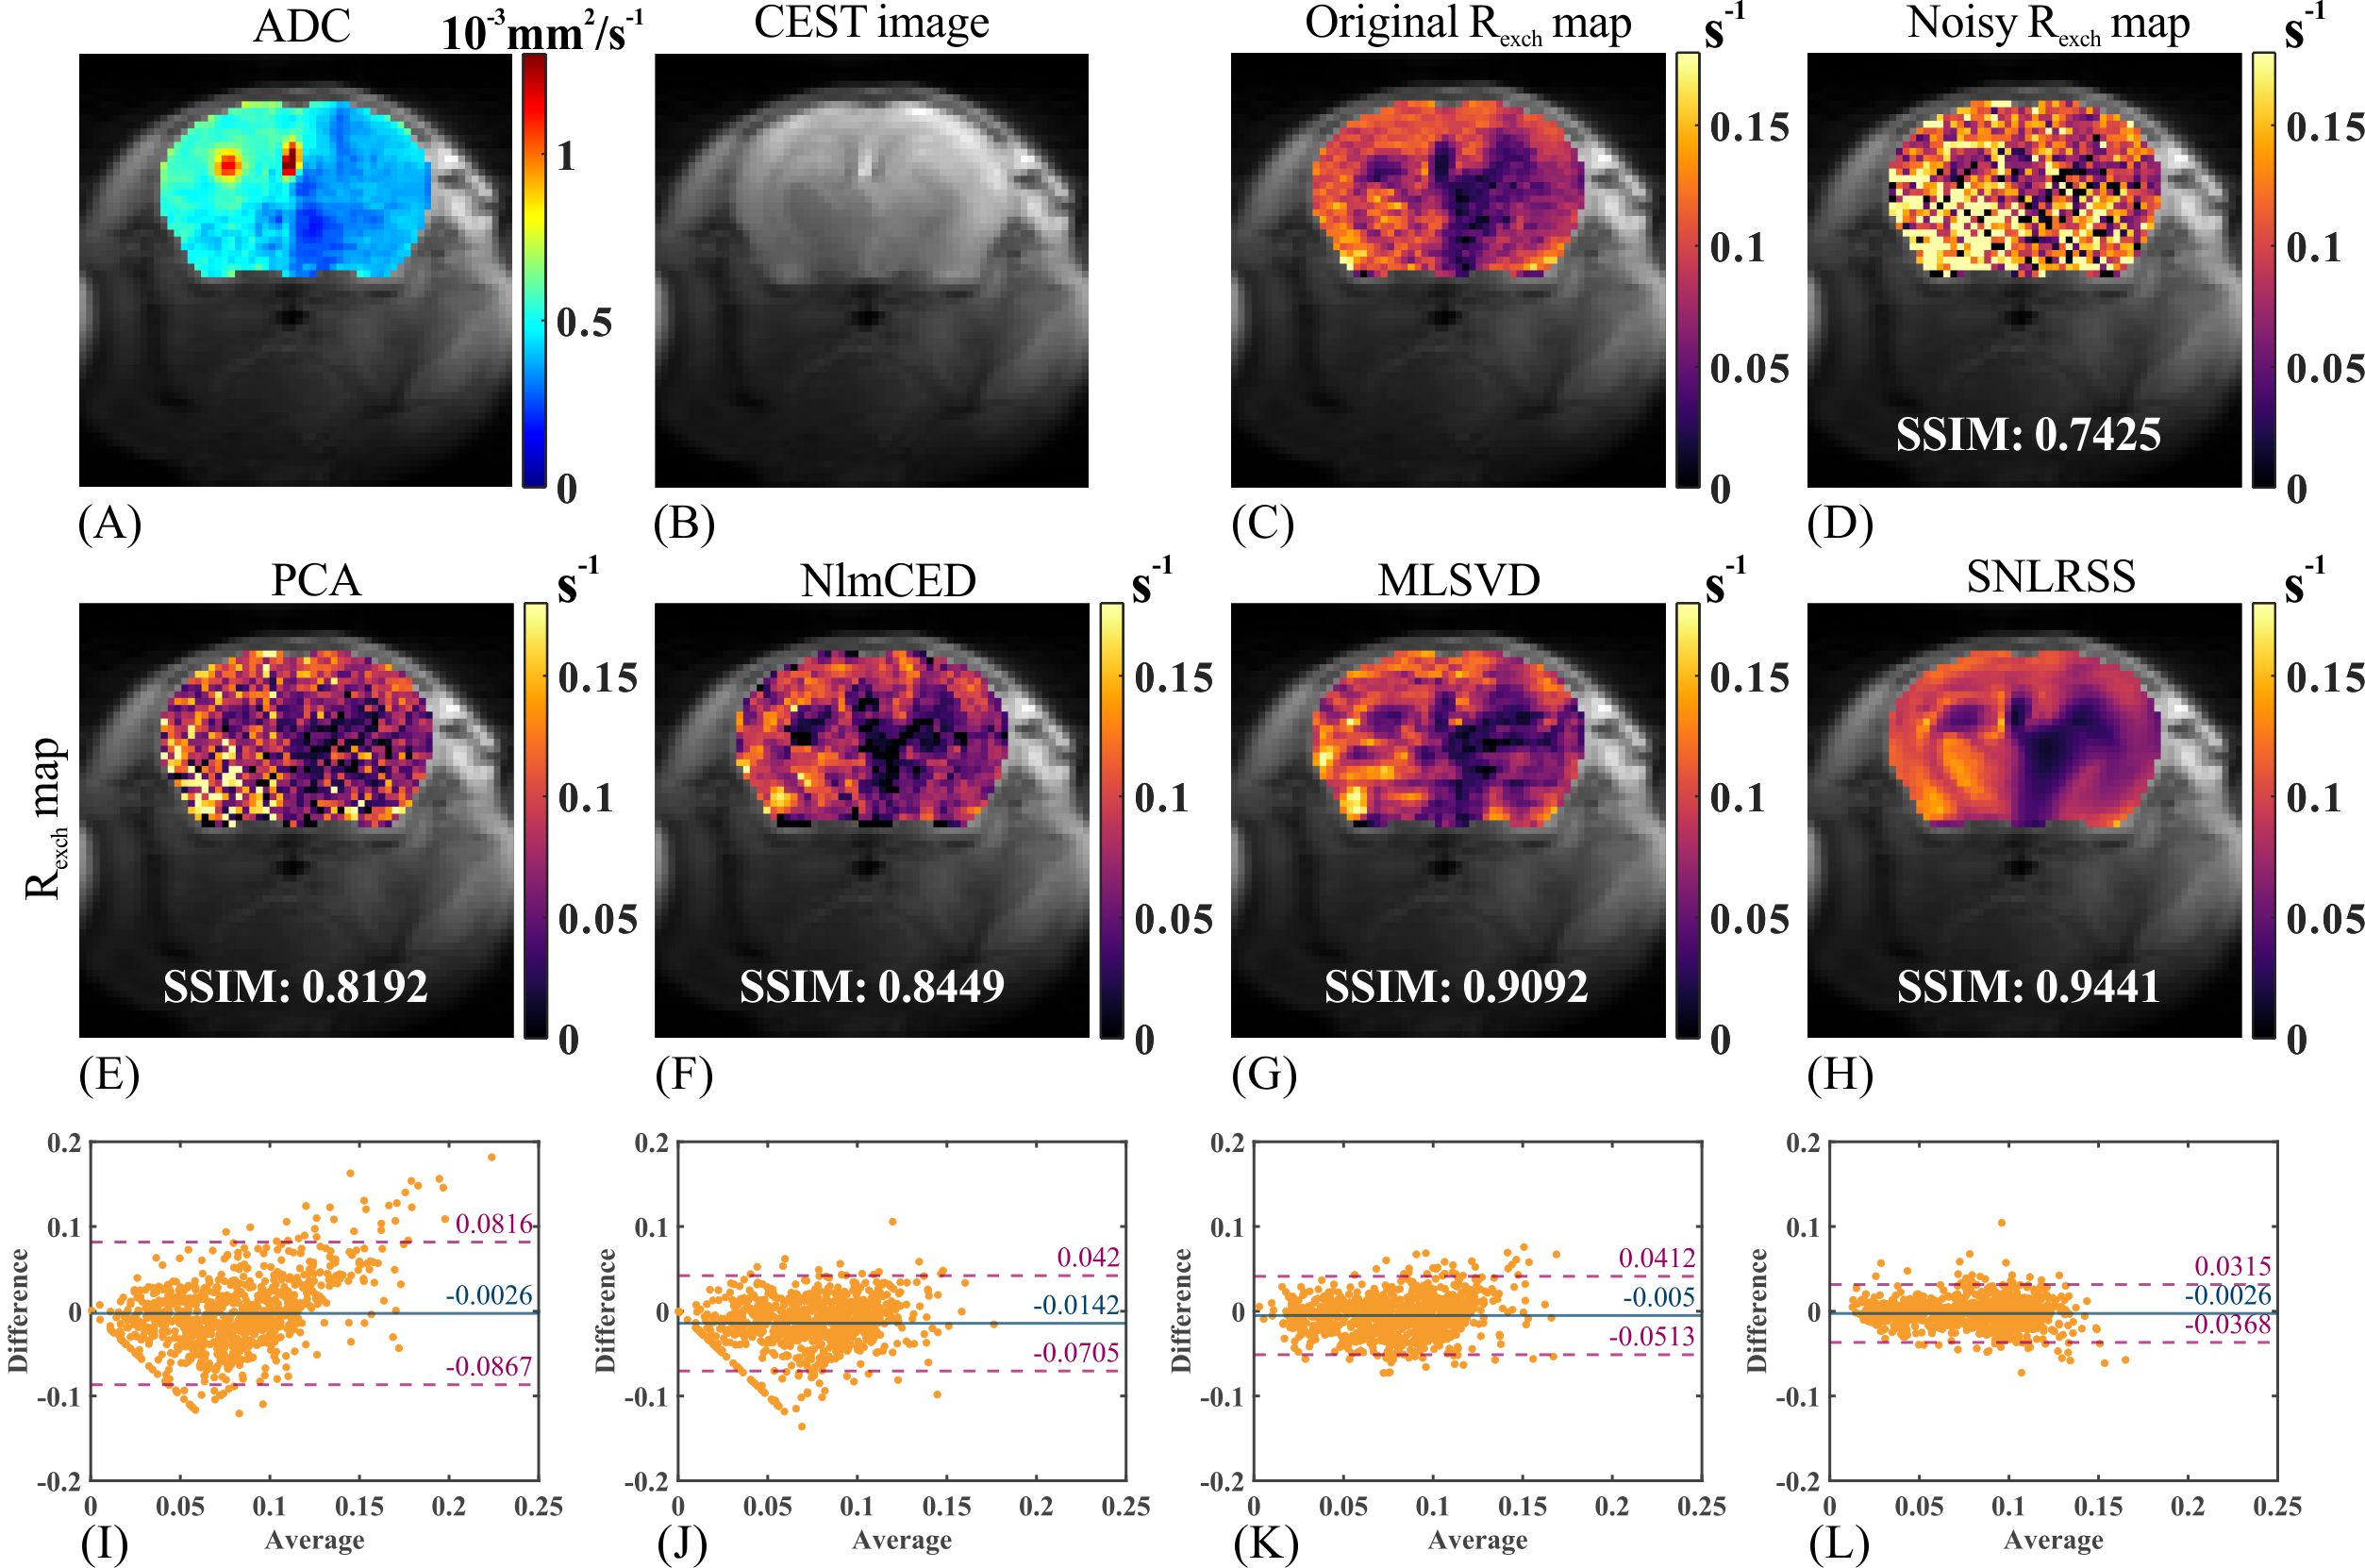
In vivo mouse experiment: The in vivo ischemic stroke mouse experiment was performed on a horizontal bore 11.7 T (tesla) Bruker Biospec system (Bruker, Ettlingen, Germany) using a turbo spin-echo sequence with a matrix size 64 × 64. A saturation scheme (2 µT × 1 s) with 49 frequency offsets from 1 to 5 ppm was employed.
To mimic a low SNR situation, 1% Rician-distributed noise was artificially added to CEST images. The polynomial and Lorentzian line-shape fitting (PLOF) method4 is implemented to extract the CEST signal Rexch. The original CrCEST Rexch maps were used as references.
Results and Discussion
Figure 2 demonstrates the denoising results and difference maps for numerical simulation with different denoising methods. All denoising methods yielded improved outcomes (Figures 2I-2L) compared to the noisy results (Figure 2D). However, due to the absence of spatial prior information, the performance of PCA was inferior to other methods according to the SSIM (Figure 2M). NlmCED and MLSVD yielded better performances in noise reduction compared to PCA. However, the edge region of NlmCED outcome was unsatisfactory (Figure 2N) and MLSVD outcome suffered from obvious blocking artifacts (Figure 2O). It can be concluded from the difference maps and SSIM values that SNLRSS was advantageous in both spectral fidelity and final quantification.The results of in vivo mouse experiment are shown in Figure 3. The ADC map was employed for evaluating the stroke lesions (Figure 3A). Due to the decline of pH values, an obviously reduced CrCEST contrast was observed in the ischemic regions, as demonstrated in Figure 1C. Similar to simulation, all the methods improved the quality of CEST maps (Figures 3E-3H), among which SNLRSS performed best in distinguishing ischemic regions. From the Bland-Altman plots shown in Figures 3I-3L, SNLRSS yielded the smallest deviation compared to the other denoising methods.
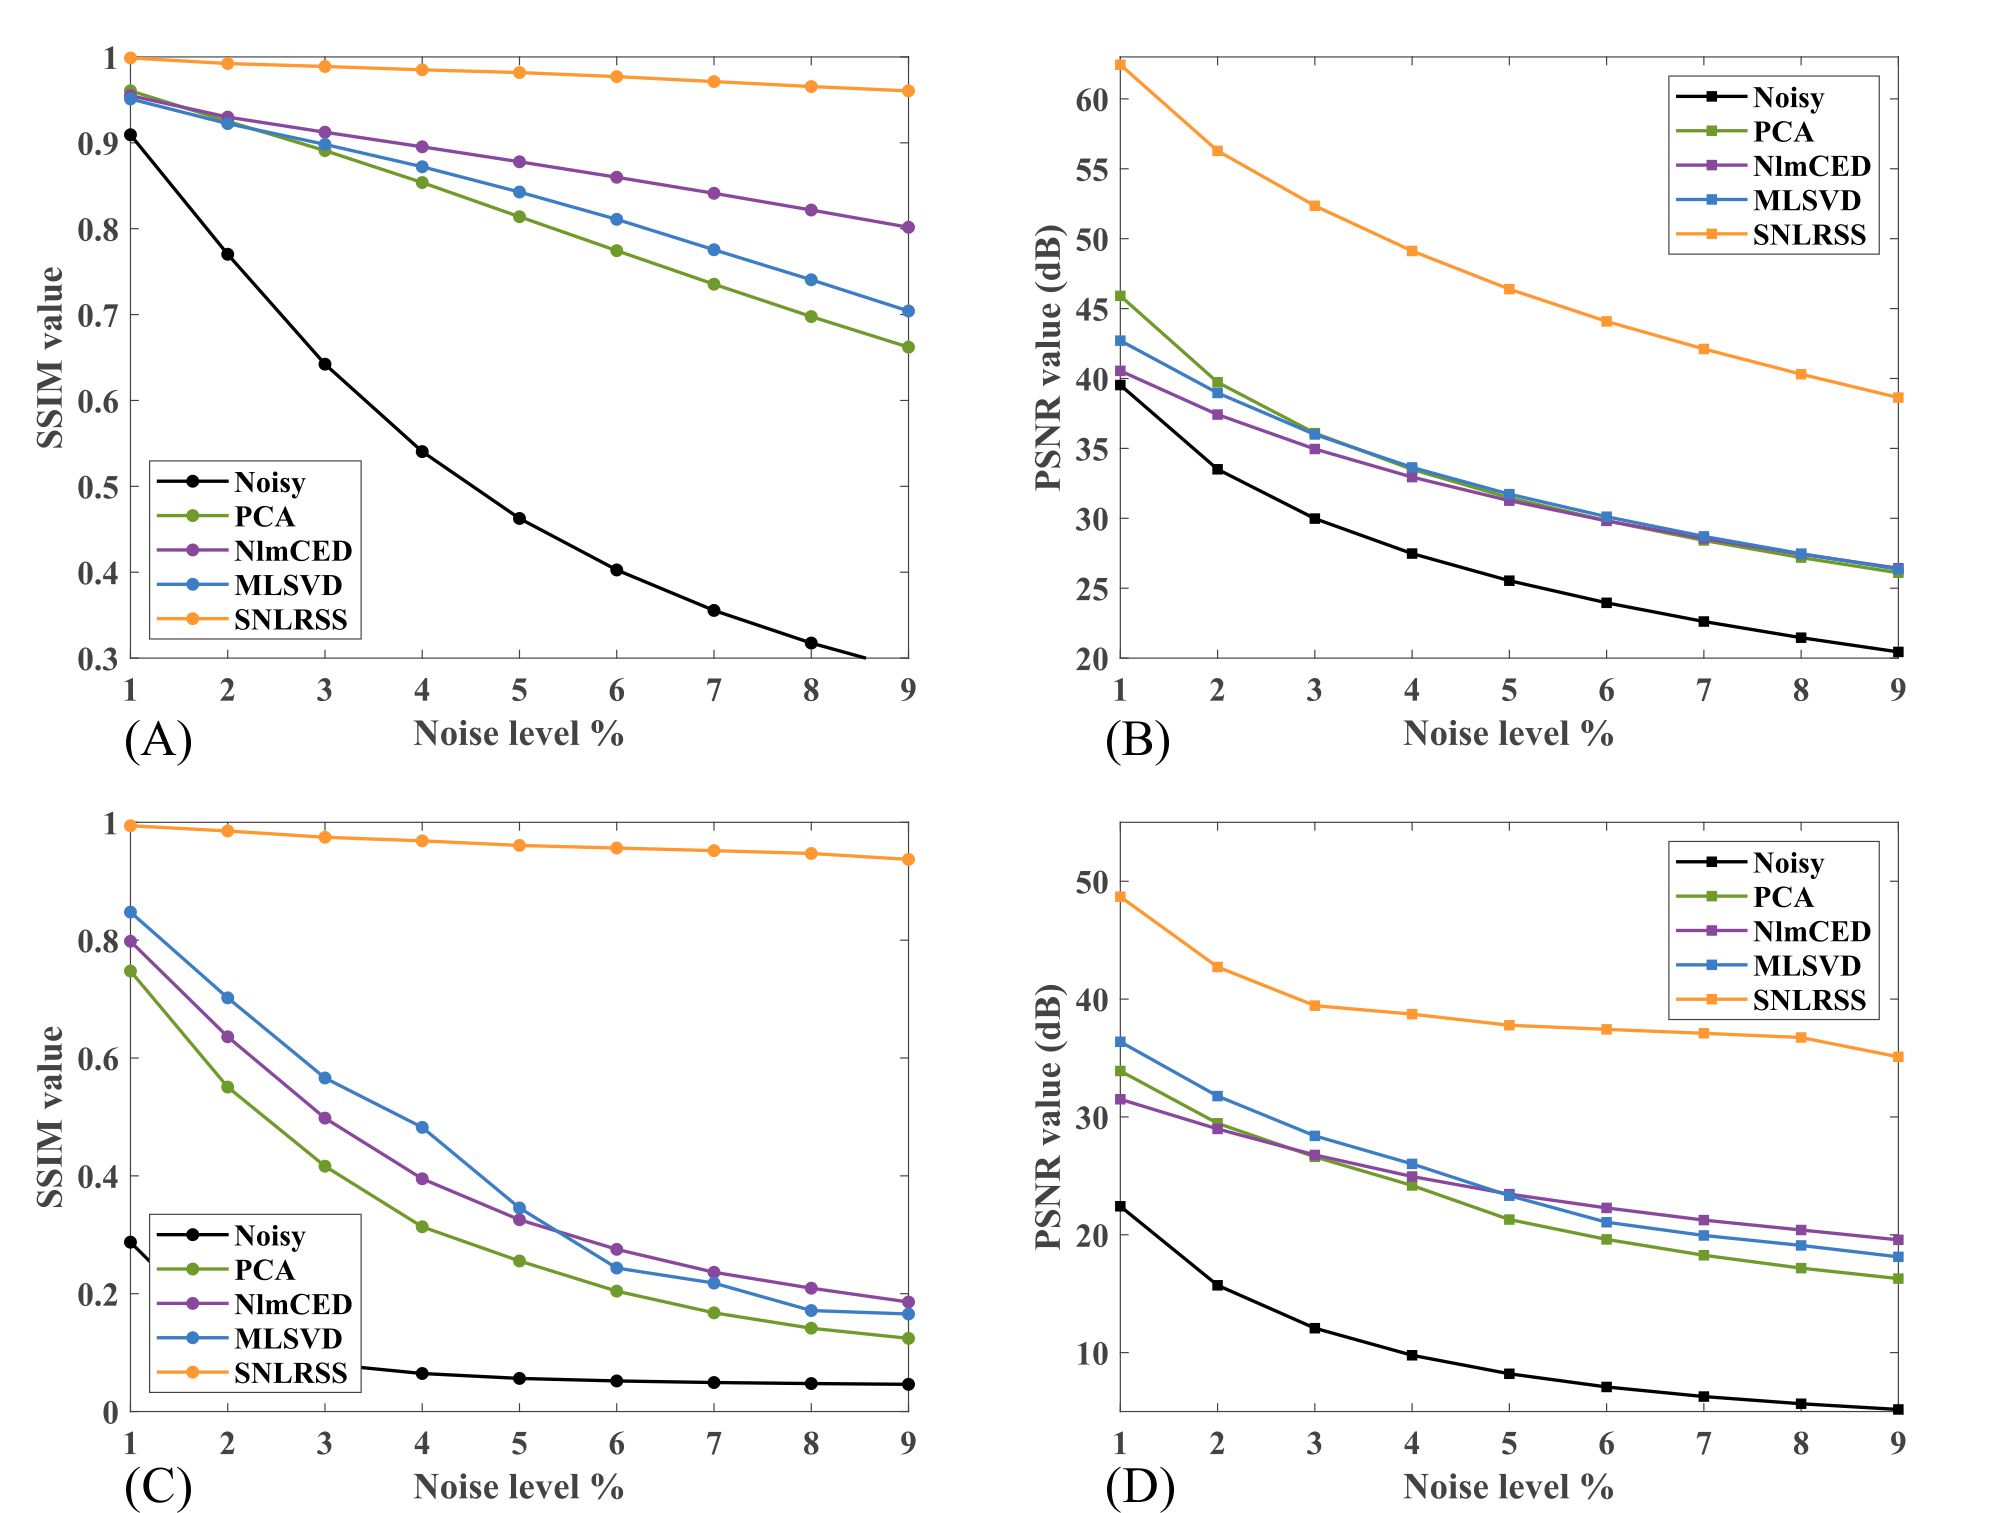
SSIM and PSNR were used to objectively evaluate the performance of different denoising methods on simulated CEST images with different additional noise levels. From Figure 4, SNLRSS outperformed the other methods due to the utilization of more prior information. Satisfactory result can be achieved by SNLRSS even under strong noise level (e.g. 9%).
Conclusion
In this study, a subspace denoising method with non-local low-rank constraint and spectral-smoothness regularization is proposed for CEST MRI. The performance of the proposed method was validated by the simulated and in vivo mouse experiments. By incorporating more prior information, the proposed method can achieve better performance in noise reduction compared to the other state-of-the-art methods, hence improving the sensitivity and accuracy of CEST MRI. The improved sensitivity without extending the total scan duration will facilitate the applications of CEST imaging in the mechanistic understanding on progressive developments of metabolic alterations in different diseases and in monitoring preclinical therapeutic trials.Acknowledgements
This work is supported by Science and Technology Project of Fujian Province, grant number 2022J05013. The authors thank Dr. Yu Yang for valuable discussions.References
1. Ward KM, Aletras AH, Balaban RS. A new class of contrast agents for MRI based on proton chemical exchange dependent saturation transfer (CEST). J Magn Reson 2000;143(1):79-87.
2. Zhou J, et al. Review and consensus recommendations on clinical APT-weighted imaging approaches at 3T: Application to brain tumors. Magn Reson Med 2022;88(2):546-574.
3. Zaiss M. CEST-sources.org. https://www.cest-sources.org/doku. php. Accessed March 11, 2019.
4. Chen L, Schar M, Chan KWY, et al. In vivo imaging of phosphocreatine with artificial neural networks. Nat Commun. 2020;11:1072
Figures
Figure
1. The flowchart of SNLRSS.
Figure
2. Denoising
results of numerical simulation. (A) The original CEST image at 2 ppm. The ROI
circumscribed by the red square is selected for extracting Z-spectrum. (B) The
reference Z-spectrum without noise. (C) The reference Rexch map. (D)
The noisy Rexch map after adding 1% Rician noise. The denoised Z
spectrum obtained by PCA(E), NlmCED(F), MLSVD(G), and SNLRSS(H), respectively.
The Rexch map obtained by PCA(I), NlmCED(J), MLSVD(K), and
SNLRSS(L). The difference Rexch map for PCA(M), NlmCED(N), MLSVD(O),
and SNLRSS(P).
Figure
3. Denoising
results for in vivo ischemic stroke mouse experiment. (A) ADC map. (B) CEST
image at 2 ppm. (C-D) The reference (C) and noisy (D) Rexch map contaminated
by 1% Rician noise. The denoised Rexch map using PCA(E), NlmCED(F),
MLSVD(G), and SNLRSS(H). Bland-Altman plots between the reference and the
denoising results obtained by PCA (I), NlmCED (J), MLSVD (K) and SNLRSS (L).
Figure
4. Quantitative evaluation of the denoising
methods for the simulated data with several noise levels. The mean SSIM (A) and
PSNR (B) values of CEST images corresponding to different methods. The SSIM (C)
and PSNR (D) values of CrCEST Rexch map corresponding to different methods.
DOI: https://doi.org/10.58530/2023/2995