2993
The exchange rates of protein guanidinium protons in the mouse brain1Biomedical Engineering, Johns Hopkins University, Baltimore, MD, United States, 2F.M. Kirby Research Center for Functional Brain Imaging, Kennedy Krieger Research Institute, Baltimore, MD, United States, 3Russell H. Morgan Department of Radiology and Radiological Science, Johns Hopkins University, Baltimore, MD, United States, 4Department of Electronic Science, Fujian Provincial Key Laboratory of Plasma and Magnetic Resonance, Xiamen University, Xiamen, China
Synopsis
Keywords: CEST & MT, Alzheimer's Disease, GuanCEST
We develop a novel two-step multi-B1 Bloch-McConnell fitting approach for calculating the exchange rate of CEST protons in vivo, and apply it to guanidinium protons, the exchange rate of which is 70.1 ± 5.5 s-1 with a concentration of 40.4 ± 5.2 mM in mouse brain at an optimized B1 of 0.8 µT. Guanidinoacetate N-methyltransferase deficiency (GAMT-/-) mice that have low creatine and phosphocreatine concentrations in brain are studied for protein guanidinium, i.e., arginineCEST (ArgCEST). The low exchange rate of ArgCEST suggests that the inverse pH dependence in GuanCEST with low B1 is dominated by CrCEST compared to ArgCEST.
Purpose
Guanidinium (Guan) CEST was reported in creatine (Cr) phantoms (1-3), muscle (4-7), and brain, the Z-spectrum of which at 2 ppm also includes phosphocreatine (PCr) and endogenous mobile proteins (8-12). We name the GuanCEST signal from proteins as arginine CEST (ArgCEST), and from Cr as CrCEST. The optimum acquisition and quantification of GuanCEST contrasts usually require the exchange rate, while it has never been reported previously. Particularly, the exchange rate of ArgCEST is critical in understanding its pH and B1 dependence at 2 ppm (8, 13-15), but it is almost impossible to separate it from CrCEST at 2 ppm conventionally. Our two-step multi-B1 Bloch-McConnell (BM) fittingmethod fills in the long-standing blank for the GuanCEST proton pool exchange rate in vivo, and the ArgCEST exchange rate is calculated in the Cr-deficient GAMT-/- mice.Methods
Our novel two-step multi-B1 BM fitting method follows the principle of PLOF method (7, 10, 16, 17). Three pools, i.e., water, magnetization transfer contrast (MTC) and CEST, are assumed. For the macromolecular MTC pool, the transverse components are neglected due to their extremely short T2 (~10 µs) (18). A symmetric Lorentzian lineshape is used for the MTC pool in the downfield Z-spectrum.For phantom validation, the exchange rate of the CrCrossBSA phantoms (50 mM Cr mixed with 15% cross-linked BSA) was measured on a Bruker 17.6T NMR spectrometer using the selective recovery method (7, 19).
Four 3-month Guanidinoacetate N-methyltransferase deficiency (GAMT-/-) mice were scanned. All MRI experiments were performed on a horizontal bore 11.7 T Bruker Biospec system with a 72 mm quadrature volume resonator and a 2x2 phased array coil. The pre-saturation time was 2 s for all CEST experiments. Seven B1 values were collected for the CrCrossBSA phantom (0.4, 0.6, 0.8, 1.0, 1.2, 1.4 and 1.6 µT), while eight B1 values were used for the mouse brain (0.5 µT added). We used continuous wave (CW) CEST labeling with a train of 2D UTE readout modules (20-23), dubbed as presaturation radial CEST (preRadCEST). The matrix size was 96×96 with a slice thickness of 2 mm. The creatine and phosphocreatine concentrations in the brain of GAMT-/- mouse was confirmed to be low by in vivo MRS.
Results and Discussion
Matched well with the MRS result (Fig. 1a: 106 ± 8 s-1), CrCEST phantom is determined with an exchange rate of 104.7 ± 6.0 s-1 by the two-step multi-B1 BM fitting (Fig. 1b), and a concentration of 46.8 ± 5.0 mM (50 mM used), T2 of 18.3 ± 2.0 ms. The CrCEST signal as a function of B1 in Fig. 1c shows a peak at 0.8 µT. After verification in the phantom, the fitting method is applied to the whole brain of GAMT-/- mice (Fig. 2a), getting an exchange rate of 70.1 ± 5.5 s-1, a concentration of 40.4 ± 5.2 mM and T2s of 3.9 ± 0.5 ms. The optimum saturation power for ArgCEST is 0.8 µT according to Fig. 2b. The exchange rate of CrCEST can be estimated as 150-400 s-1 from Fig. 2c, as we know the optimum B1 of 1.0-1.2 µT for in vivo CrCEST (10, 17, 24), and the simulations of larger exchange rates result in larger optimum B1. Therefore, the exchange rate of ArgCEST is much smaller than that of CrCEST in the physiological pH range, which allows the selective enhancement of the CrCEST signal in the mouse brain by applying high saturation powers.The GuanCEST signal as a function of exchange rate simulated with BM equations (Fig. 2c) for four typical B1values (0.5, 1, 2 and 3 µT) explains the positive or negative correlation between GuanCEST signal and pH under high or low B1 in mouse brain. As shown in Fig. 2c, the CEST signal goes down when the exchange rate goes up above the Rabi frequency (red arrows in Fig. 2c) (25, 26). At low B1, e.g., 0.5 µT, the CrCEST exchange rate is above while the ArgCEST is below the Rabi frequency (134 s-1). Therefore, CrCEST shows negative and ArgCEST shows positive pH dependence. It suggests that CrCEST dominates the inverse pH dependence of GuanCEST at low B1. At high B1, e.g., 2.0 µT, both ArgCEST and CrCEST exchange rates are below the Rabi frequency (532 s-1) and hence adding up the response to pH change, which also explains the strong pH dependence found in mouse brain with B1 = 2.0 µT (14, 15).
Conclusion
We used a two-step multi-B1 BM fitting method to obtain the exchange rate and concentration of ArgCEST in the GAMT-/- mouse brain. This approach can be generalized for other CEST quantitation and optimizations, helping develop the in vivo CEST ratiometric approach for pH imaging.Acknowledgements
The authors thank Drs. Dirk Isenbrandt, Robert Weiss, and Michelle Leppo for creating and providing the GAMT-/- mice.References
1. Sun PZ, Farrar CT, Sorensen AG. Correction for artifacts induced by B(0) and B(1) field inhomogeneities in pH-sensitive chemical exchange saturation transfer (CEST) imaging. Magn Reson Med. 2007; 58(6):1207-15. doi:10.1002/mrm.21398
2. Sun PZ, Benner T, Kumar A, et al. Investigation of optimizing and translating pH-sensitive pulsed-chemical exchange saturation transfer (CEST) imaging to a 3T clinical scanner. Magn. Reson. Med. 2008; 60(4):834-41. doi:10.1002/mrm.21714
3. Haris M, Nanga RP, Singh A, et al. Exchange rates of creatine kinase metabolites: feasibility of imaging creatine by chemical exchange saturation transfer MRI. NMR Biomed. 2012; 25(11):1305-9. doi:10.1002/nbm.2792
4. Kogan F, Singh A, Cai K, et al. Investigation of chemical exchange at intermediate exchange rates using a combination of chemical exchange saturation transfer (CEST) and spin-locking methods (CESTrho). Magn Reson Med. 2012; 68(1):107-19. doi:10.1002/mrm.23213
5. Kogan F, Haris M, Debrosse C, et al. In vivo chemical exchange saturation transfer imaging of creatine (CrCEST) in skeletal muscle at 3T. J Magn Reson Imaging. 2014; 40(3):596-602. doi:10.1002/jmri.24412
6. Kogan F, Haris M, Singh A, et al. Method for high-resolution imaging of creatine in vivo using chemical exchange saturation transfer. Magn Reson Med. 2014; 71(1):164-72. doi:10.1002/mrm.24641
7. Chen L, Schar M, Chan KWY, et al. In vivo imaging of phosphocreatine with artificial neural networks. Nat Commun. 2020; 11(1):1072. doi:10.1038/s41467-020-14874-0
8. Jin T, Wang P, Hitchens TK, et al. Enhancing sensitivity of pH-weighted MRI with combination of amide and guanidyl CEST. Neuroimage. 2017; 157:341-50. doi:10.1016/j.neuroimage.2017.06.007
9. Zhang XY, Xie J, Wang F, et al. Assignment of the molecular origins of CEST signals at 2 ppm in rat brain. Magn Reson Med. 2017; 78(3):881-7. doi:10.1002/mrm.26802
10. Chen L, Zeng H, Xu X, et al. Investigation of the contribution of total creatine to the CEST Z-spectrum of brain using a knockout mouse model. NMR Biomed. 2017; 30(12):e3834. doi:10.1002/nbm.3834
11. Zhou IY, Lu D, Ji Y, et al. Determination of multipool contributions to endogenous amide proton transfer effects in global ischemia with high spectral resolution in vivo chemical exchange saturation transfer MRI. Magn Reson Med. 2019; 81(1):645-52. doi:10.1002/mrm.27385
12. Sui R, Chen L, Li Y, et al. Whole-brain amide CEST imaging at 3T with a steady-state radial MRI acquisition. Magn. Reson. Med. 2021; 86(2):893-906.
13. Cui J, Afzal A, Zu Z. Comparative evaluation of polynomial and Lorentzian lineshape-fitted amine CEST imaging in acute ischemic stroke. Magn Reson Med. 2022; 87(2):837-49. doi:10.1002/mrm.29030
14. Chen L, Van zijl P, Wei Z, et al. Early detection of Alzheimer’s disease using creatine chemical exchange saturation transfer magnetic resonance imaging. NeuroImage. 2021; 236:118071.
15. Chen L, Cao S, Koehler RC, et al. High-sensitivity CEST mapping using a spatiotemporal correlation-enhanced method. Magn Reson Med. 2020; 84(6):3342-50. doi:10.1002/mrm.28380
16. Chen L, Wei Z, Cai S, et al. High-resolution creatine mapping of mouse brain at 11.7 T using non-steady-state chemical exchange saturation transfer. NMR Biomed. 2019; 32(11):e4168. doi:10.1002/nbm.4168
17. Chen L, Barker PB, Weiss RG, et al. Creatine and phosphocreatine mapping of mouse skeletal muscle by a polynomial and Lorentzian line-shape fitting CEST method. Magn Reson Med. 2019; 81(1):69-78. doi:10.1002/mrm.27514
18. Henkelman RM, Huang X, Xiang QS, et al. Quantitative interpretation of magnetization transfer. Magn Reson Med. 1993; 29(6):759-66. doi:10.1002/mrm.1910290607
19. Zhou J, Wilson DA, Sun PZ, et al. Quantitative description of proton exchange processes between water and endogenous and exogenous agents for WEX, CEST, and APT experiments. Magn Reson Med. 2004; 51(5):945-52. doi:10.1002/mrm.20048
20. Chen L, Wei Z, Chan KWY, et al. Protein aggregation linked to Alzheimer's disease revealed by saturation transfer MRI. Neuroimage. 2018; 188:380-90. doi:10.1016/j.neuroimage.2018.12.018
21. Zhou Y, van Zijl PCM, Xu X, et al. Magnetic resonance imaging of glycogen using its magnetic coupling with water. Proc Natl Acad Sci U S A. 2020; 117(6):3144-9. doi:10.1073/pnas.1909921117
22. Dixon WT, Hancu I, Ratnakar SJ, et al. A multislice gradient echo pulse sequence for CEST imaging. Magn. Reson. Med. 2010; 63(1):253-6. doi:10.1002/mrm.22193
23. Du J, Takahashi AM, Bydder M, et al. Ultrashort TE imaging with off-resonance saturation contrast (UTE-OSC). Magn. Reson. Med. 2009; 62(2):527-31. doi:10.1002/mrm.22007
24. Chung JJ, Jin T, Lee JH, et al. Chemical exchange saturation transfer imaging of phosphocreatine in the muscle. Magn Reson Med. 2019; 81(6):3476-87. doi:10.1002/mrm.27655
25. Jin T, Kim SG. Approximated analytical characterization of the steady-state chemical exchange saturation transfer (CEST) signals. Magn Reson Med. 2019; 82(5):1876-89. doi:10.1002/mrm.27864
26. Zong X, Wang P, Kim SG, et al. Sensitivity and source of amine-proton exchange and amide-proton transfer magnetic resonance imaging in cerebral ischemia. Magn Reson Med. 2014; 71(1):118-32. doi:10.1002/mrm.24639
Figures
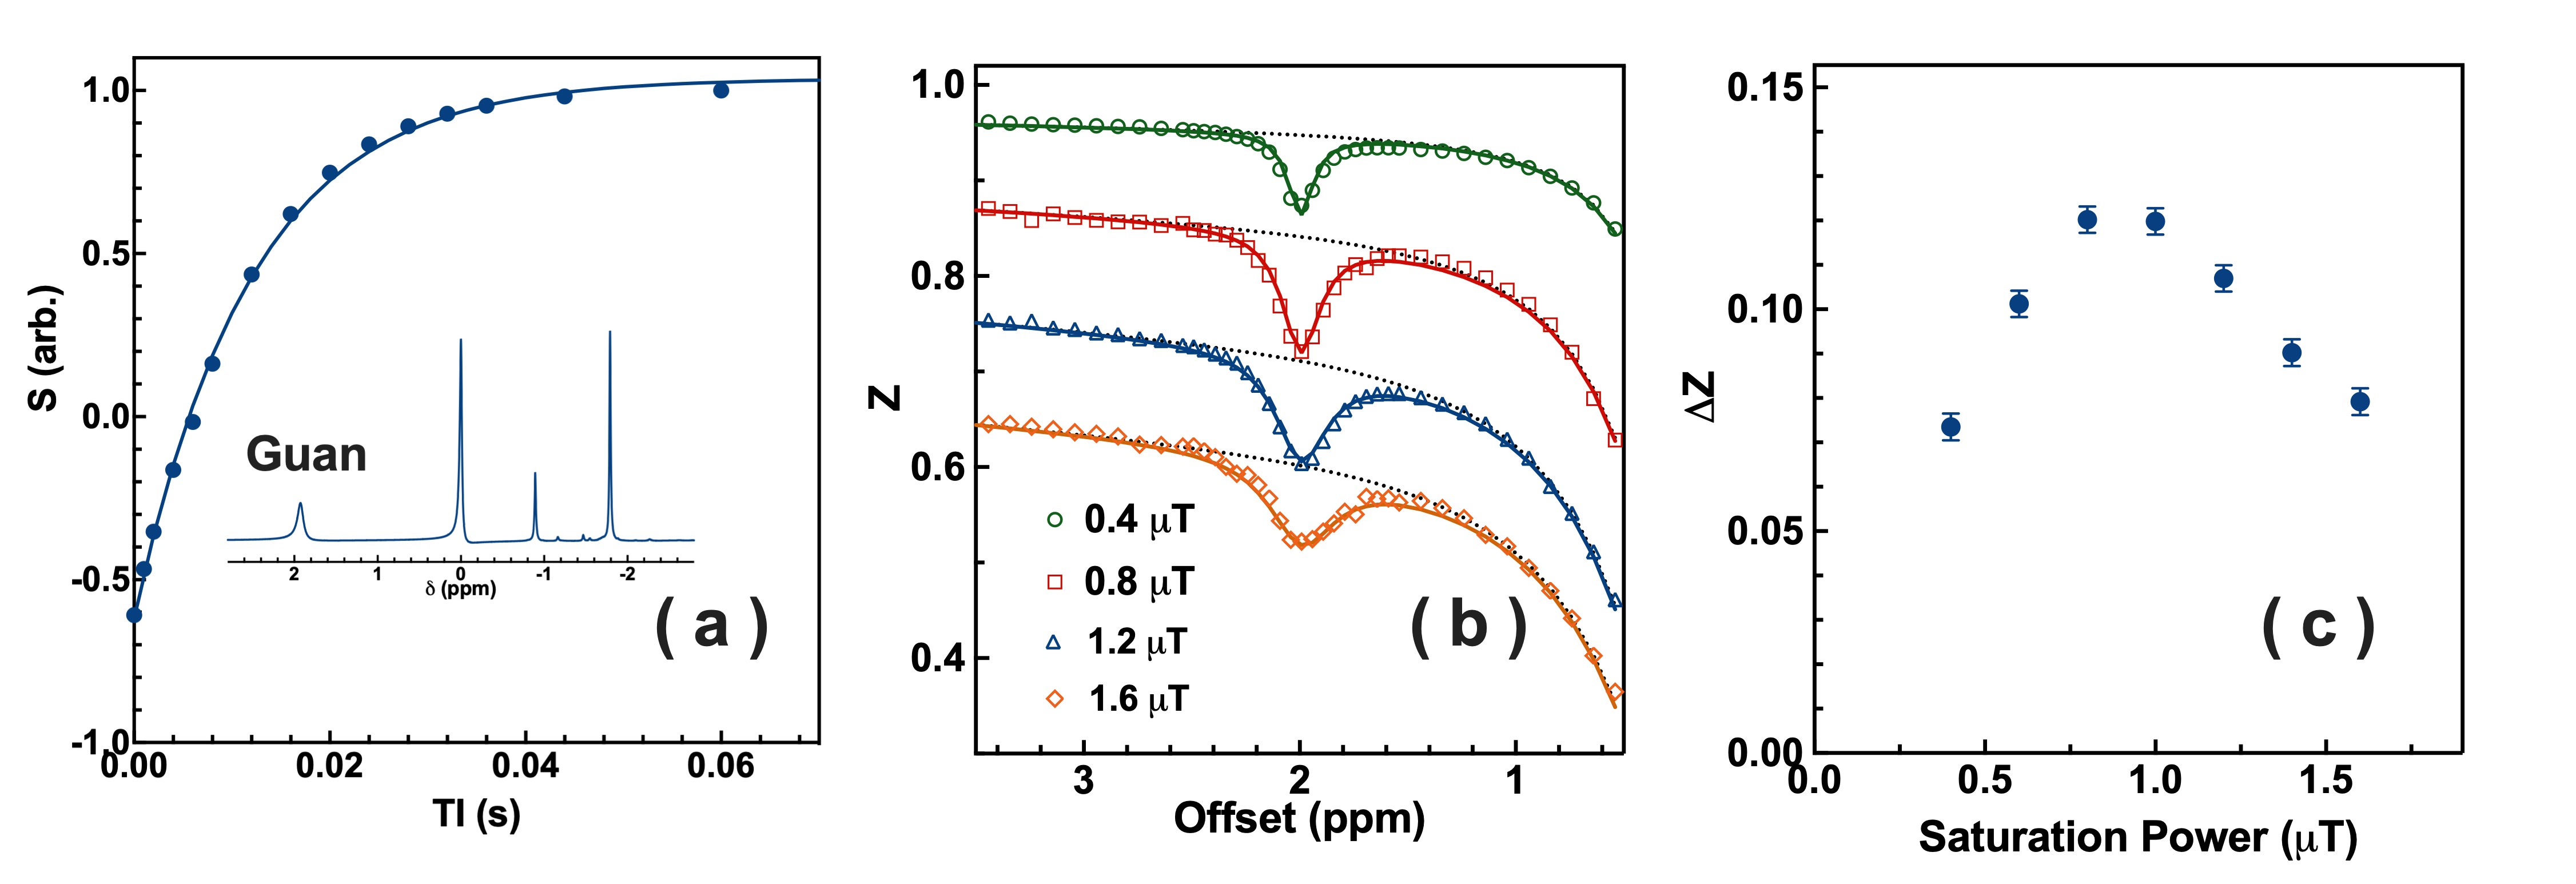
Figure 1. (a) The inversion recovery curve of peaks at 1.92 ppm (Guan) of Cr in CrCrossBSA phantom. The curve was fitted by a single exponential curve. Inset: typical 1D NMR spectrum of CrCrossBSA phantom. (b) Typical Z-spectrum of the GuanCEST region recorded with various B1 and an illustration of the two-step mutli-B1 BM fitting (R2=0.995). The black dashed lines are the background Z-spectrum, while the solid lines are fitted CrCEST curves with water and MTC background fixed. (c) The B1-dependent CrCEST values for the CrCrossBSA phantom extracted with the two-step mutli-B1 BM fitting.
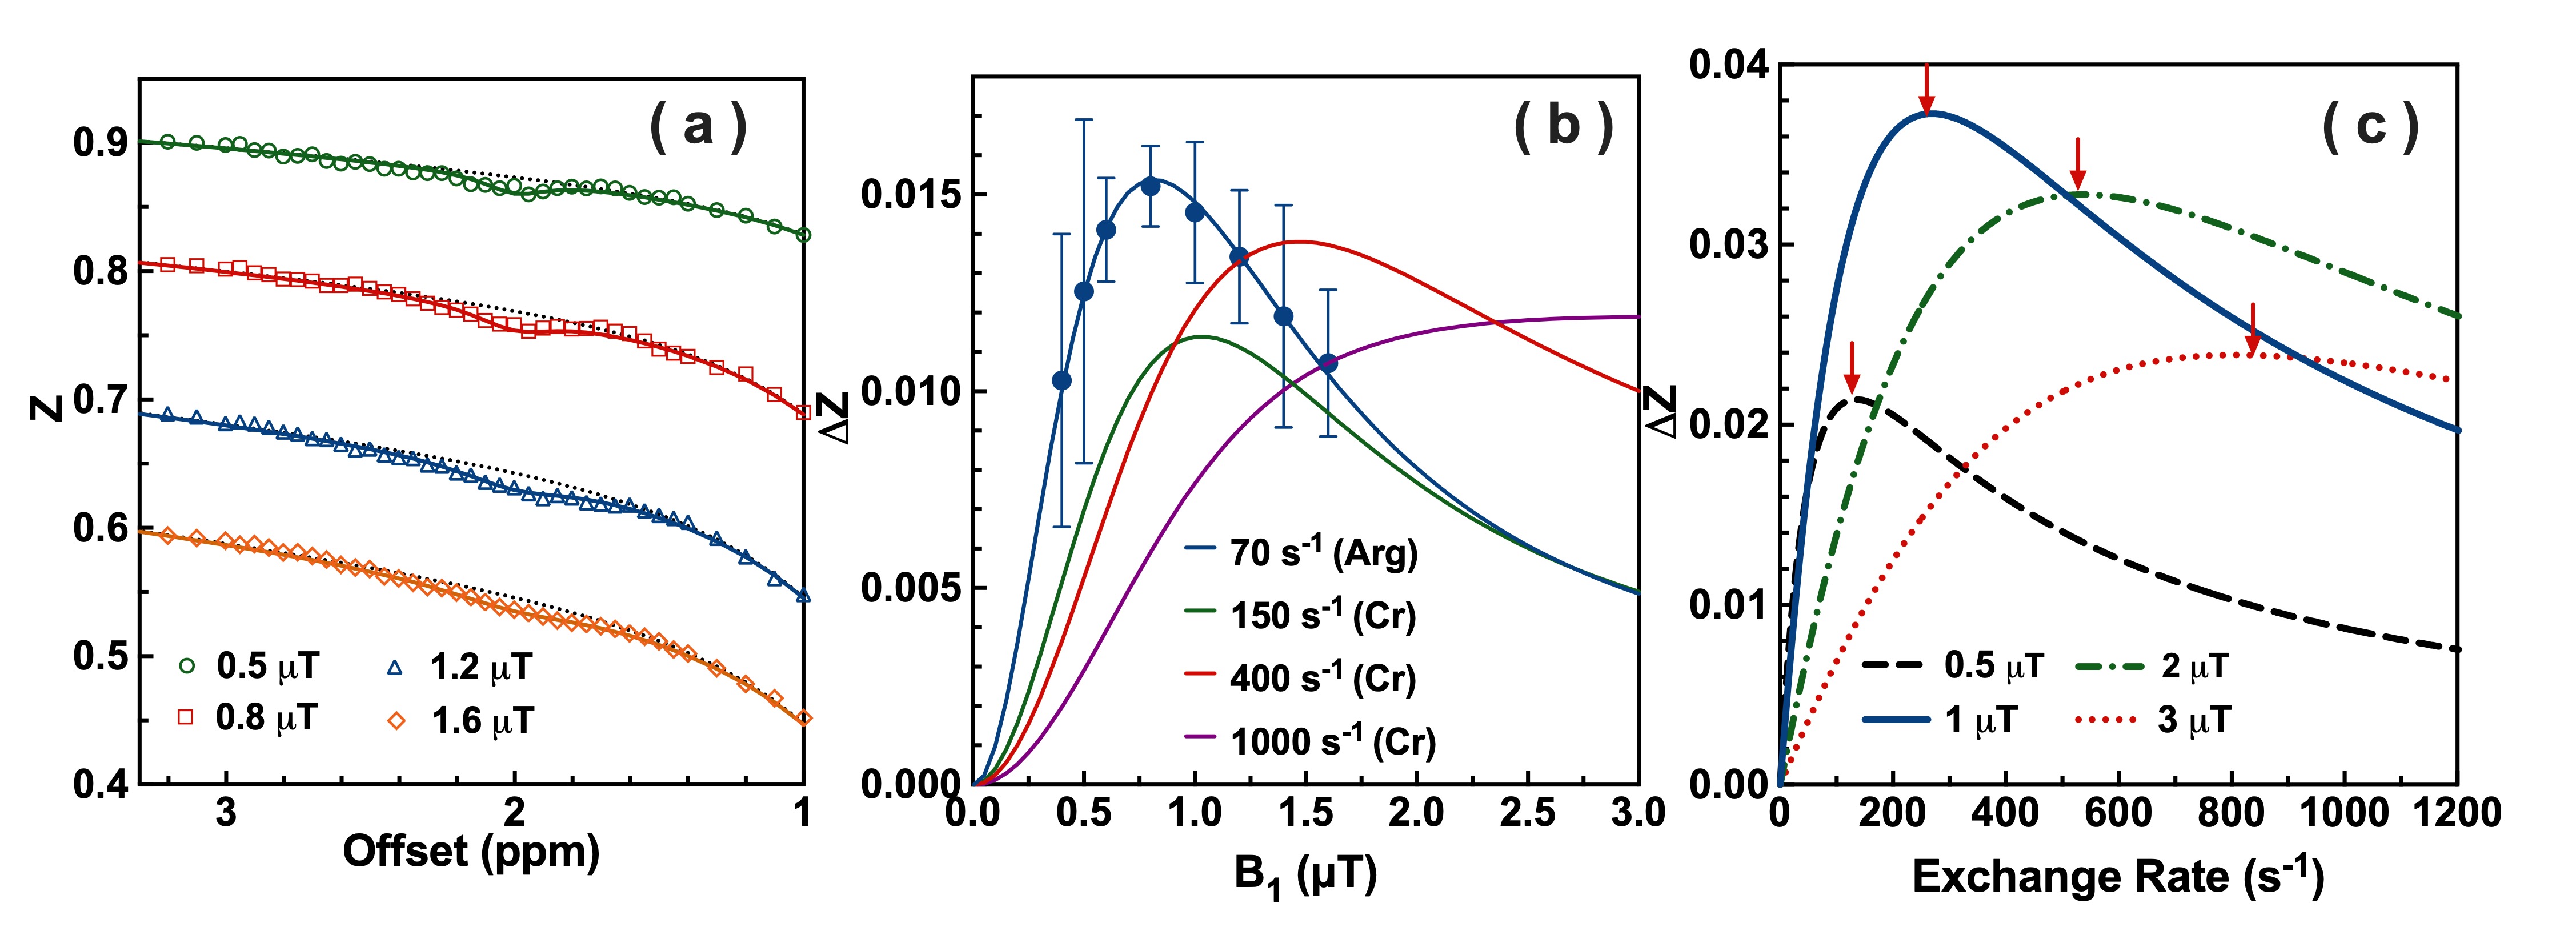
Figure 2. (a) Averaged Z-spectrum for the GAMT-/- mice with the two-step mutli-B1 BM fitting curves. Dash lines are MTC background, with solid lines as CEST fitting. (b) The averaged saturation power dependent ArgCEST values at 2 ppm. Simulated curves for both ArgCEST and CrCEST with different exchange rates and concentrations, i.e., 59.0 s-1(11.9 mM) for Arg, 250 s-1 (5 mM), 500 s-1 (5 mM) and 1000 s-1 (5 mM) for Cr. (c) The simulated exchange rate dependent GuanCEST signal. The Rabi frequencies are labeled with red arrows, i.e., 134 s-1 (0.5 µT), 268 s-1 (1 µT), 538 s-1 (2 µT), 806 s-1 (3 µT).