2989
Z-spectral fitting for fat-correction of APT/CEST-MRI including fat-suppression pulses to improve body applications1Philips Research, Hamburg, Germany, 2Philips Healthcare, Gainesville, FL, United States, 3Department of Radiology, University of Texas Southwestern Medical Center, Dallas, TX, United States, 4Advanced Imaging Research Center, University of Texas Southwestern Medical Center, Dallas, TX, United States
Synopsis
Keywords: CEST & MT, Fat, Z-spectral fitting, Fat suppression pulses
Fat signal correction remains a challenge in APT/CEST-MRI for body-oncology. We show that signal background models that include direct water saturation, MT-effect, and modified fat spectra can be fitted to Z-spectra acquired with/without fat-suppression. APT/CEST signals are then extracted as the residual from the background fit (APT#). The model for fat-suppressed spectra uses a mirrored fat contribution. After B0-correction, 5 model parameters are sufficient. This allows for the acquisition of clinically feasible protocols using less than 20 Z-spectral offsets. Fat-suppression potentially increases the precision of APT# imaging by lowering the initial fat contribution.
INTRODUCTION
APT/CEST-MRI has shown promising applications in neuro-oncology and translation to body-oncology is ongoing1, however, robustness is compromised with fat-signals as main error source2. To extract CEST effects (1-5%), fat-correction3,4 needs to be precise to <1%. For APT/CEST-MRI, combined RF-saturation and SPIR fat-suppression (selective π-pulse) increases signal intensity near the fat-frequency (relative to non-saturated S0, Fig.2d). With the fat-signal saturated near -3.3ppm, the SPIR inversion pulse has no effect, and fat-signal reappears via saturation recovery. We observed that the signal near the fat frequency closely follows the mirrored line shape of a multi-peak fat model and investigate, if this line shape in combination with direct water saturation (DWS) and MT could be favorably used for background fitting.METHODS
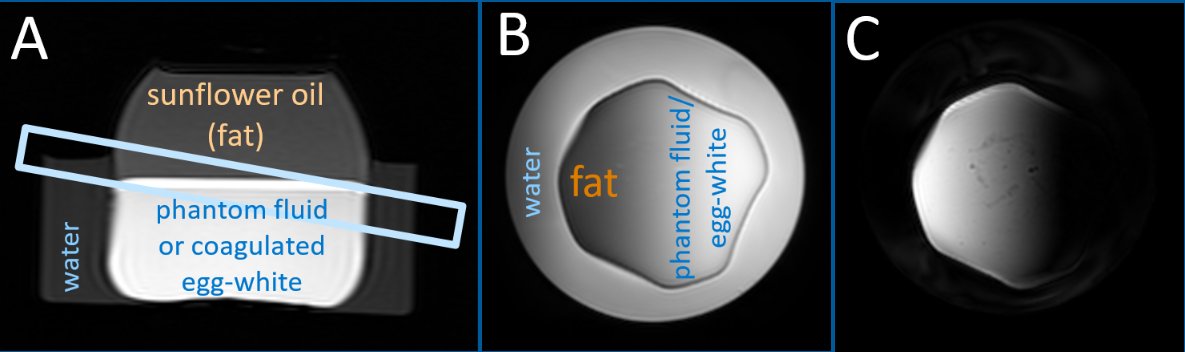
Phantom tests were performed at 3T with dual-channel RF-transmission (Ingenia, Philips, NL) using a 16-channel head-coil and 2nd-order B0-shimming. Two phantoms were used with sunflower-oil on top and (1) phantom fluid (water+0.8g/l CuSO4,T1=450ms, no APT-effect) or (2) egg-white (APT-effect), coagulated (10min at 60°C) to obtain MT-effects. An oblique slice provided a range of fat contents (Fig.1).For saturation, 40×50ms pulses were alternatingly transmitted via the RF-channels (100% duty-cycle), with Tsat=2s and B1,rms=2μT. A single-shot 2D fast-spin echo sequence with/without SPIR fat-suppression was used with FOV=(160mm)2, voxel size 1.2×1.2×8mm3, TR/TE=5700/7.0ms, FA=90°, 120° refocusing, centric k-space-ordering, and (i) N=42 equidistant frequency offsets, 0.4ppm steps, range -8..8ppm, acquisition time Tacq=4min, or (ii) N=17 offsets: {-1560(S0),±7.8,±6.3,±5.1,±3.9,±2.9,±1.8,±0.9,±0.3}ppm, Tacq=2min. A 3-point multi-acquisition GRE-Dixon sequence, same geometry and TE, was used for B0 mapping: TR=14 ms, ΔTE=0.6 ms, FA=35°, 8 averages, Tacq=45s. Z-spectra were interpolated to (i)126/(ii)100 points including B0-correction. Two fitting models including Lorentzian (DWS) and Gaussian (MT) components were used with/without SPIR fat-suppression, with “-” or “+” sign for the fat contribution in Eq.1, respectively.
$$S_{model}(f)=S_0-\mid A_L \frac{w_L^2}{f^2+w_L^2}+A_G\frac{1}{\sqrt{2\pi}w_G}\ e^{\large{-\frac{1}{2}(\frac{f}{w_G})^2}} \pm A_F\ \sum_{l=1}^{N_l}\frac{w_F^2}{(f-f_l)^2+w_F^2}\ e^{-2\pi i f_l \ T\small{E}} \mid \ \ \ [1]$$
5 parameters were fitted: AL, AG, AF (amplitudes) and wL, wG (Lorentzian/Gaussian width). Fixed fat linewidths wF=110 Hz and fat frequencies fl (Nl=7 lines) were used, similar to common multi-peak Dixon water-fat separation. After B0-correction, centered distributions can be assumed. 11 interpolated points were selected for fitting: {±7.0,±4.5,-3.4,-2.3, ±1.3,-0.9,±0.3}ppm, explicitly excluding the range of amide (or amine) CEST effects [+1.3…+4.5ppm]. APT/CEST signals are extracted as APT#(+3.5ppm) as residuals from the background fit, similar to extrapolated MT reference (EMR) fitting5. NOE#(-3.5ppm) serves as quality check for the fit. Fitting was performed for each voxel with a custom-made ImageJ (imagej.nih.gov) plugin.
RESULTS
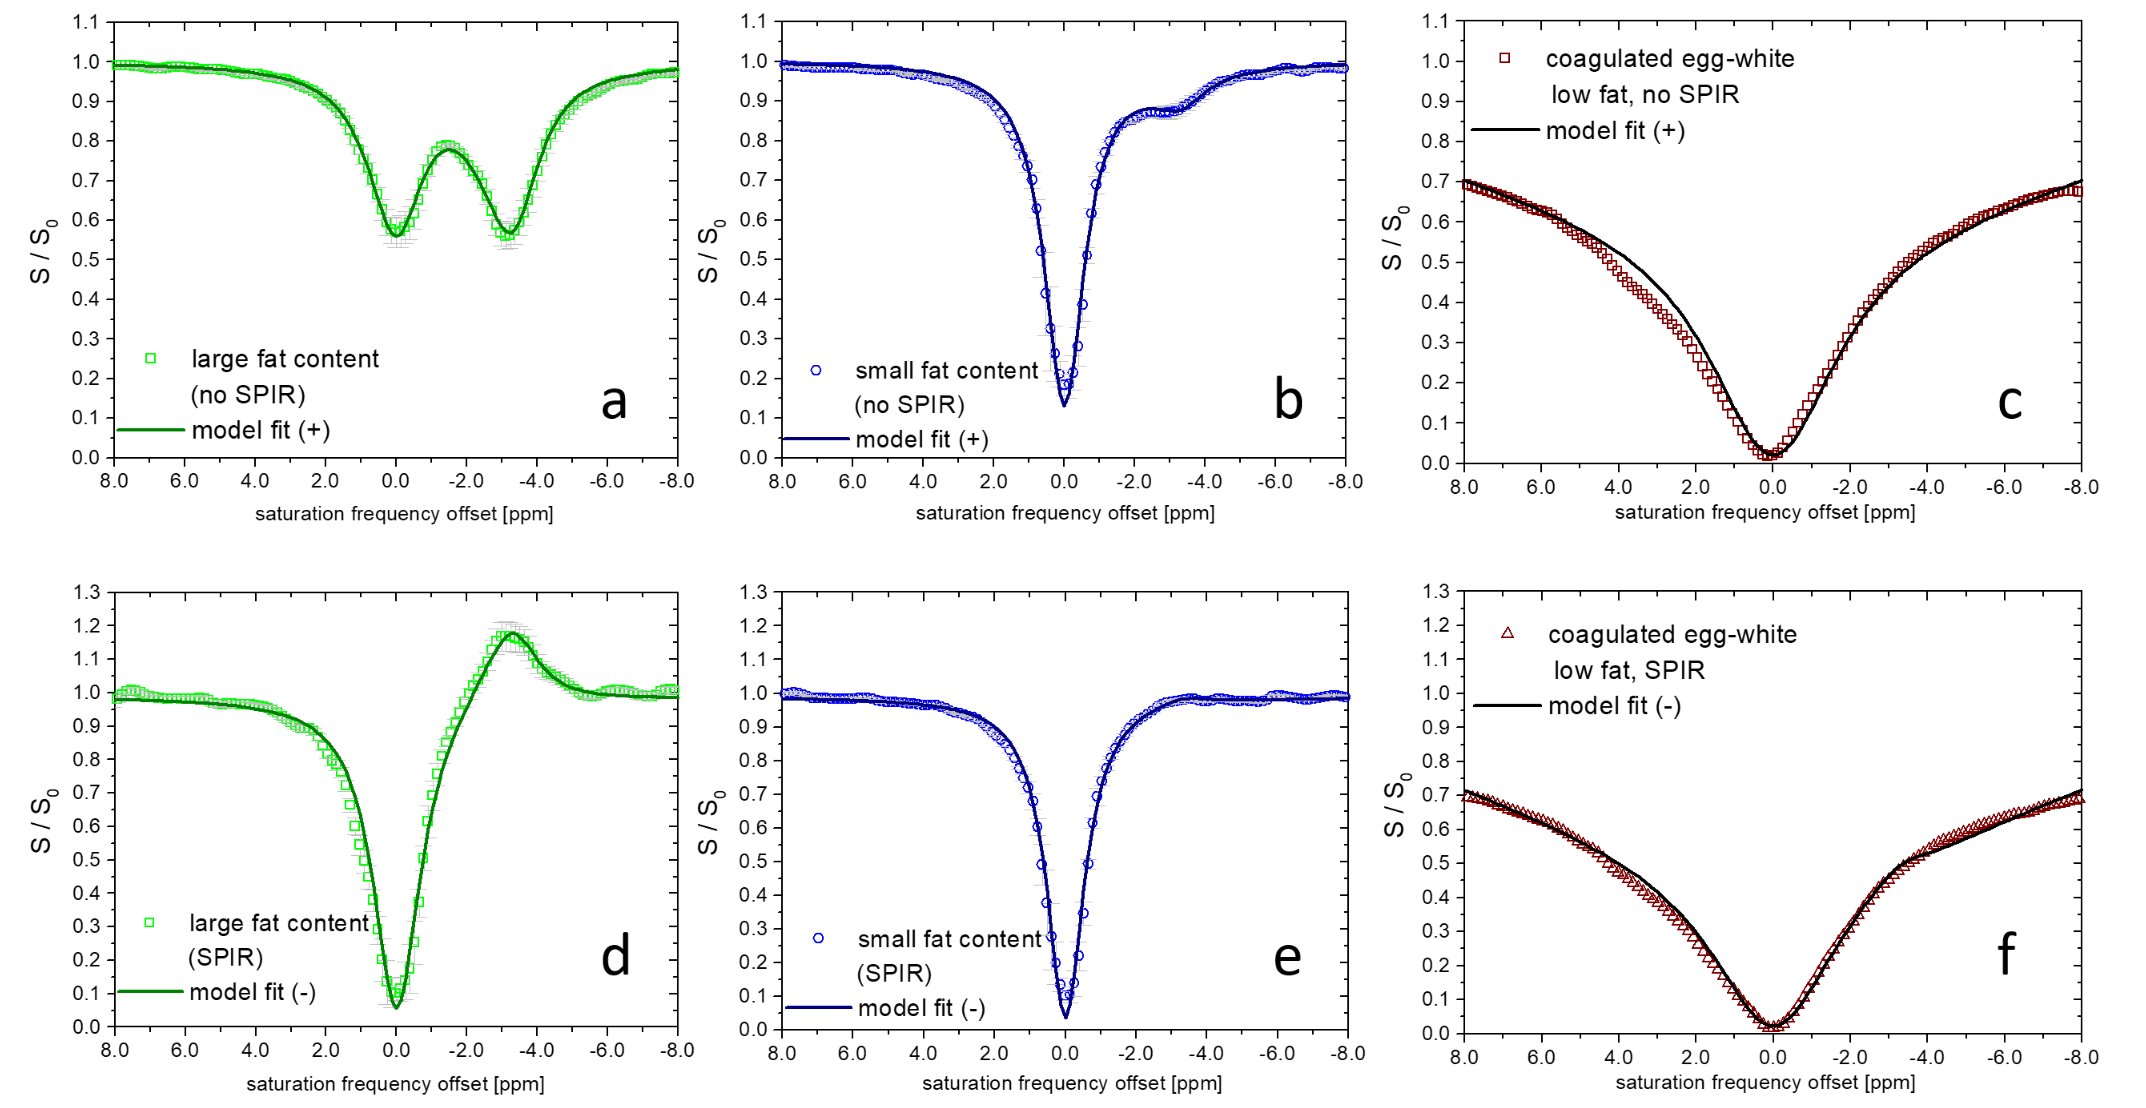
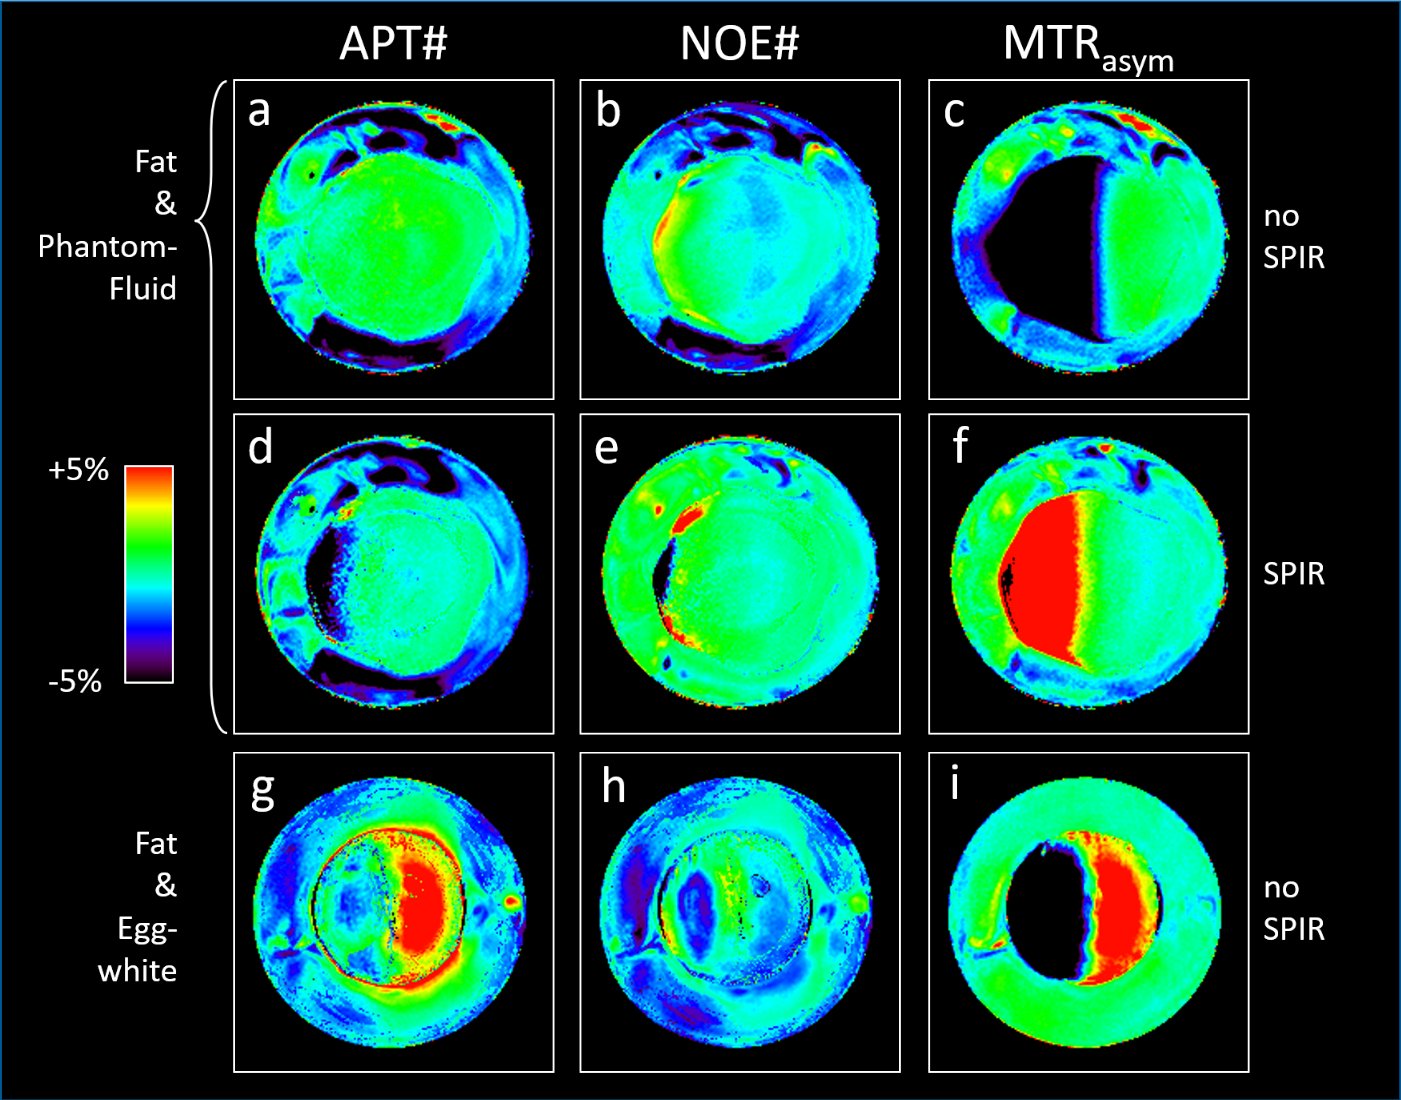
Fig.2 shows example Z-spectra, demonstrating that the model closely fits for various fat content (a/b/d/e), MT-background and APT-effect (c/f) without (a/b/c) and with SPIR fat-suppression (d/e/f). Similar data quality was obtained with protocol (ii) (N=17, data not shown). Without fat-suppression, the spectral shape is strongly altered depending on fat contents but well captured by the model (Fig.2a/b, in-phase TE). The APT-effect from egg-white proteins is visible as deviation between [+4…+2]ppm, excluded for fitting (2c). The MT-effect appears as broad attenuation, successfully modeled by the Gaussian component. Z-spectra with fat-suppression are precisely fitted including the signal overshoot near -3.3ppm (2d/e). Here, DWS amplitude/symmetry is hardly changed by fat effects. MT-effects are captured by the fit, while the APT signal is apparent as residual around 3.5ppm (2f). Some slight deviations are observed around -5 and -8ppm.Fig. 3 shows processed APT# (3a/d/g), NOE# (3b/e/h) and MTRasym (3c/f/i) images for phantom1 (3a-f) and phantom2 (3g-i), respectively, in a range of ±5%. While MTRasym shows negative contrast for fat without SPIR (3c/i), the signal overshoot leads to false hyperintensity (red) with SPIR (3f). APT# results show homogeneously low (green) values (3a). With SPIR, high fat content areas show some dropouts (3d). APT# is hyperintense in egg-white containing areas (3g). NOE# images show overall low values, except for some dropouts/hyperintensity for SPIR and high fat (3e).
DISCUSSION
The results largely confirm the experimental validity of the chosen fitting model with homogeneously low fit residuals for APT#/NOE# over a large range of fat fractions. To our knowledge it is the first use of a mirrored shape of the fat spectrum with fat-suppression. APT-effects can be obtained as residuals around 3.5ppm (APT#). Dropouts/hyperintensities with SPIR arise from low signal levels in high fat areas after fat-suppression impeding reliable fits. However, areas with large fat fractions (>90%) contain little CEST information and may be masked. Deviations at larger negative offsets (-5…-8ppm) indicate that fitting points >8ppm could be included to better separate fat from MT. Fat-saturation influences spectral lines differently but were negligible for in-phase TE. The fit model includes fat phase relations for different TE, but Z-spectra may be difficult to fit2. However, sequences with fat-suppression show smaller fat-amplitudes and no reduction of the DWS peak which may facilitate stable fitting, to be investigated further. While limited to 2D here, minimization of the acquired Z-spectral points and the addition of parallel imaging would enable 3D protocols in clinically acceptable times.CONCLUSION
We have proposed fitting models and protocols with/without SPIR to obtain fat-signal corrected APT# signals at various fat content and MT background levels. Z-spectral results from water/fat/APT/MT phantoms are promising. In vivo breast studies are underway to explore the applicability in body-oncology.Acknowledgements
Support by NIH grant 1R01CA252281-01A1.References
1. Gao T, Zou C, Li Y, Jiang Z, Tang X, Song X. A
Brief History and Future Prospects of CEST MRI in Clinical Non-Brain Tumor
Imaging. Int J Mol Sci. 2021 Oct 26;22(21):11559.
2. Zhang S, Keupp J, Wang X, Dimitrov I,
Madhuranthakam AJ, Lenkinski RE, Vinogradov E. Z-spectrum appearance and
interpretation in the presence of fat: Influence of acquisition parameters. Magn
Reson Med. 2018 May;79(5):2731-2737.
3. Keupp J, Vinogradov E, and Eggers H. Z-Spectral
Water-Fat Separation for APTw MRI in the Body using efficient Single-Echo
Acquisitions. Proc. ISMRM 27 (2019):146.
4. Zimmermann F, Korzowski A, Breitling J, Meissner
JE, Schuenke P, Loi L, Zaiss M, Bickelhaupt S, Schott S, Schlemmer HP, Paech D,
Ladd ME, Bachert P, Goerke S. A novel normalization for amide proton transfer
CEST MRI to correct for fat signal-induced artifacts: application to human
breast cancer imaging. Magn Reson Med. 2020 Mar;83(3):920-934.
5. Heo H-Y, Zhang Y, Burton TM, Jiang S,
Zhao Y, van Zijl PCM, Leigh R, Zhou J. Improving the Detection Sensitivity
of pH-Weighted Amide Proton Transfer MRI in Acute Stroke Patients Using
Extrapolated Semisolid Magnetization Transfer Reference Signals. Magn Reson Med. 78:871–880
(2017)
Figures