2988
The exchange rate of creatine CEST in mouse brain1Department of Biomedical Engineering, Johns Hopkins University, Baltimore, MD, United States, 2F.M. Kirby Research Center for Functional Brain Imaging, Kennedy Krieger Research Institute, Baltimore, MD, United States, 3Department of Neuroscience, Johns Hopkins University, Baltimore, MD, United States, 4Russell H. Morgan Department of Radiology and Radiological Science, Johns Hopkins University School of Medicine, Baltimore, MD, United States, 5Division of Cardiology, Department of Medicine, Johns Hopkins University School of Medicine, Baltimore, MD, United States
Synopsis
Keywords: CEST & MT, CEST & MT, amide CEST, amine CEST, guanidinium CEST, creatine CEST, exchange rate, concentration, polynomial Lorentzian line-shape fitting (PLOF), high spectral resolution (HSR) CEST, two-step Bloch-McConnell (BM) fitting.
We aim to use three different approaches to estimate the exchange rate of creatine (Cr) CEST, i.e., the pure CrCEST line-shape, B1-dependent CrCEST, and the pH response with different B1 values. The pure CrCEST signal extracted using wild type and GAMT-/- mice with low Cr and PCr concentrations; the pH in the brain cells altered by hypercapnia to demonstrate the pH sensitivity of GuanCEST; a two-step Bloch-McConnell fitting implemented to quantify the exchange rates. in vivo CrCEST exchange rate was found slow (~260-350 s-1). CrCEST is the major contribution to the opposite pH-dependence of GuanCEST signal under different B1.Purpose
Among many metabolites studied with the CEST method (1-5), creatine (Cr) (6-9) and phosphocreatine (PCr) CEST (6,10) have drawn significant attention due to their favorable properties, and their role in cellular energy metabolism. However, the extraction of CrCEST at 3T was challenging as the CrCEST exchange rate was determined to be 950-1190 s–1 in the Cr phantom studies (6,11). Recently, the B1-dependent studies on both brain and muscle indicate that the in vivo CrCEST exchange rate may be much lower than 1000 s-1 (12-14). Another pH-dependent study of CrCEST also suggested that the in vivo CrCEST exchange rate is less than 500 s-1 (15). However, the exact exchange rate of the in vivo CrCEST has not been characterized due to the difficulty in extracting the pure CrCEST signal from the crowded in vivo Z-spectrum. In this study, we aim to determine the CrCEST exchange rate in the in vivo brain through three different approaches.Methods
All MRI experiments were performed on a horizontal bore 11.7 T Bruker Biospec system. Polynomial and Lorentzian line-shape fitting (PLOF) was implemented to extract the amine, amide, and Guan CEST signals from the brain Z-spectrum. Wild type (WT) and knockout mice with the Guanidinoacetate N-Methyltransferase deficiency (GAMT-/-) that have low Cr and PCr concentrations in the brain were used. To quantify the CrCEST exchange rate, a two-step Bloch-McConnell (BM) fitting was used to fit the CrCEST line-shape, B1-dependent CrCEST, and the pH response with different B1 values. The pH in the brain cells was altered by hypercapnia to measure the pH sensitivity of GuanCEST, including CrCEST and protein GuanCEST.Results and Discussion
Fig. 1 demonstrates the PLOF background fitting and the difference Z spectra (ΔZ=Zback-Z) for the three B1 values (0.8, 1.4, and 2 uT) on the WT and GAMT-/- mice. There are three prominent peaks in all ΔZ spectra, representing the signals from amide (~3.5 ppm), amine (2.7 ppm), and Guan (~1.95 ppm). The comparison between the Z-spectra of WT and GAMT-/- mice suggests that the CrCEST is between 20%-25% of the GuanCEST in the Z-spectrum at 1.95 ppm between B1=0.8 µT and 2 µT.The averaged Z-spectrum of the WT mouse and the fitted MTC curve (Fig. 2A) demonstrate the MTC background fitting with PLOF where R2=0.994, T2MTC=24 µs and fMTC=8.5% were determined from. The CrCEST line-shape were simulated with different exchange rates (Fig. 2B). The Cr exchange rate was determined to be 226±50 s-1 by the line-shape fitting. Fig. 2D shows the averaged CrCEST signal as a function of the B1 value extracted by subcontracting the Z-spectra between WT and GAMT-/- mice. The in vivo CrCEST exchange rate is about 320 s-1 compared with the simulations in Fig. 2D. Therefore, the CrCEST exchange rate was found to be around 220-350 s-1 in the mouse brain, which is significantly lower than that in solutions (~1000 s-1). With such a low exchange rate, it is feasible to extract CrCEST with the PLOF method at 3T. To estimate the CrCEST exchange rates by the CrCEST response to the subtle cerebral pH changes, Z-spectra were recorded on WT mouse brain before and during 20% CO2 inhalation (Figs. 3A-C). The same experiments were performed on the GAMT-/- mice (Figs. 3D-F) to exclude the possible contribution of protein GuanCEST in the CrCEST signal change. The amide, Guan, and amine CEST signals extracted with the PLOF method before and during CO2 inhalation (Figs. 4B-C) reveal that amideCEST is clearly reduced during CO2 inhalation for most of the B1 values on both WT and GAMT-/- mouse brains, with an exception at 2 µT on GAMT-/- mouse brains. On the contrary, both GuanCEST and amineCEST show completely different pH responses for high (1.4 and 2 µT) and low (0.8 µT) B1 values.
The hypercapnia study on mouse brain revealed that CrCEST at B1=2 µT and amineCEST at B1=0.8 µT are highly sensitive to pH variation at high MRI fields (Figs. 4B-D) and can be used for many diseases such as neuronal activation, seizure, and inflammation that only show subtle pH change (17-19). To explain the pH-dependent CrCEST signal, we simulated the exchange rate-dependent CrCEST with the three B1 values used in the current study (Fig. 4E). The pH sensitivity as a function of the exchange rate is also simulated and is shown in Fig. 4F. When the exchange rate is higher than the Rabi frequency, CrCEST should be proportional to pH or exchange rate, while CrCEST should be inversely pH-dependent with an exchange rate lower than Rabi frequency. Therefore, the exchange rate of CrCEST was estimated to be 300-350 s-1 from the pH-dependence with the three B1 values.
Conclusion
The in vivo CrCEST exchange rate is slow (~226-350 s-1) in the mouse brain, and the acquisition parameters for the CrCEST should be adjusted accordingly. CrCEST is the major contribution to the opposite pH-dependence of GuanCEST signal under different conditions of B1 in the brain.Acknowledgements
No acknowledgement found.References
1. van Zijl PC, Jones CK, Ren J, Malloy CR, Sherry AD. MRI detection of glycogen in vivo by using chemical exchange saturation transfer imaging (glycoCEST). Proc Natl Acad Sci U S A 2007;104(11):4359-4364.
2. Ling W, Regatte RR, Navon G, Jerschow A. Assessment of glycosaminoglycan concentration in vivo by chemical exchange-dependent saturation transfer (gagCEST). Proc Natl Acad Sci USA 2008;105(7):2266-2270.
3. Cai K, Haris M, Singh A, Kogan F, Greenberg JH, Hariharan H, Detre JA, Reddy R. Magnetic resonance imaging of glutamate. Nat Med 2012;18(2):302-306.
4. Davis KA, Nanga RP, Das S, Chen SH, Hadar PN, Pollard JR, Lucas TH, Shinohara RT, Litt B, Hariharan H, Elliott MA, Detre JA, Reddy R. Glutamate imaging (GluCEST) lateralizes epileptic foci in nonlesional temporal lobe epilepsy. Sci Transl Med 2015;7(309):309ra161.
5. DeBrosse C, Nanga RP, Bagga P, Nath K, Haris M, Marincola F, Schnall MD, Hariharan H, Reddy R. Lactate Chemical Exchange Saturation Transfer (LATEST) Imaging in vivo A Biomarker for LDH Activity. Sci Rep 2016;6:19517.
6. Haris M, Nanga RP, Singh A, Cai K, Kogan F, Hariharan H, Reddy R. Exchange rates of creatine kinase metabolites: feasibility of imaging creatine by chemical exchange saturation transfer MRI. NMR Biomed 2012;25(11):1305-1309.
7. Kogan F, Haris M, Singh A, Cai K, Debrosse C, Nanga RP, Hariharan H, Reddy R. Method for high-resolution imaging of creatine in vivo using chemical exchange saturation transfer. Magn Reson Med 2014;71(1):164-172.
8. Kogan F, Haris M, Debrosse C, Singh A, Nanga RP, Cai K, Hariharan H, Reddy R. In vivo chemical exchange saturation transfer imaging of creatine (CrCEST) in skeletal muscle at 3T. J Magn Reson Imaging 2014;40(3):596-602.
9. Haris M, Singh A, Cai K, Kogan F, McGarvey J, Debrosse C, Zsido GA, Witschey WR, Koomalsingh K, Pilla JJ, Chirinos JA, Ferrari VA, Gorman JH, Hariharan H, Gorman RC, Reddy R. A technique for in vivo mapping of myocardial creatine kinase metabolism. Nat Med 2014;20(2):209-214.
10. Chen L, Schar M, Chan KWY, Huang J, Wei Z, Lu H, Qin Q, Weiss RG, van Zijl PCM, Xu J. In vivo imaging of phosphocreatine with artificial neural networks. Nat Commun 2020;11(1):1072.
11. Goerke S, Zaiss M, Bachert P. Characterization of creatine guanidinium proton exchange by water-exchange (WEX) spectroscopy for absolute-pH CEST imaging in vitro. NMR Biomed 2014;27(5):507-518.
12. Chung JJ, Jin T, Lee JH, Kim SG. Chemical exchange saturation transfer imaging of phosphocreatine in the muscle. Magn Reson Med 2019;81(6):3476-3487.
13. Chen L, Zeng H, Xu X, Yadav NN, Cai S, Puts NA, Barker PB, Li T, Weiss RG, van Zijl PCM, Xu J. Investigation of the contribution of total creatine to the CEST Z-spectrum of brain using a knockout mouse model. NMR Biomed 2017;30(12):e3834.
14. Chen L, Barker PB, Weiss RG, van Zijl PCM, Xu J. Creatine and phosphocreatine mapping of mouse skeletal muscle by a polynomial and Lorentzian line-shape fitting CEST method. Magn Reson Med 2019;81(1):69-78.
15. Chen L, Van zijl P, Wei Z, Lu H, Duan W, Wong PC, Li T, Xu J. Early detection of Alzheimer’s disease using creatine chemical exchange saturation transfer magnetic resonance imaging. NeuroImage 2021;236:118071.
16. Zhou Y, Bie C, van Zijl PCM, Xu J, Zou C, Yadav NN. Detection of electrostatic molecular binding using the water proton signal. Magn Reson Med 2022;88(2):901-915.
17. Siesjo BK, von Hanwehr R, Nergelius G, Nevander G, Ingvar M. Extra- and intracellular pH in the brain during seizures and in the recovery period following the arrest of seizure activity. J Cereb Blood Flow Metab 1985;5(1):47-57.
18. Magnotta VA, Heo HY, Dlouhy BJ, Dahdaleh NS, Follmer RL, Thedens DR, Welsh MJ, Wemmie JA. Detecting activity-evoked pH changes in human brain. Proc Natl Acad Sci U S A 2012;109(21):8270-8273.
19. Menkin V. Biology of inflammation; chemical mediators and cellular injury. Science 1956;123(3196):527-534.Figures
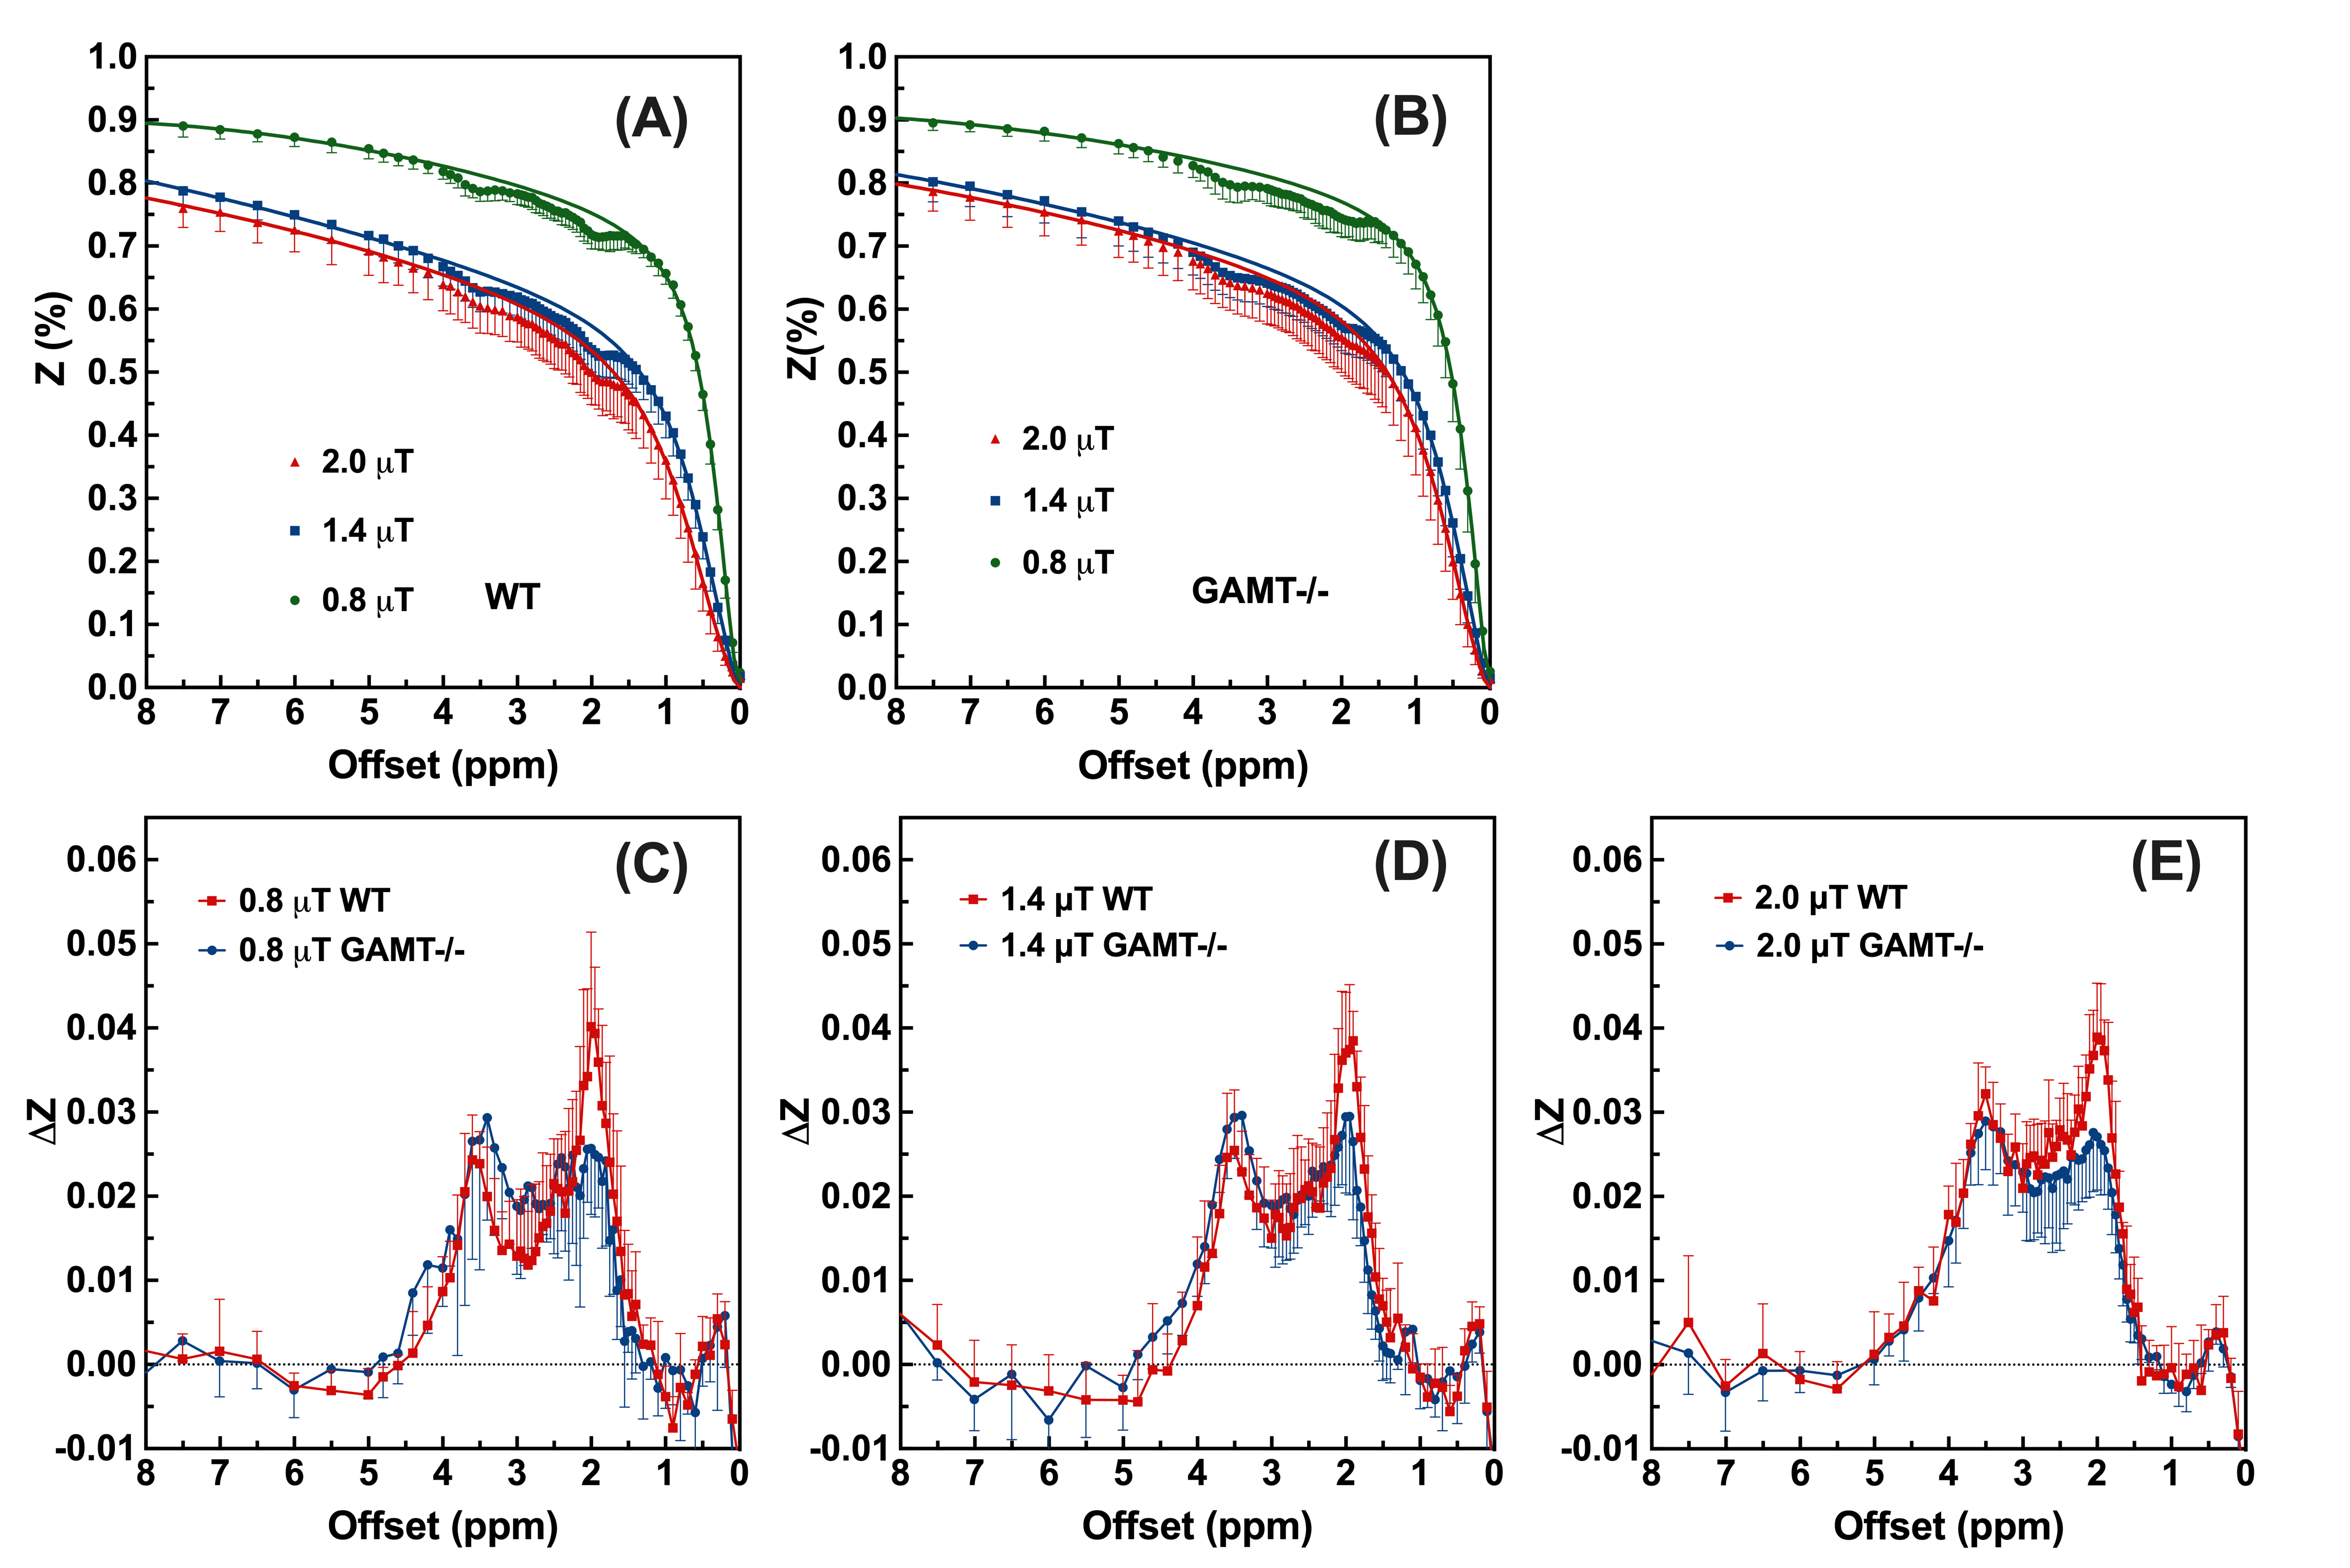
Figure 1: Demonstration of the extraction CEST peaks with the PLOF method. PLOF fitting of the background averaged Z-spectra (n=6) in the WT (A) and GAMT-/- (B) mouse brain for three B1 values, i.e., 0.8, 1.4, and 2 mT. The coefficient of determination (R2) >0.999 for the background fitting. (C-E) Averaged differential Z-spectra (Zback-Z), i.e., ΔZ spectrum, for the WT and GAMT-/- mice (n=6) recorded with B1=0.8 (C), 1.4 (D) and 2 mT (E).
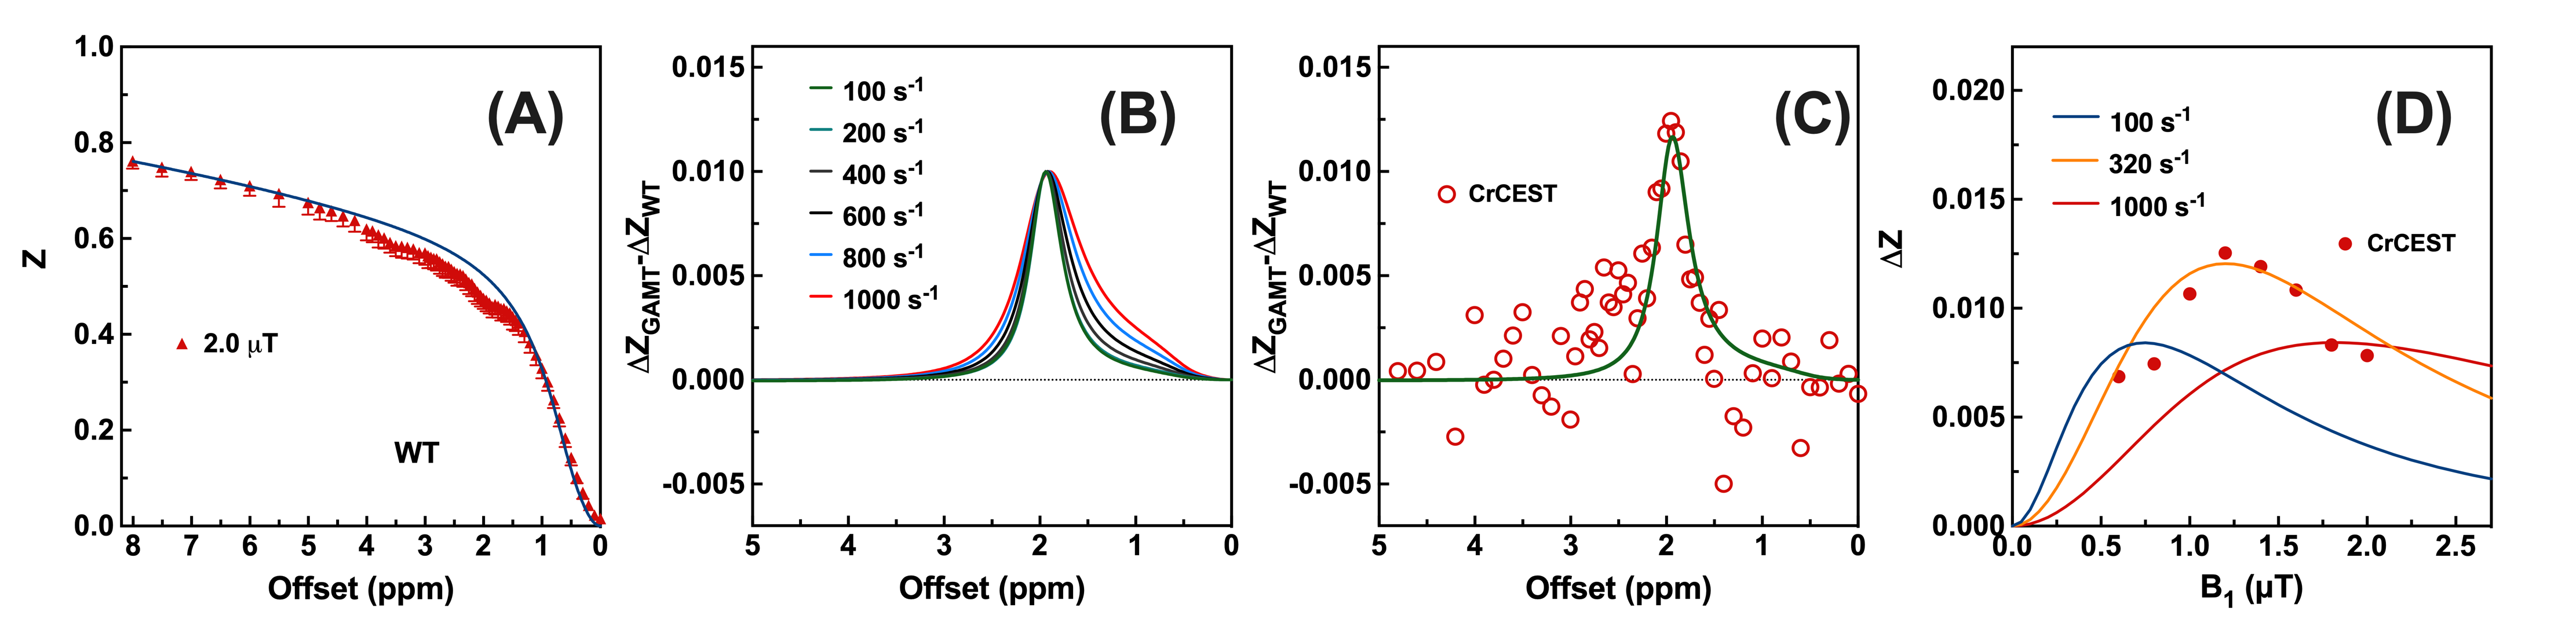
Figure 2: The exchange rate of the CrCEST signal determined with line-shape and B1-dependent CrCEST. (A) The averaged Z-spectrum of the WT mouse and the fitted MTC curve recorded with 1 s and 2 mT cwCEST. (B) Simulated CrCEST line-shapes with different exchange rates. (C) The differential Z-spectrum between WT and GAMT-/- mice recorded with 2 mT was fitted with fixed MTC parameters and Cr concentration (5 mM). (D) The averaged B1-dependent CrCEST values at 1.95 ppm by subcontracting the CEST signal on both WT and GAMT-/- mouse brain (n=4).
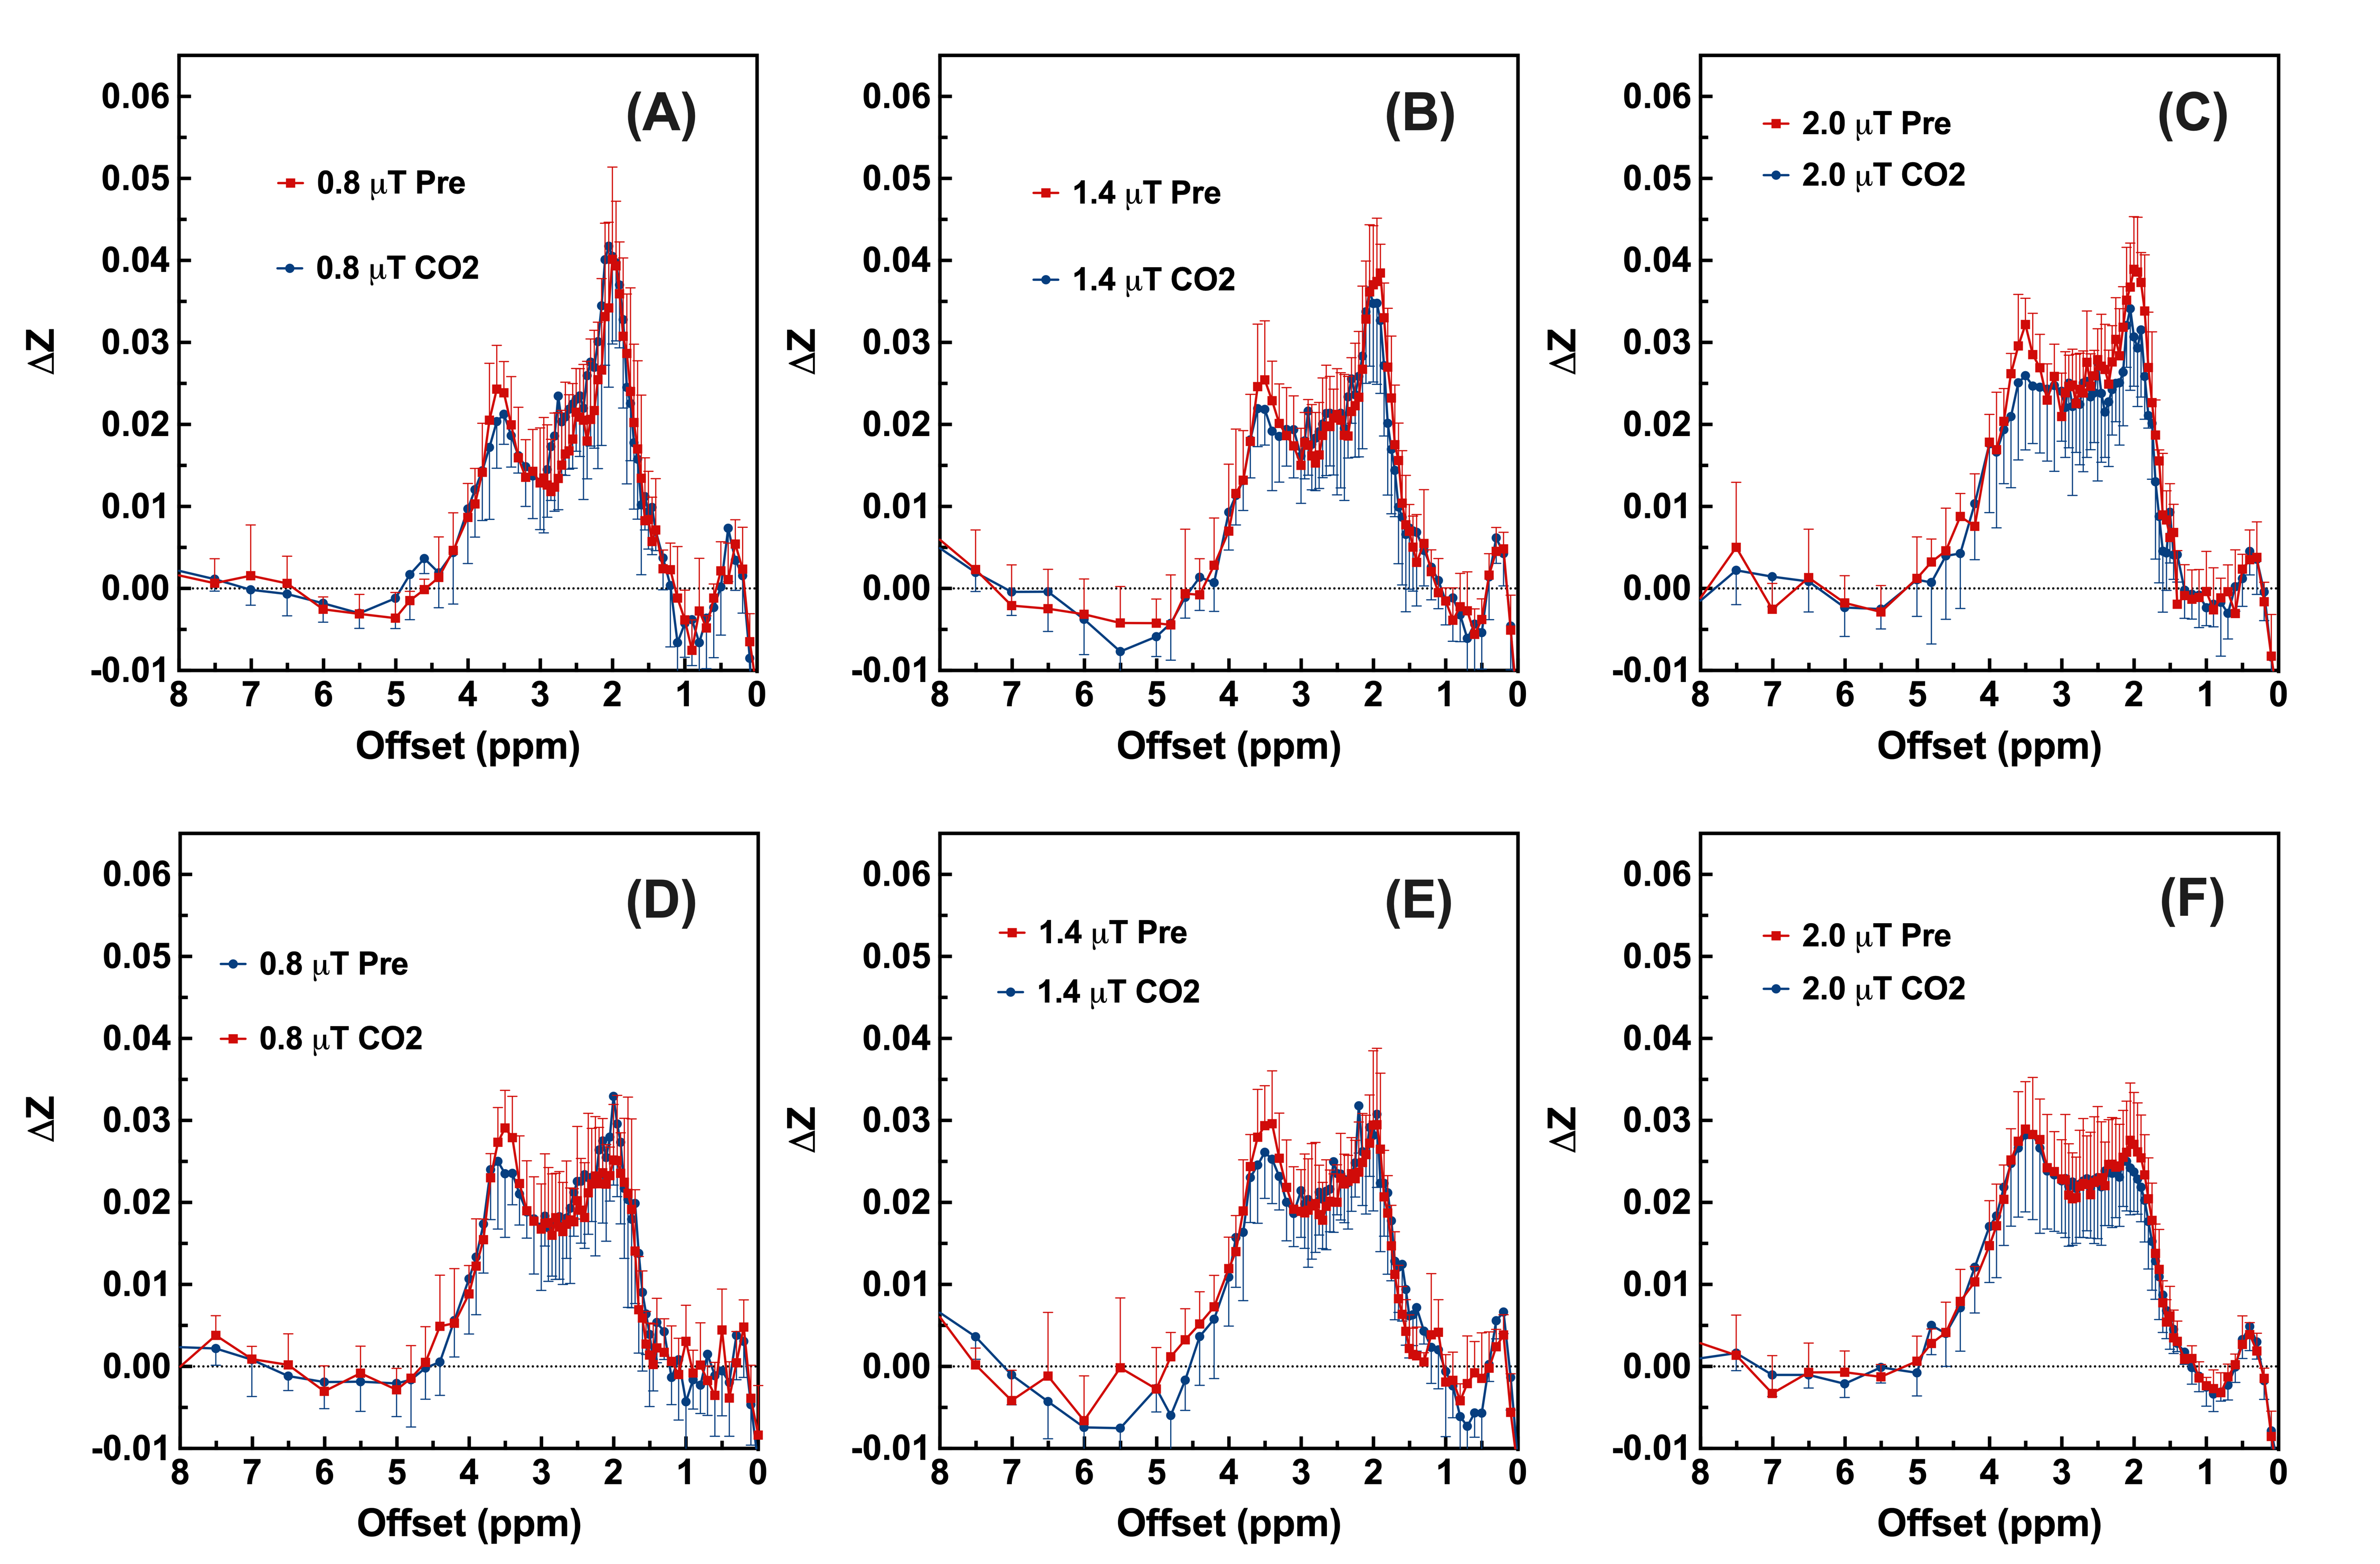
Figure 3: Averaged differential Z-spectra (n=6) for the whole WT (A-C) and GAMT-/-(D-F) mouse brain pre-CO2 and during CO2 inhalation with B1 = 0.8 µT (A, D), 1.4 µT (B, E) and 2 µT (C, F).
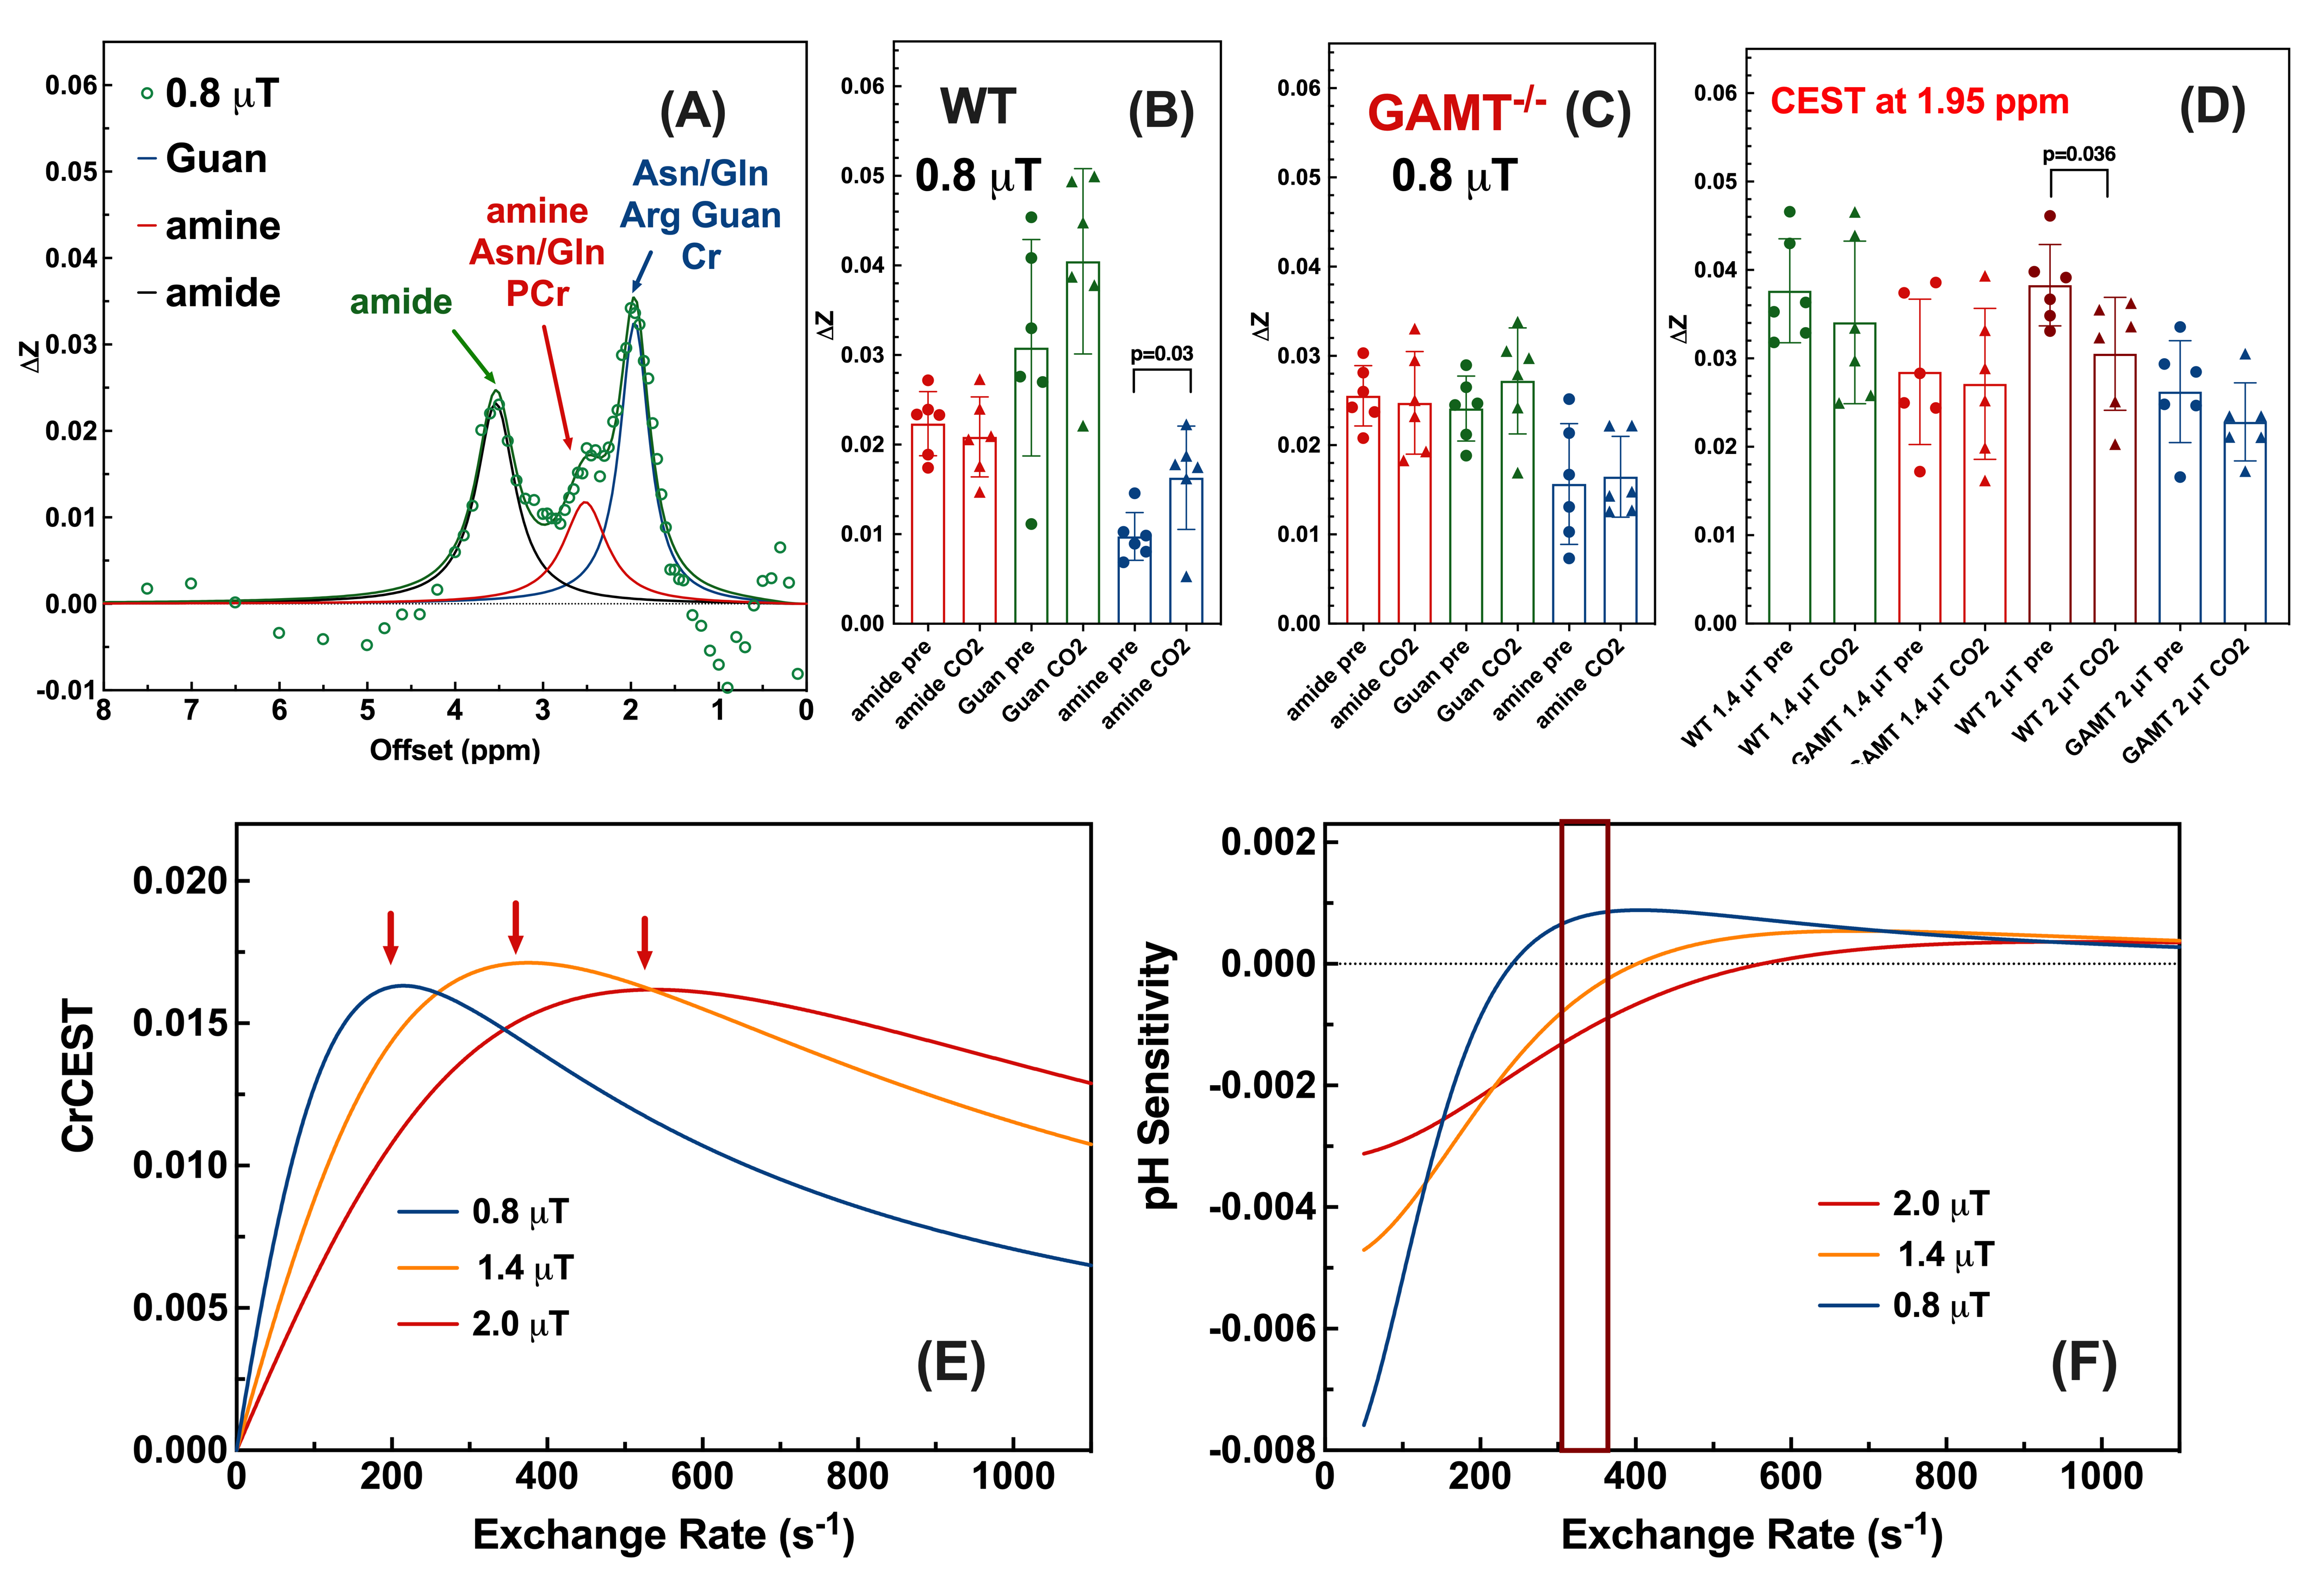
Figure 4: (A) Guan, amine, and amide CEST extracted with the DZ spectra (n=6) on the WT whole brain. (B-C) The amide, Guan, and amine CEST values of the pre and during CO2 inhalation for the WT (B) and GAMT-/-(C) whole brain. (D) CEST values at 1.95 ppm pre and during CO2 inhalation. (E) The simulated exchange rate dependent CrCEST signal. Red arrows label the Rabi frequencies. (F) The pH sensitivity of the CrCEST signal. The red box shows the exchange rate range determined from the pH-dependent CrCEST signal in WT mice pre and during CO2 inhalation.