2986
Prospective acceleration of whole-brain chemical exchange saturation transfer by Joint K-space and Image-space Parallel Imaging (KIPI)1Key Laboratory for Biomedical Engineering of Ministry of Education, Department of Biomedical Engineering, College of Biomedical Engineering & Instrument Science, Zhejiang University, Hangzhou, China
Synopsis
Keywords: CEST & MT, Parallel Imaging
The clinical use of chemical exchange saturation transfer (CEST) imaging is limited by its relatively long scan time due to the measurements of multiple frames at the same location, especially for 3D whole-brain imaging. In this study, the recently proposed reconstruction method by joint K-space and Image-space Parallel Imaging (KIPI) is utilized for prospectively accelerating 3D CEST imaging. Prospective KIPI allows an acceleration factor of up to 8-fold for acquiring source images, reducing the scan time to 5.5 min for the whole-brain quantitative CEST imaging, with 17 saturation frames and 2.9 mm isotropic resolution.Introduction
Chemical exchange saturation transfer (CEST) has proven to be an important diagnostic tool(1-3), but the routine clinical use of 3D CEST MRI is limited by the relatively long scan time since it acquires multiple image frames(1,4,5). Here, we deploy the recently proposed joint K-space and Image-space Parallel Imaging (KIPI) method(6) to prospectively accelerate the CEST acquisition, using variable acceleration factors across frames. Combined with the recently proposed NEMR method(7), KIPI can achieve whole-brain quantitative CEST imaging within 5.5 min.Theory
In the KIPI method, a calibration frame with a low acceleration factor (AF) and auto-calibration signals (ACS) were acquired, and the other frames were undersampled with variably high AF. KIPI calculates the coil sensitivity profiles and correction maps using the GRAPPA-refilled calibration frame, which can then be applied to the other frames for SENSE reconstruction and artifact suppression(6). However, the order of echo readout will be different due to the change of sampling masks after introducing the prospectively variable AF to different frames(8). Therefore, the undesirable T2-decay inconsistency is introduced between frames with different AFs, which can interfere with the CEST contrast. In the case of only two AFs, we can divide the low-AF data into two parts: the first part corresponds to the sampling mask and order of high-AF, and the second part refers to the rest data. These two parts can be combined to form the sampling mask of the low-AF data.Figure 1 displays the echo readout orders for AF=2x2 and AF=4x2. The standard AF=4x2 order (Fig. 1B) is slightly different from that of the standard AF=2x2 order (Fig. 1A) at the same sampling locations, ranging from -4 to 4 (Fig. 1C). The optimized echo readout order for AF=2x2 (Fig. 1E) is composed of the standard AF=4x2 order (Fig. B) and its shifted version by Δky=2 (Fig. 1D). Therefore, the standard AF=4x2 order (Fig. 1B) is the same with that of the optimized AF=2x2opt order (Fig. 1F, all zero) at the same sampling locations.
Methods
Human and phantom experiments were conducted on a 3T Siemens Prisma MRI system with a 64-channel-receive head coil. A SPACE-CEST sequence(4) was run using the following readout parameters: FOV=232×232×209mm3, resolution=2.9×2.9×2.9mm3, echo train length (ETL)=144, acquisition matrix=80x80x72, TR=3000ms and NSA=1.3. The ACS (28x80x28) was acquired separately with the same SPACE sequence. A dual-echo 3D GRE sequence was used for B0 mapping, and a vendor-provided preconditioning RF method was used for B1 mapping(9).Experiment 1
The conventional AF=2×2 GRAPPA reconstruction was treated as ground truth. Seven CEST saturation offsets (B1=2.5uT) for APT-weighted (APTw) imaging were executed, including (S0), ±3, ±3.5, and ±4ppm. For prospective acceleration, the +3.5ppm frame was treated as the calibration image with AF=2x2, and the other six frames with AF=4x2 (overall scan time=2.5min). The unoptimized data used the standard 2x2 echo order for the +3.5 ppm frame while the optimized data used the optimized 2x2opt echo order, on both of which ESPIRiT(10) and KIPI(6) reconstruction were implemented.
Experiment 2
Seventeen offsets (B1=1.5uT) for quantitative CEST imaging were executed, including (S0), 80, 70, 60, 50, 40, 30, 20, 10, ±4, ±3.5, ±3, and ±0.5ppm. The S0 and ±3.5ppm images were treated as calibration frames with AF=4 using the optimized echo order, and the other fourteen frames with AF=8. For KIPI reconstruction, the correction map for 10 ~ 80ppm frames was from the S0 calibration one, and for +0.5 ~ +4ppm frames from the +3.5ppm calibration one, and for -4 ~ -0.5ppm frames from the -3.5ppm calibration one. For the NEMR processing(7), the 10 ~ 80 and ±0.5ppm offsets were used to fit the reference z-spectrum (Zfit). And the APT# and NOE# maps were calculated as,
$$\begin{aligned}APT^{\#}&=Z_{\text{fit}}(3.5\mathrm{ppm})-Z_{\text{exp}}(3.5\mathrm{ppm})\ \ \ [1]\\NOE^{\#}&=Z_{\text{fit}}(-3.5\mathrm{ppm})-Z_{\text{exp}}(-3.5\mathrm{ppm})\ \ \ [2]\end{aligned} $$
where Zexp denotes the experimental z-spectrum. Figure 2 illustrates the key steps of KIPI reconstruction and subsequent CEST analysis.
Results
Experiment 1Figure 3 shows the whole-brain APTw maps generated from the source images of conventional AF=2x2 GRAPPA as a reference (Fig. 3A), and prospective variably-accelerated data (Figs. 3B-E) from a healthy volunteer. The ESPIRiT reconstruction yielded serious artifacts whether the echo order was optimized or not (Figs. 3B&D). In contrast, the KIPI method with optimized echo order generated images (Fig. 3E) consistent with the reference one, while it had minor artifacts with the unoptimized echo order (red arrows).
Experiment 2
Figure 4A displays the source images from KIPI reconstruction, which has no discernible artifact. The fitted NEMR (blue) and acquired (orange) z-spectra from a representative voxel (blue square in Fig. 4A) were compared in Fig. 4B. In addition, for the 1.5uT saturation power used, the MTRasym values were negative while the NEMR indices (Zfit-Zexp) were positive (Fig. 4C).
Figure 5 shows the whole-brain APTw, APT#, NOE#, B1, and B0 map from the same volunteer as in Figure 4. Because of the lower B1(11) and B1&B0 field inhomogeneity, the APTw map exhibited nonuniformly-distributed negative signals (red arrows). In contrast, the APT# and NOE# maps were of high quality and uniformity.
Conclusion
A novel strategy was proposed to optimize the readout echo order for prospective KIPI. The KIPI method shows great potential for prospectively accelerating whole-brain CEST acquisition and quantitative parameter measurements.Acknowledgements
National Natural Science Foundation of China: 81971605. Key R&D Program of Zhejiang Province: 2022C04031. Leading Innovation and Entrepreneurship Team of Zhejiang Province: 2020R01003. This work was supported by the MOE Frontier Science Center for Brain Science & Brain-Machine Integration, Zhejiang University.References
1. Zhou J, Zhu H, Lim M, Blair L, Quinones-Hinojosa A, Messina SA, Eberhart CG, Pomper MG, Laterra J, Barker PB, van Zijl PCM, Blakeley JO. Three-dimensional amide proton transfer MR imaging of gliomas: Initial experience and comparison with gadolinium enhancement. Journal of Magnetic Resonance Imaging 2013;38(5):1119-1128.
2. Harston GW, Tee YK, Blockley N, Okell TW, Thandeswaran S, Shaya G, Sheerin F, Cellerini M, Payne S, Jezzard P. Identifying the ischaemic penumbra using pH-weighted magnetic resonance imaging. Brain 2015;138(1):36-42.
3. Davis KA, Nanga RPR, Das S, Chen SH, Hadar PN, Pollard JR, Lucas TH, Shinohara RT, Litt B, Hariharan H. Glutamate imaging (GluCEST) lateralizes epileptic foci in nonlesional temporal lobe epilepsy. Science Translational Medicine 2015;7(309):309ra161-309ra161.
4. Zhang Y, Yong X, Liu R, Tang J, Jiang H, Fu C, Wei R, Hsu Y-C, Sun Y, Luo B, Wu D. Whole-brain chemical exchange saturation transfer imaging with optimized turbo spin echo readout. Magnetic Resonance in Medicine 2020;84(3):1161-1172.
5. Zhang Y, Zu T, Liu R, Zhou J. Acquisition sequences and reconstruction methods for fast chemical exchange saturation transfer imaging. NMR in Biomedicine 2022;10.1002/nbm.4699.
6. Zu T, Sun Y, Wu D, Zhang Y. Joint K-space and Image-space Parallel Imaging (KIPI) for accelerated chemical exchange saturation transfer acquisition. Magnetic Resonance in Medicine 2022;10.1002/mrm.29480.
7. Yong X, Lu S, Hsu Y-C, Sun Y, Wu D, Zhang Y. Numerical Fit of Extrapolated Semisolid Magnetization Transfer Reference Signal (NEMR) for Improved pH-Weighted Imaging of Ischemic Stroke. Proceedings of the 29th Annual Metting of ISMRM; 2021; Vancouver, Canada. p 3696.
8. Mugler JP, III. Optimized Three-Dimensional Fast-Spin-Echo MRI. Journal of Magnetic Resonance Imaging 2014;39(4):745-767.
9. Chung S, Kim D, Breton E, Axel L. Rapid B1+ Mapping Using a Preconditioning RF Pulse with TurboFLASH Readout. Magnetic Resonance in Medicine 2010;64(2):439-446.
10. Uecker M, Lai P, Murphy MJ, Virtue P, Elad M, Pauly JM, Vasanawala SS, Lustig M. ESPIRiT-An Eigenvalue Approach to Autocalibrating Parallel MRI: Where SENSE Meets GRAPPA. Magnetic Resonance in Medicine 2014;71(3):990-1001.
11. Zhou J, Zaiss M, Knutsson L, Sun PZ, Ahn SS, Aime S, Bachert P, Blakeley JO, Cai K, Chappell MA, Chen M, Gochberg DF, Goerke S, Heo HY, Jiang S, Jin T, Kim SG, Laterra J, Paech D, Pagel MD, Park JE, Reddy R, Sakata A, Sartoretti-Schefer S, Sherry AD, Smith SA, Stanisz GJ, Sundgren PC, Togao O, Vandsburger M, Wen Z, Wu Y, Zhang Y, Zhu W, Zu Z, van Zijl PCM. Review and consensus recommendations on clinical APT-weighted imaging approaches at 3T: Application to brain tumors. Magnetic Resonance in Medicine 2022;88(2):546-574.
Figures
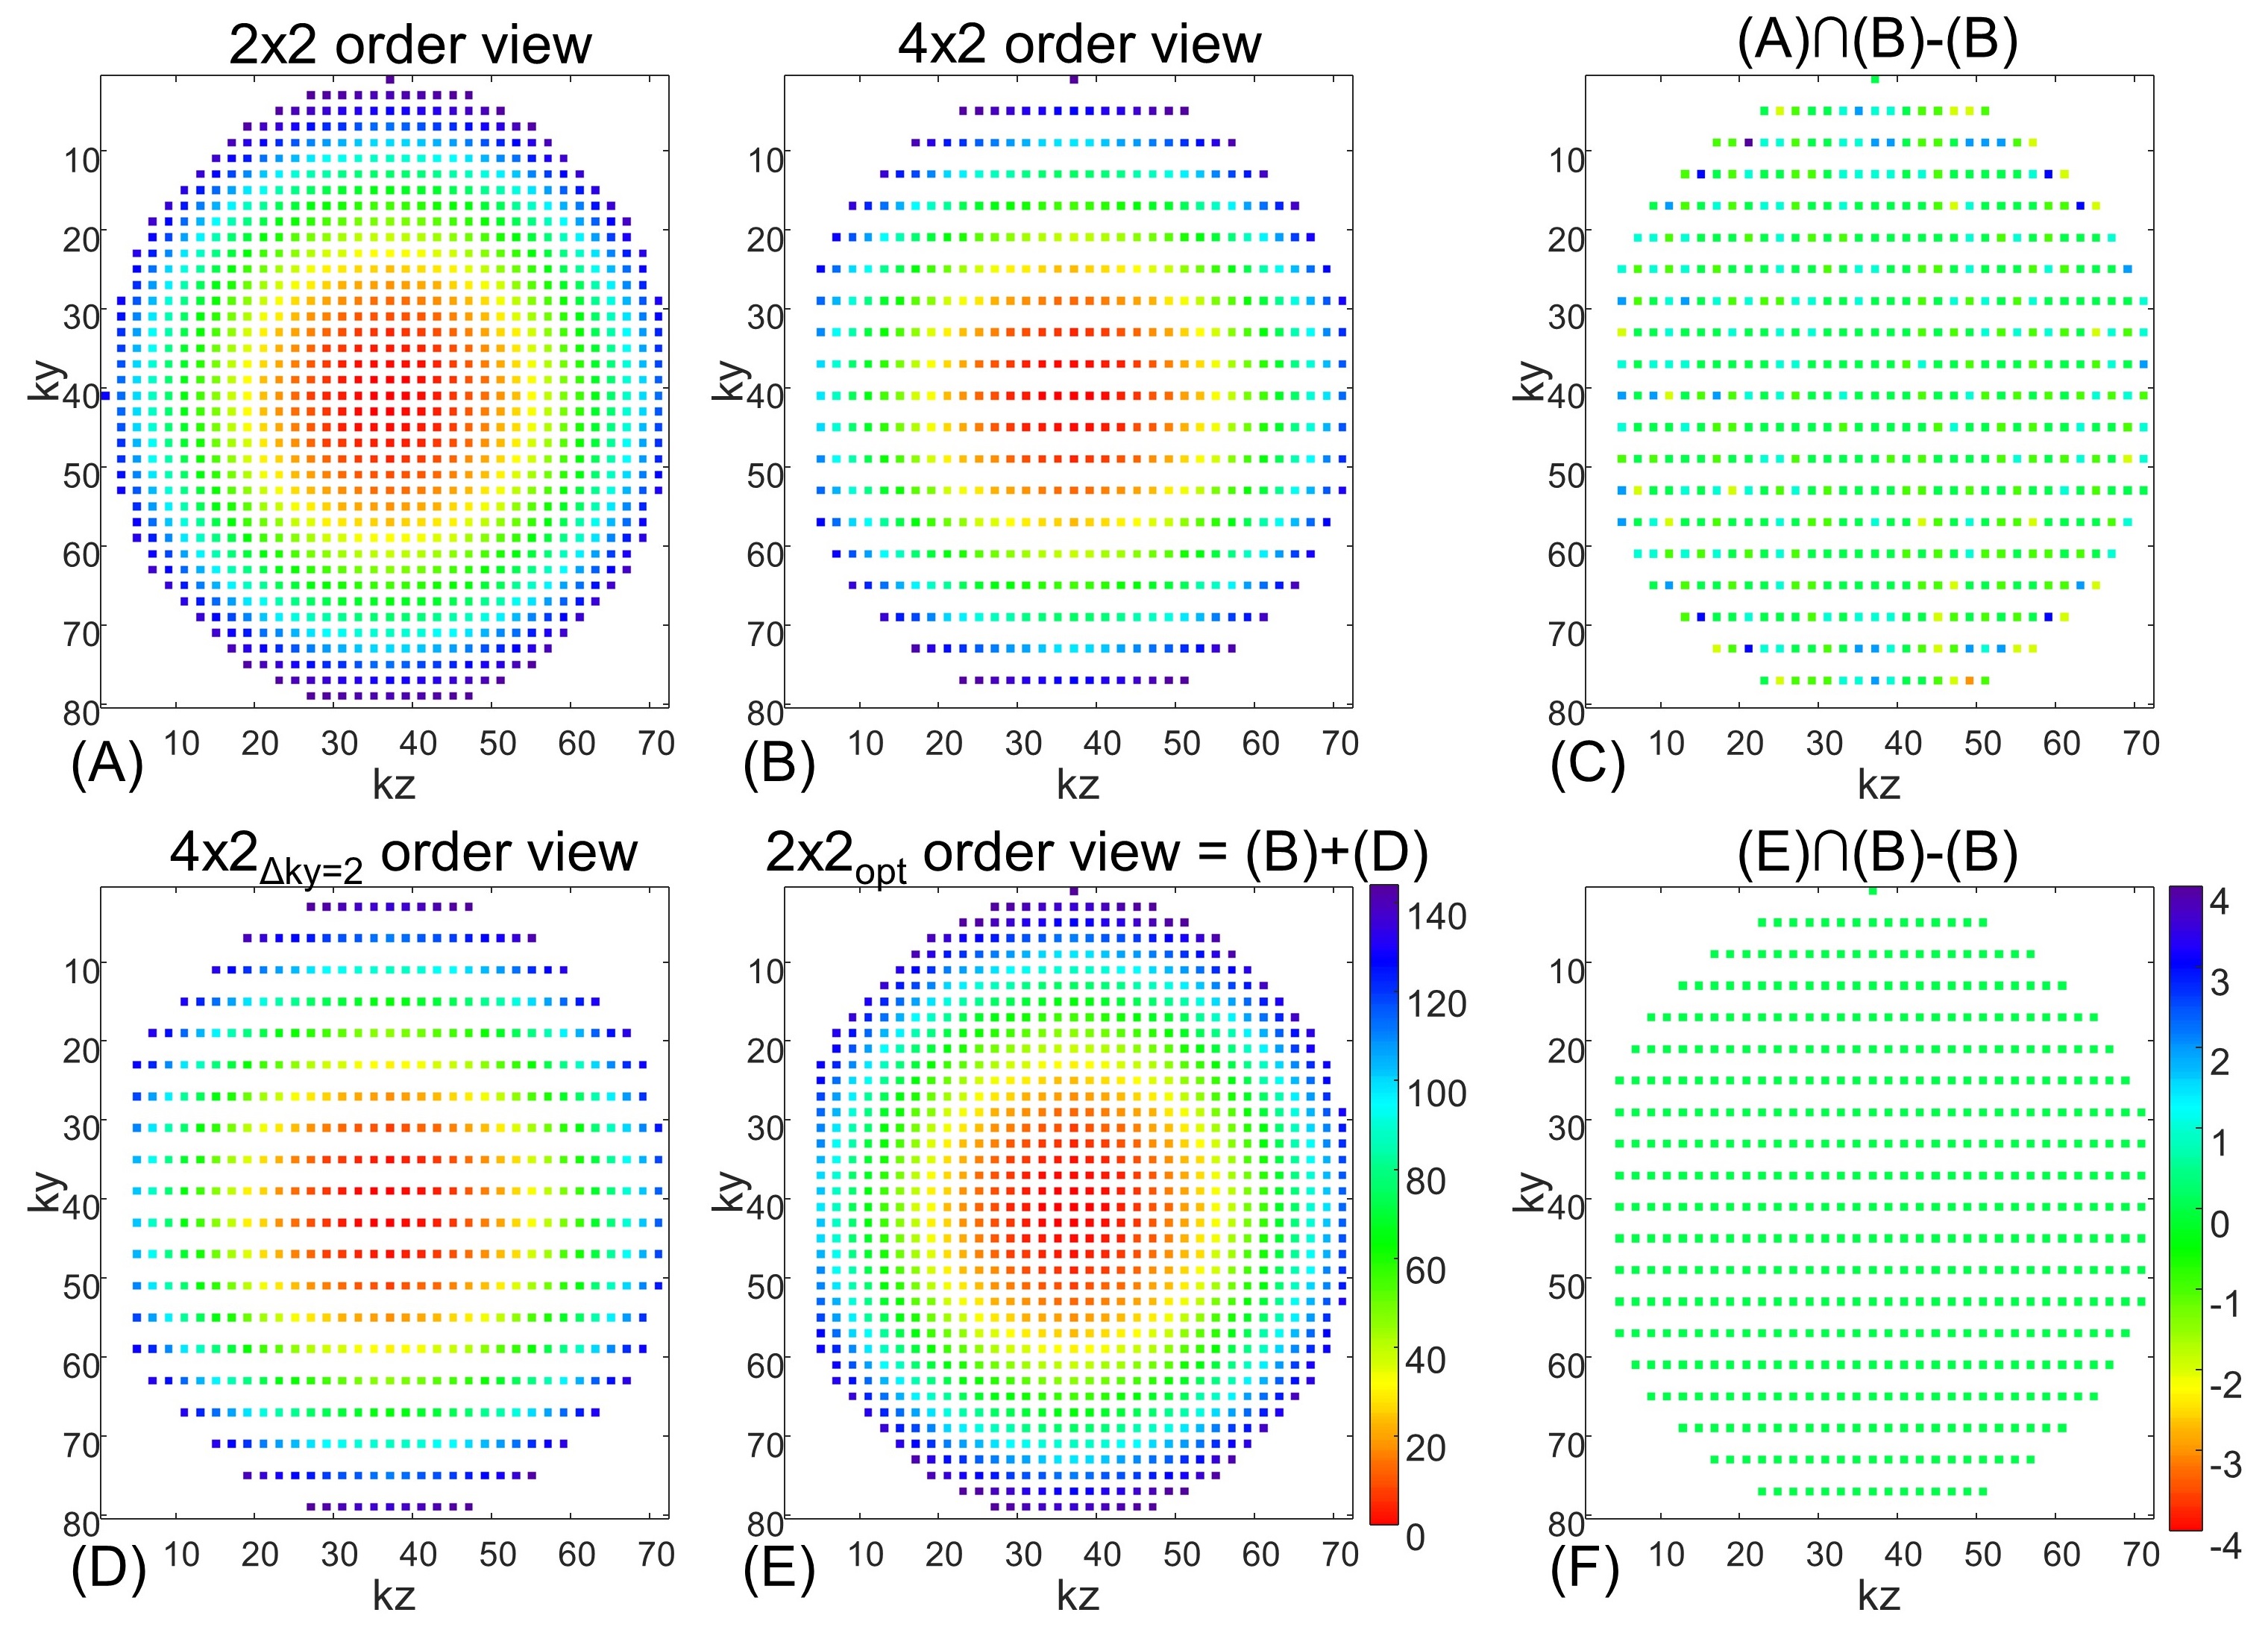
Figure 1. Comparison of the conventional echo readout order and the optimized order. (A, B): The standard centric order view for 2x2 and 4x2 sampling masks. (C): The difference between (A) and (B) at the same sampling locations, ranging from -4 to 4. (D): The standard 4x2 sampling mask is shifted by Δky=2 in the ky direction. (E): The optimized 2x2opt readout order is the sum of (B) and (D). (F): The difference between (E) and (B) at the same sampling locations. The color for (A), (B), (D) and (E) indicates the echo number within each shot.
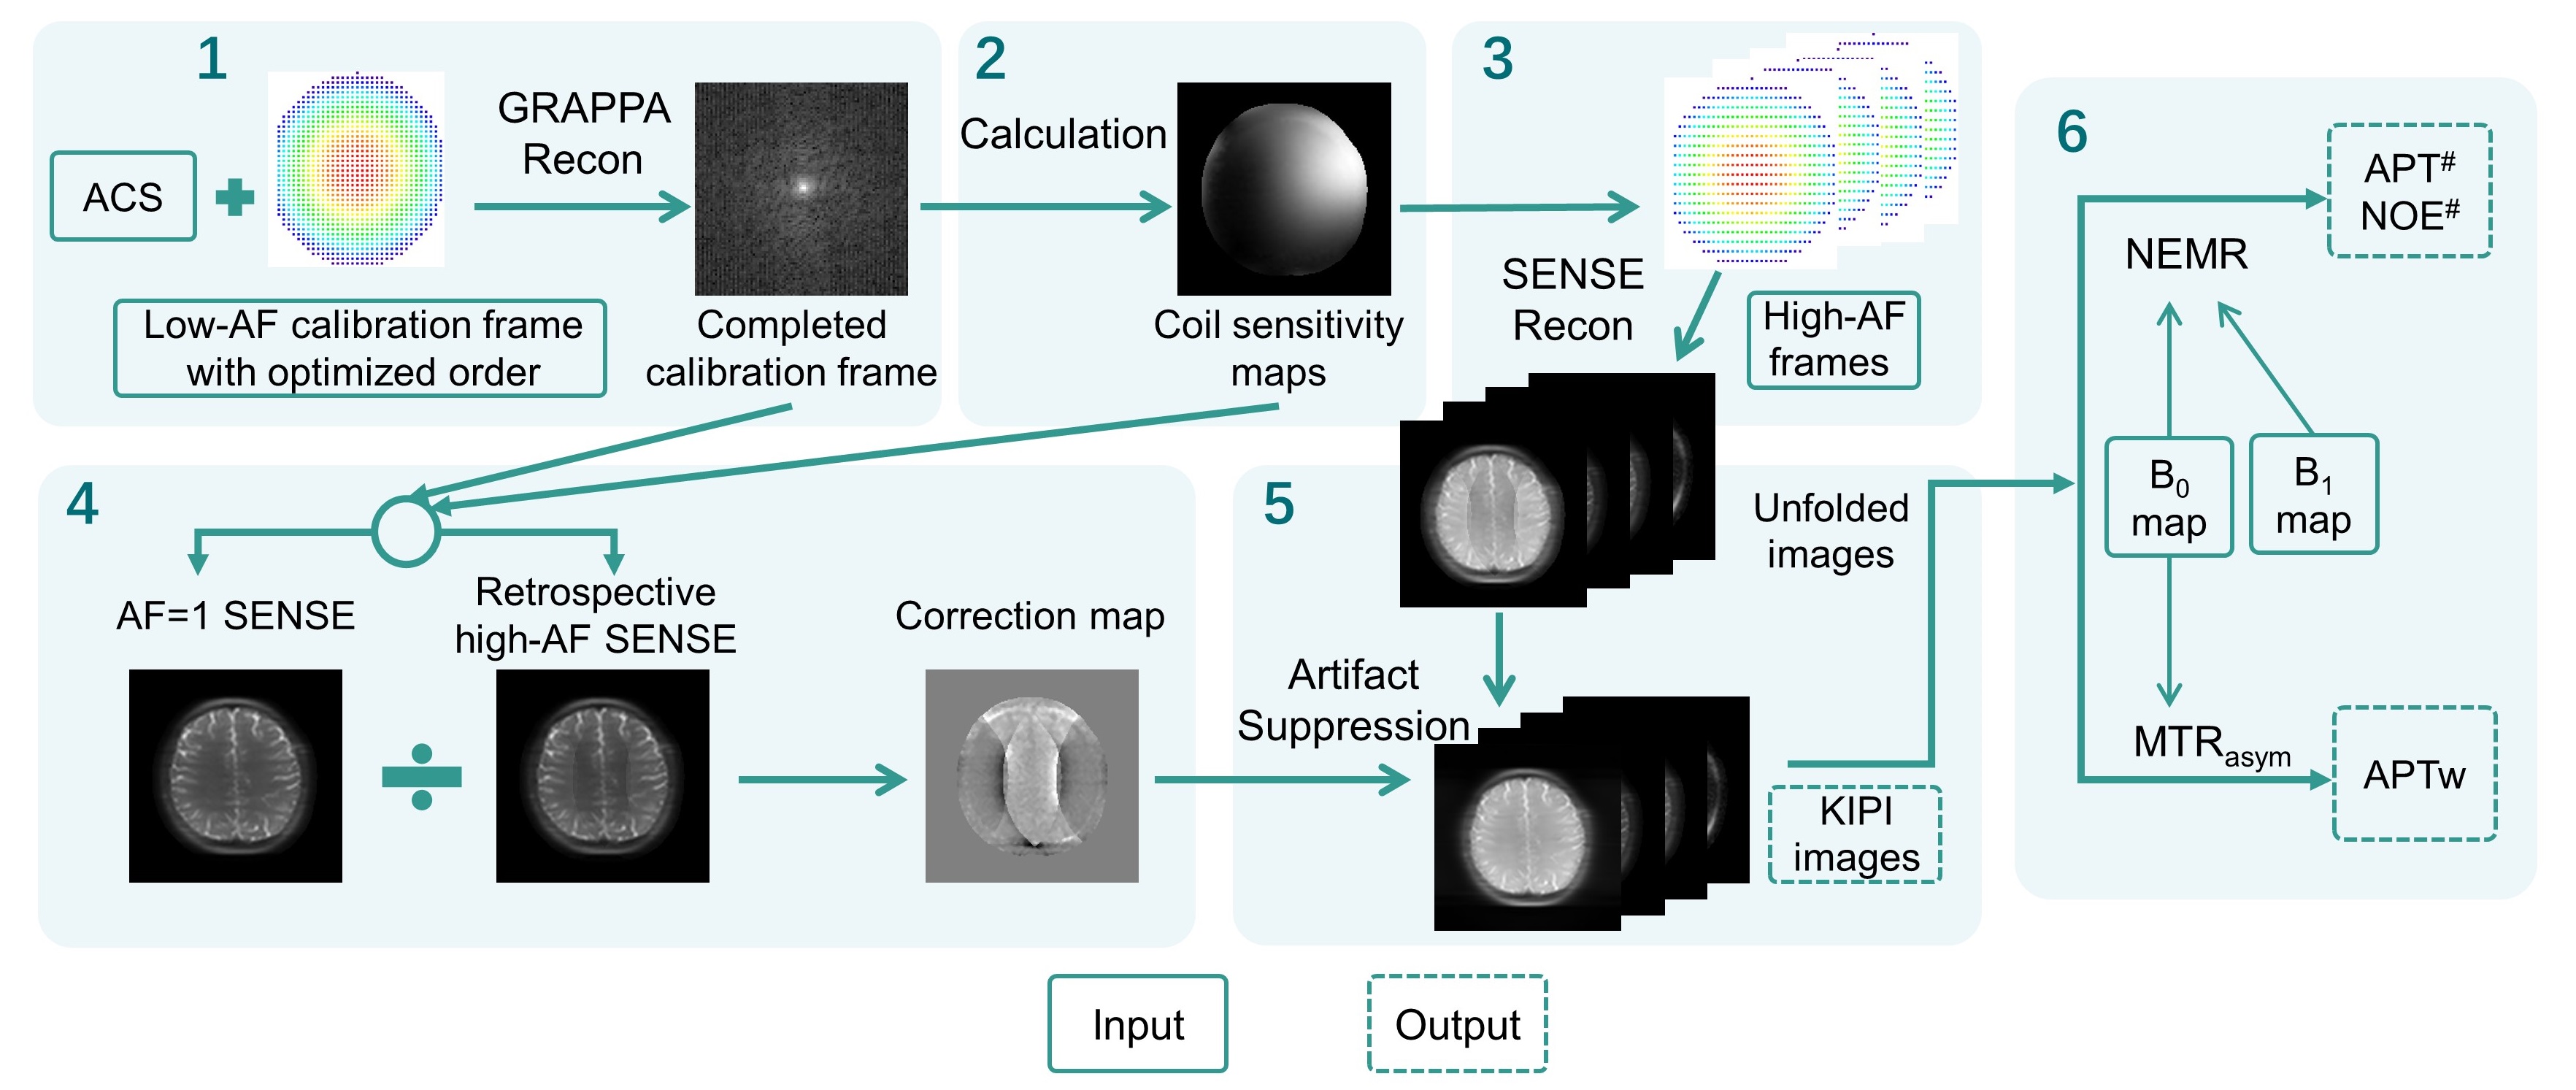
Figure 2. Flowchart for implementing the KIPI method with prospectively-implemented variably-undersampled frames and the subsequent CEST analysis. Abbreviations: AF, acceleration factor; ACS, auto-calibration signal; Recon, Reconstruction; NEMR, Numerical Fit of Extrapolated Semisolid Magnetization Transfer Reference Signal.
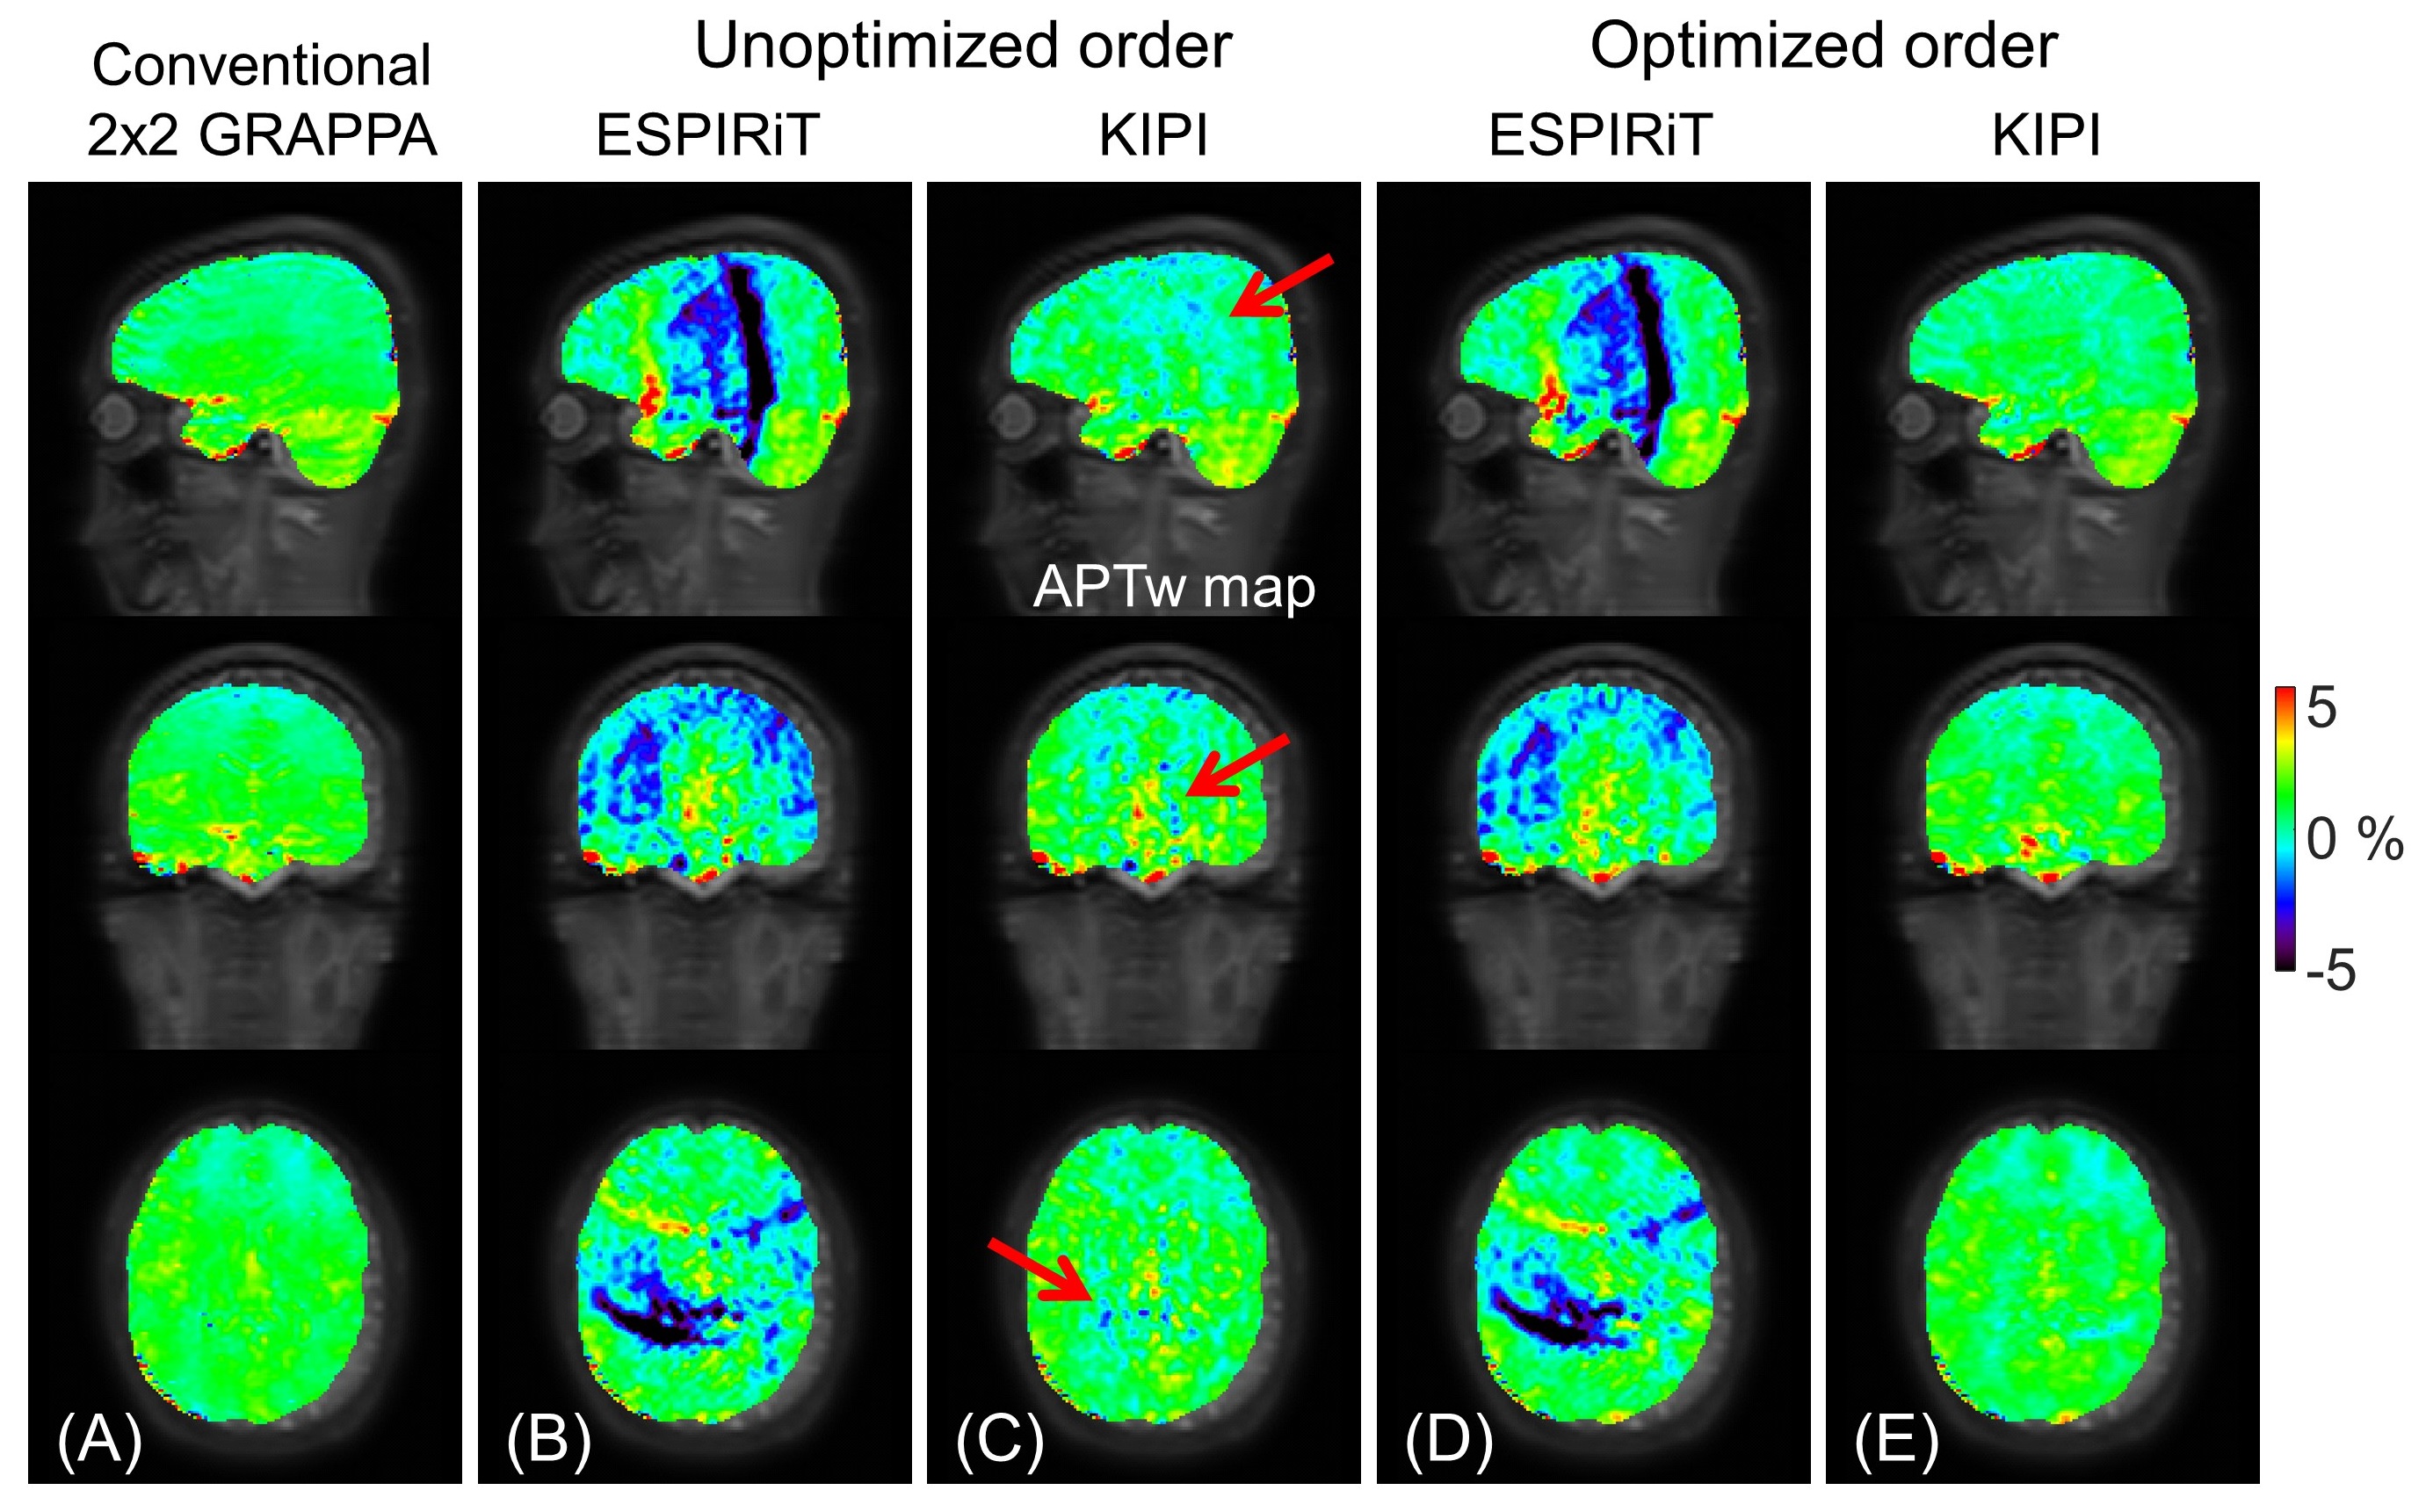
Figure 3. The 3D APTw images of a healthy volunteer calculated from conventional 2x2 GRAPPA (A) and prospective variably-accelerated data (B-E), i.e., AF = 2 × 2 for the 3.5 ppm frame and AF = 4 × 2 for the other six frames. For the +3.5 ppm frame, the unoptimized data used standard 2x2 echo readout order (B-C) while optimized data used optimized 2x2opt echo readout order (D-E). The red arrows indicate artifacts from the unoptimized order.
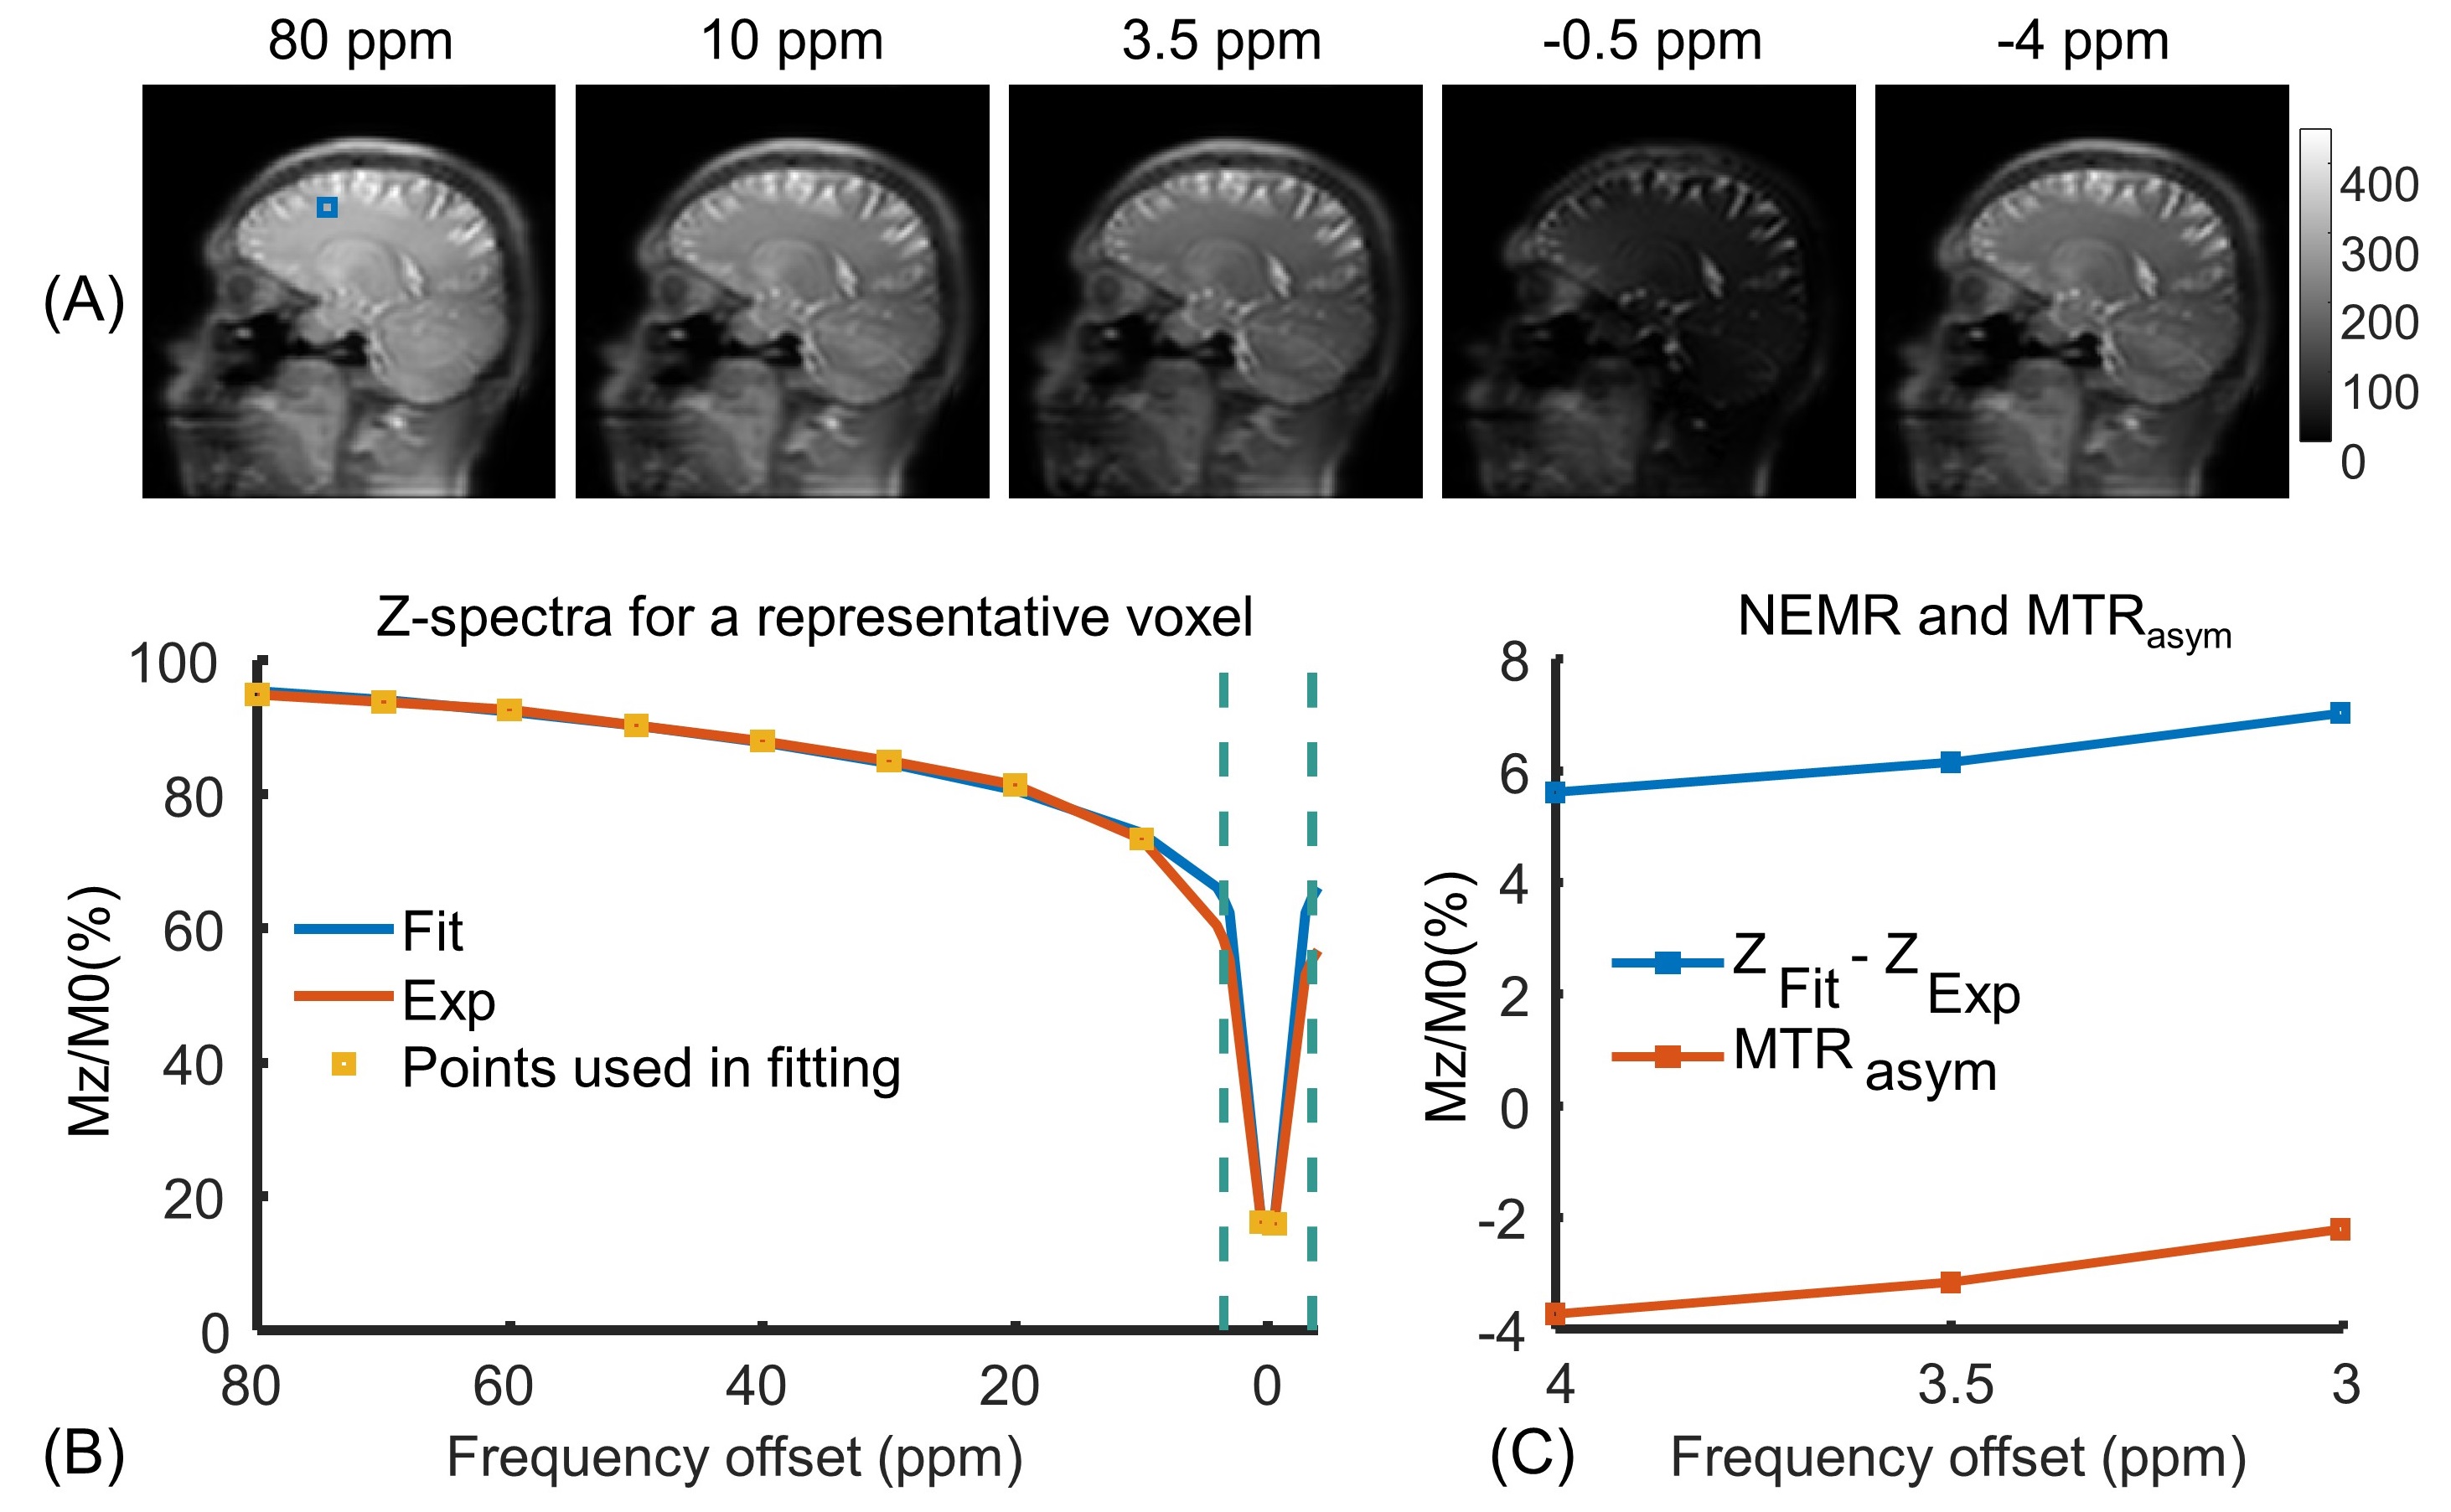
Figure 4. The source images and the fitted z-spectra by NEMR. (A): The five source images at different offsets from prospective variably-accelerated data. (B): The fitted NEMR and experimental z-spectra. The yellow squares indicate the points (80~10 and ±0.5 ppm) used in NEMR fitting. The green dotted lines indicate ±3.5 ppm. (C): The difference spectrum between NEMR and experimental z-spectra within 4 to 3 ppm is displayed against the MTRasym spectrum.
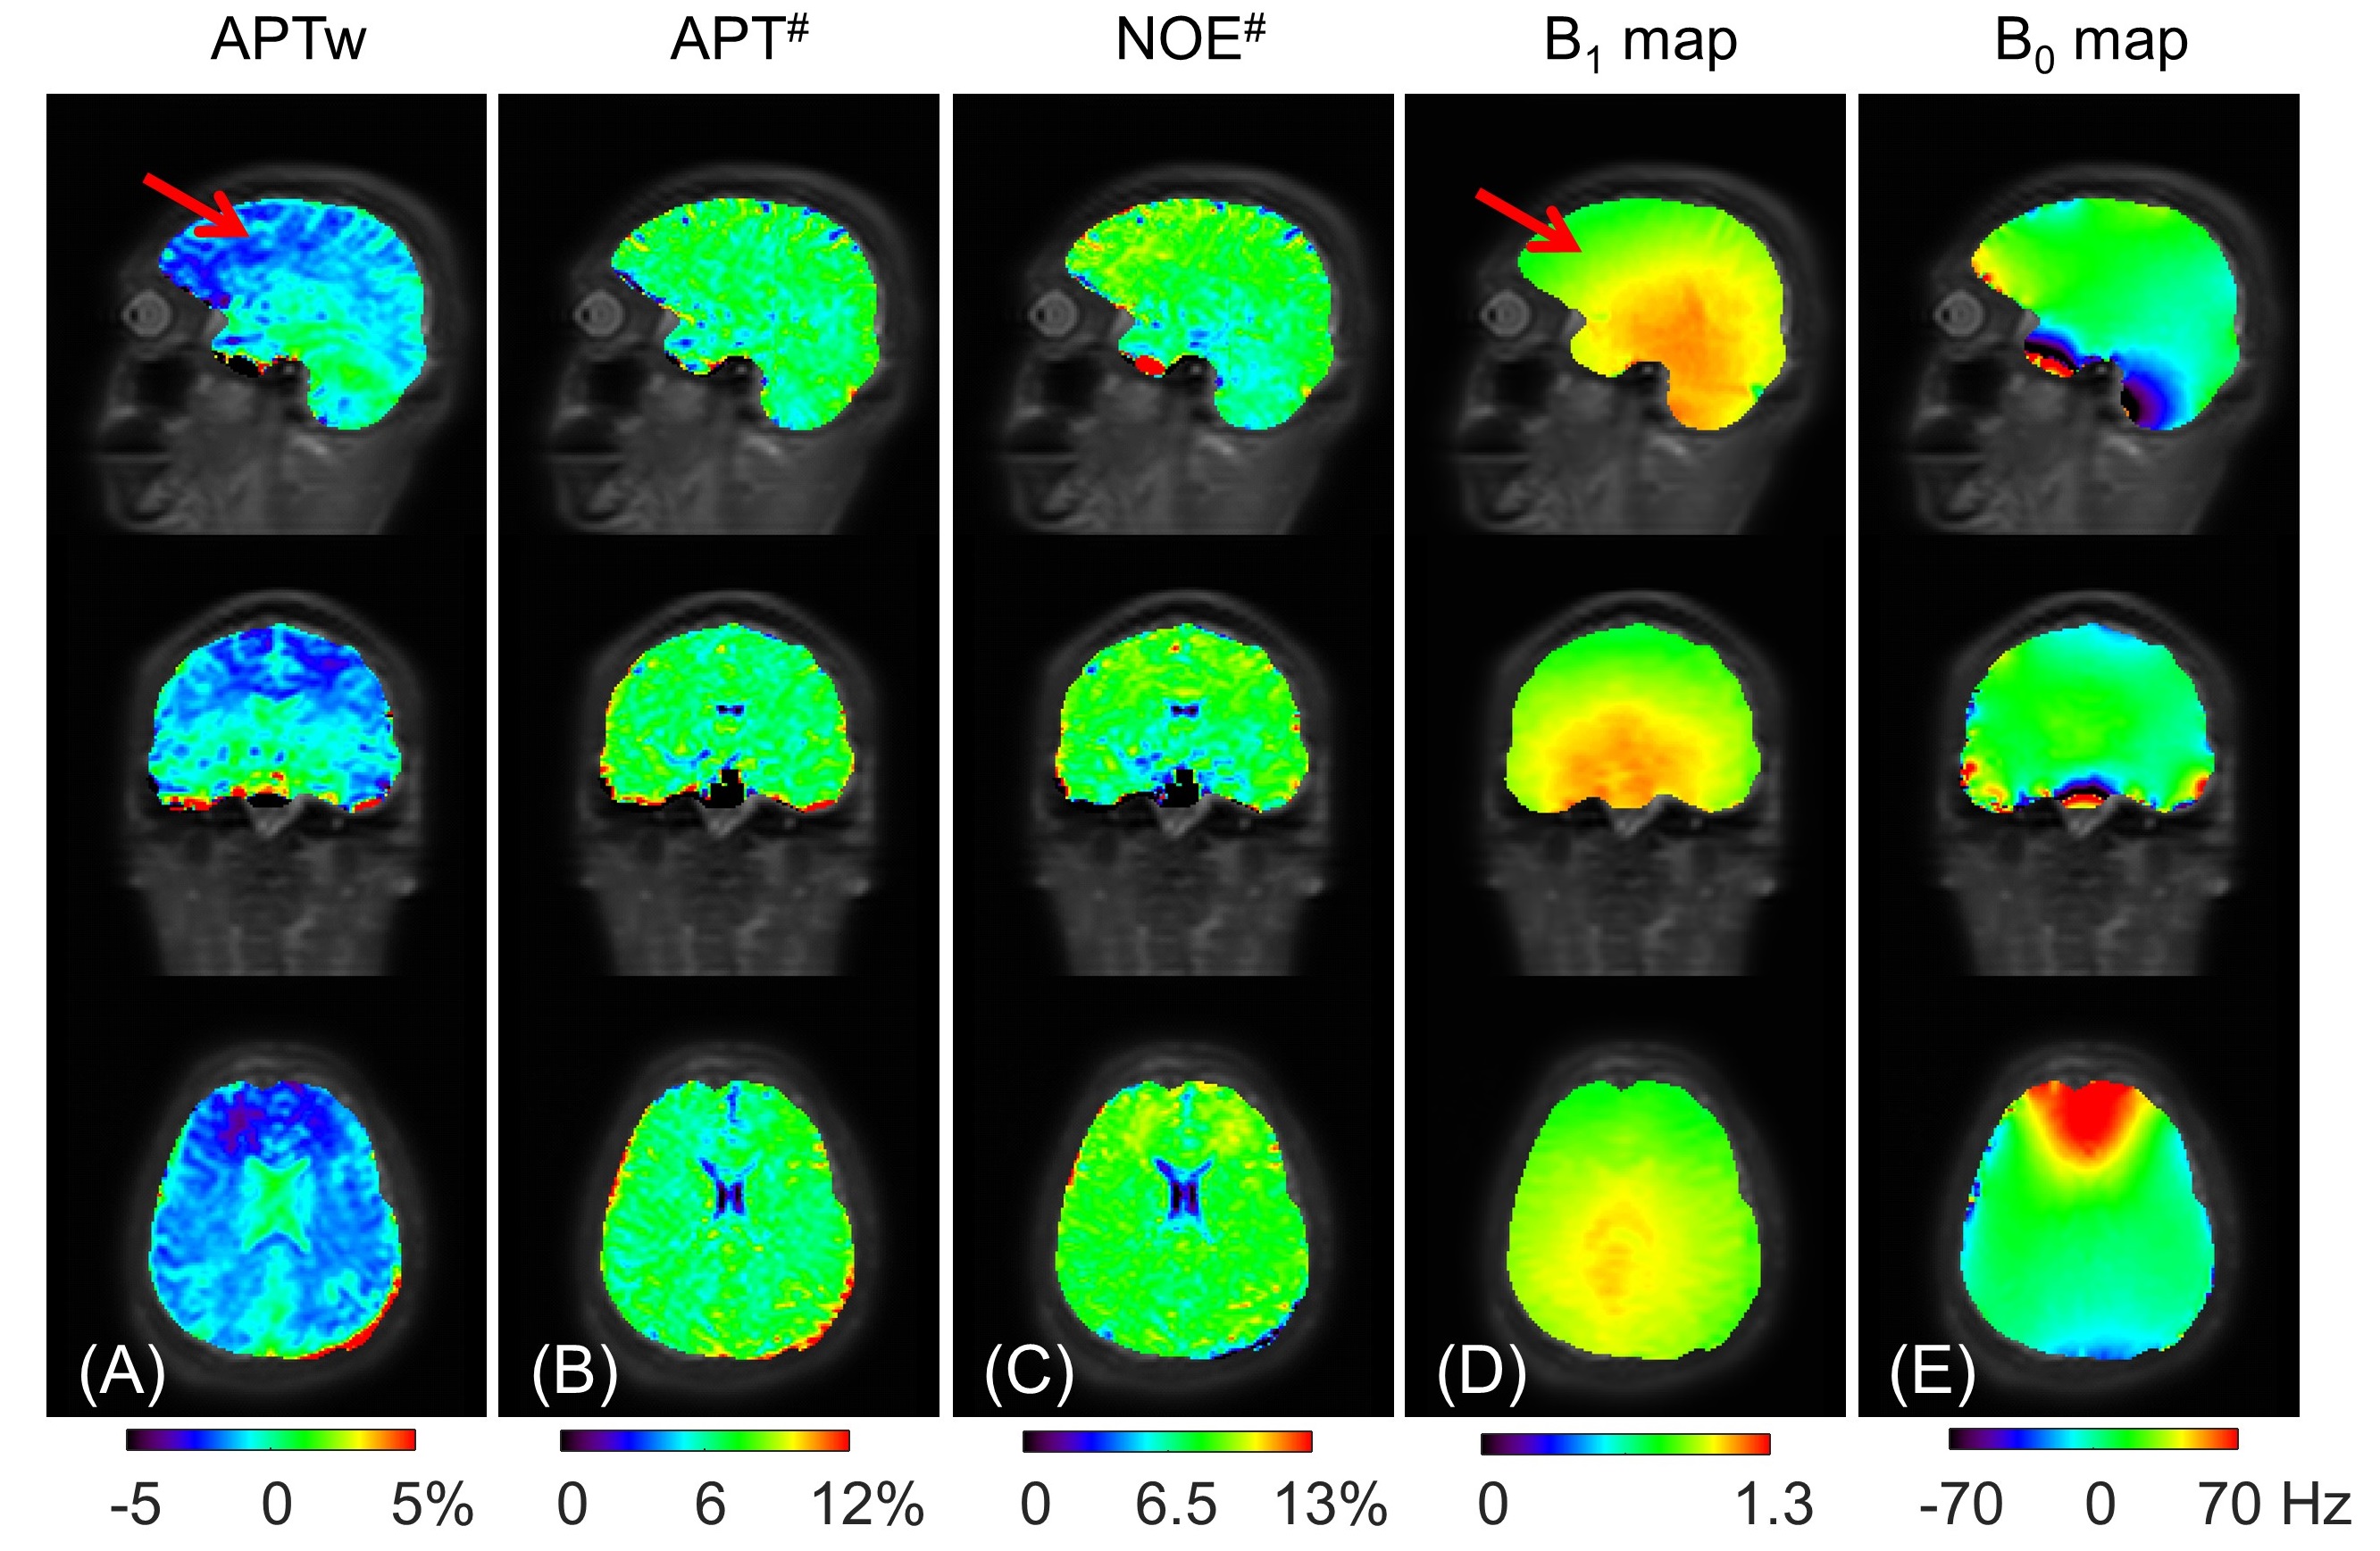
Figure 5. The whole-brain APTw map from MTRasym, APT# and NOE# maps by NEMR, B1 map, and B0 map in a healthy human. The red arrows indicate the low signal region on the APTw map and the low B1 region.