2983
PUSHUP-CEST: Calibration free homogeneous saturation for ulta-high field CEST imaging1German Center for Neurodegenerative Diseases (DZNE), Bonn, Germany, 2Université Paris-Saclay, Commissariat à l’Energie Atomique, CNRS, NeuroSpin, Baobab,, Gif sur Yvette, France, 3Institute of Neuroradiology, University Hospital Erlangen, Friedrich-Alexander- Universität Erlangen-Nürnberg (FAU), Erlangen, Germany, 4Department of Physics and Astronomy, University of Bonn, Bonn, Germany
Synopsis
Keywords: CEST & MT, CEST & MT
CEST imaging benefits from the increased spectral resolution at ultra-high field. Due to the inhomogeneous RF field, a B1+-correction is necessary, which requires repeated measurements. The number of required repetitions can be reduced to two by using a ptx-based saturation scheme, like MIMOSA.
We present an alternative saturation scheme that is based on PUSH saturation and universal pulses, which we name PUSHUP. Using this approach, we could reduce the inhomogeneity of the CEST saturation as effectively as MIMOSA while being more SAR efficient.
Introduction
CEST imaging provides insights into the biochemistry of living tissue with unprecedented resolution. It benefits from the increased spectral resolution of ultra-high field. However, repeated measurements are required for B1+-correction1. Using a single-channel transmit coil, areas with low B1+ such as the cerebellum, remain difficult to image within a whole-brain approach. Recently, ptx-based saturation approaches have been developed, most notably multiple interleaved mode saturation (MIMOSA)2, which uses saturation pulses with two different B1-shims in an interleaved fashion and requires only two B1 amplitudes for homogenization. In this work, we present a similar approach based on RF pulse design for saturation homogeneity (PUSH)3 and universal pulses (UP)4, which we named PUSHUP.Methods
The CEST effect predominantly depends on B1rms. PUSH saturation is composed of subpulses with different B1-shims. These shims are optimized such that B1rms is homogenized over the whole brain. Using a preceding B1/B0 database study, PUSH universal pulses (PUSHUP) with three subpulses were calculated. The resulting B1-shims were applied to cosine-filtered Gaussian pulses of 15ms duration. These subpulses were repeated in an interleaved fashion, similar to MIMOSA.The saturation module contains 120 subpulses. Between each subpulse, a delay of one subpulse duration was introduced, leading to a duty cycle of 50%. From the same B1/B0 maps, universal interleaved binomial-11 kt points5 excitation pulses were calculated and used in a whole-brain multi-shot EPI readout6 (1.6mm isotropic resolution, volume TR=4.7s, TE=7.1ms), which followed the saturation module. This was performed with 45 different off-center frequencies.
In one healthy volunteer, who was not part of the database, two different CEST measurements were conducted. In the first measurement, PUSHUP was used, followed by an acquisition with vendor-provided cosine-filtered Gaussian CP mode pulses with an automatically set reference voltage. Both measurements were repeated 5 times with 150%, 50%, 120%, 100%, and 80% of the target-B1 in an interleaved fashion. The measurement time of each CEST acquisition was 10:56min. All measurements were conducted on a 7T+ scanner (Siemens Healthineers) using a 32-channel receive, 8-channel transmit coil (Nova Medical).
Additionally, an MP-RAGE7 sequence with 0.6mm isotropic resolution and channelwise B1 maps were acquired using 3DREAM8. From the B1 data, the effective B1rms was calculated for each saturation module. A brain mask and a cerebellum and brainstem mask were calculated from the MPRAGE using FSL-bet9 and suit10, respectively. For comparison, a MIMOSA B1rms map was calculated with identical mean B1rms, which would require 106% of the PUSHUP-SAR.
For each CEST acquisition, a 5-pool Lorentzian fit11 of the Z-spectra was performed after motion correction using FSL-flirt12. These Z-spectra were interpolated to the target-B1 for the following combinations:
- all 5
- center: 100% of target-B1
- no center: 50,80,120,150%
- outer3: 50,100,150%
- center3: 80,100,120%
- outer2: 50,150%
- center2: 80,120%
Results and Discussion
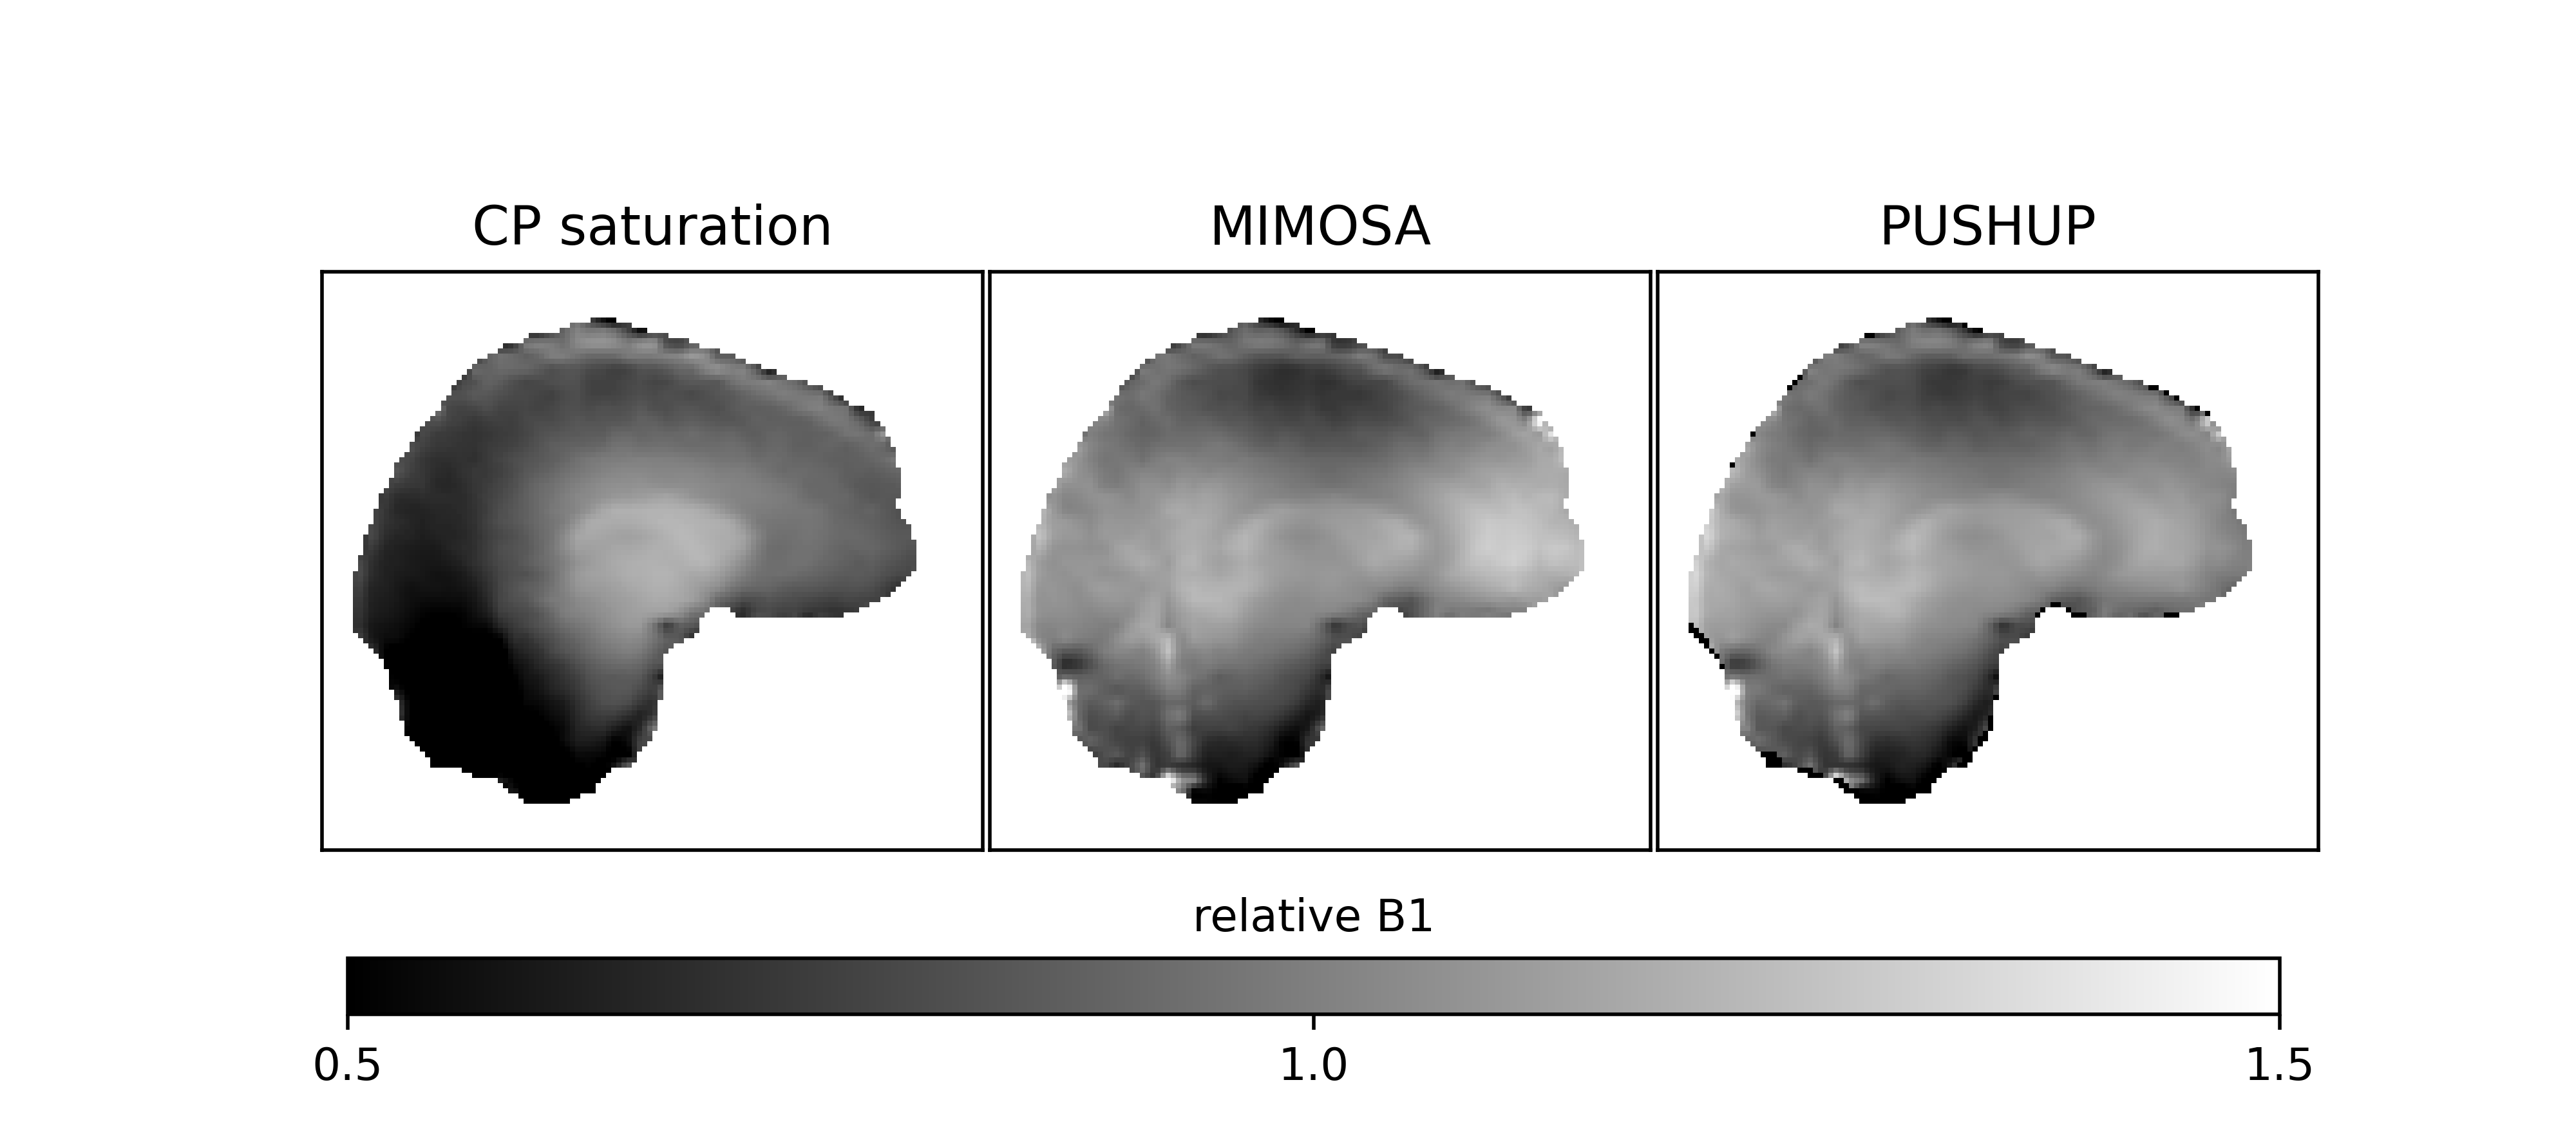
Figure 1 shows the effective B1rms maps for both saturation modules and MIMOSA. PUSHUP and MIMOSA produce similar maps, which are much more homogeneous than the CP map.The B1rms distribution is depicted in Figure 2 for the brain (top) and the cerebellum and brainstem (bottom) for all three saturation modules. PUSHUP and MIMOSA show almost identical B1rms distributions. The CP-B1rms distribution is much broader, and its maximum is significantly shifted towards lower B1rms. If only the cerebellum and brainstem are considered, very low B1rms can be found for the CP mode and only slightly reduced values for PUSHUP and MIMOSA, which again have very similar distributions.
Figure 3 shows the PUSHUP-CEST maps calculated from each combination of PUSHUP amplitudes. In the top row, the CEST maps obtained with all five PUSHUP amplitudes is depicted. In the middle, the CEST maps with the individual PUSHUP amplitudes are shown. In the bottom row, the difference maps are shown. Similar maps are found with all combinations of more than three PUSHUP amplitudes. This also includes visible contrast within the cerebellum. If only the outer two amplitudes are used, systematic errors are visible in the CEST maps, especially in MT and water. This cannot be seen with the center2 combination. When only one PUSHUP amplitude is considered, strong differences can be seen in all CEST maps.
Figure 4 shows the CEST maps from the CP experiment in the same fashion. Even with all measured saturation amplitudes, the cerebellum contrast is limited, especially in the lower and posterior parts. Also, an asymmetry in left-right direction is visible. Using only four saturation amplitude leads to very little change. Using the outer three amplitudes, differences only occur in some parts of the cerebellum. Removing the outer amplitudes leads to strong differences in the cerebellum and the posterior part of the central brain. Taking only the outer two amplitudes causes differences in the same regions and in the center of the brain.
By varying the regularization in the pulse calculation, PUSHUP-SAR could further be reduced, at the cost of homogeneity. Furthermore, pulses can be optimized for certain brain structures, which might lead to a more homogeneous saturation in target regions.
Conclusion
PUSHUP-CEST allows for whole-brain CEST imaging, including the cerebellum. The B1rms distribution of the PUSHUP saturation module is much narrower than CP and almost identical to MIMOSA whilst being more SAR efficient. Two PUSHUP amplitudes are sufficient for homogeneous whole-brain saturation at 7T.Acknowledgements
This work received financial support from the European Union Horizon 2020 Research and Innovation program under grant agreement 885876 (AROMA) and through the German Federal Ministry of Education and Research (BMBF; funding code 01ED2109A) as part of the SCAIFIELD project under the aegis of the EU Joint Programme - Neurodegenerative Disease Research (JPND) (www.jpnd. eu).References
1. Windschuh, J. et al. Correction of B1-inhomogeneities for relaxation-compensated CEST imaging at 7T. NMR Biomed 2015
2. Liebert, A. et al. Multiple interleaved mode saturation (MIMOSA) for B1+ inhomogeneity mitigation in chemical exchange saturation transfer. Magn Reson Med. 2019
3. Leitão, D. et al. Parallel transmit pulse design for saturation homogeneity (PUSH) for magnetization transfer imaging at 7T. Magn Reson Med. 2022
4. Gras, V. et al. Universal pulses: A new concept for calibration-free parallel transmission. Magn Reson Med. 2017
5. Löwen, D. et al. Interleaved binomial kT-Points for water-selective imaging at 7T. Magn Reson Med. 2022
6. Akbey, S. et al. Whole-brain snapshot CEST imaging at 7 T using 3D-EPI. Magn Reson Med. 2019
7. Mugler, J. P., & Brookeman, J. R. Three‐dimensional magnetization‐prepared rapid gradient‐echo imaging (3D MP RAGE). Magn Reson Med. 1990
8. Ehses P. et al. Whole‐brain B1‐mapping using three‐dimensional DREAM. Magn Reson Med. 2019;
9. Smith S. M. Fast robust automated brain extraction. Human Brain Mapping 2002.
10. Diedrichsen J. A spatially unbiased atlas template of the human cerebellum. Neuroimage 2006
11. Mennecke A e al. 7 tricks for 7 T CEST: Improving the reproducibility of multipool evaluation provides insights into the effects of age and the early stages of Parkinson’s disease. MR Biomed 2022
12. Jenkinson M.et al. Improved Optimisation for the Robust and Accurate Linear Registration and Motion Correction of Brain Images. NeuroImage 2002.
Figures