2982
Evaluation of Biological Metabolic Activity within an Atherosclerotic Plaque using Chemical Exchange Saturation Transfer Imaging
Yuki Kanazawa1, Tosiaki Miyati2, Masafumi Harada1, Mitsuharu Miyoshi3, Yuki Matsumoto1, Hiroaki Hayashi2, Yasuhisa Kanematsu1, and Yasushi Takagi1
1Tokushima University, Tokushima, Japan, 2Kanazawa University, Kanazawa, Japan, 3Global MR Applications and Workflow, GE Healthcare Japan, Hino, Japan
1Tokushima University, Tokushima, Japan, 2Kanazawa University, Kanazawa, Japan, 3Global MR Applications and Workflow, GE Healthcare Japan, Hino, Japan
Synopsis
Keywords: CEST & MT, Atherosclerosis
We demonstrated biological metabolic activity within an atherosclerotic plaque of the carotid artery using CEST imaging. 35 patients with carotid stenosis, of which all were pathologically diagnosed with carotid endarterectomy, were evaluated. The following estimation parameters in CEST image were evaluated; bulk water, magnetization transfer, amide proton transfer (APT), and nuclear Overhauser effect (NOE). As a result, there were weak positive correlations between T1w-signal-ratio and the above-mentioned parameters: bulk water (R = 0.37), APT (R = 0.39), and NOE (R = 0.37). Multi-parametric analysis of CEST imaging can obtain detailed information concerning the activity in an atherosclerotic plaque.INTRODUCTION
Atherosclerotic plaques have various pathological features, ranging from plaques rich in lipid components and inflammatory cells to fibrous plaques poor in these. A lipid-rich necrotic core (LRNC) has vigorous coagulation activity and tends to form large thrombi with more fibrin content when the plaque ruptures. Plaque ruptures are often asymptomatic, and the growth and enlargement of thrombus are also a factor leading to the onset of cardiovascular events. A thrombus at a plaque rupture site is formed from a large amount of fibrin in addition to platelets. It is known that the ratio of fibrin in a thrombus is particularly high in plaques containing many lipid components such as cholesterol and inflammatory cells such as macrophages [1]. On the other hand, because signal patterns of atherosclerotic plaques of the carotid artery from conventional MRI using T1w and T2w images overlap considerably during clinical studies, it is difficult to distinguish detailed characteristics of lipid components and inflammatory cells [2]. In our previous study [3], it was found that chemical exchange saturation transfer (CEST) imaging of atherosclerotic plaques of the carotid artery should be evaluated by distinguishing amid proton transfer (APT) and nuclear Overhauser effect (NOE). If CEST imaging can detect mobile proteins such as fibrin found within a plaque, it may lead to the evaluation of plaque activity including the generation of a thrombus. The purpose of our study was to assess the characteristics of the activities of atherosclerotic plaque formations of the carotid artery using the multi-pool model CEST-MRI.METHODS
This study was approved by the institutional review board, and all imaging datasets for the 35 patients with carotid stenosis were acquired under proper explanations of informed consent. After the MRI examinations, all patients had carotid endarterectomy (CEA). On a 3.0 Tesla MR system (Discovery 750, GE Healthcare), CEST imaging was performed using a single-shot fast spin-echo (SSFSE) sequence and phase cycle radio frequency (RF) preparation; the frequency offset range was from -7 to +7 ppm at intervals of 0.5 ppm, and a total of 29 data points were acquired. The mean B1 values of the MT pulses were set at 0.5 and 1.0 µT, and the RF duration time was 1.5 sec. The followings are other imaging parameters; echo time, 27.9 ms; repetition time, 5719 ms; bandwidth, 473 Hz/pixel; field of view, 16 cm; matrix size, 128 × 128; slice thickness, 3 mm. Slice positions were set at one and/or two slices on plaque observed with maximum area. Acquired imaging data were applied to B0 correction and motion correction for each pixel. Post-processing of CEST imaging was performed using the multi-pool model Bloch equation and derived four parameters; bulk water, magnetization transfer (MT), amide proton transfer (APT), and nuclear Overhauser effect (NOE) [4]. Then APT and NOE concentration maps were generated. To compare CEST images, conventional black blood MRI (T1w and T2w images) was acquired. Regions of interest were manually outlined on MR images for areas of whole plaques and sternocleidomastoid muscle areas. Then, conventional MRI signals were normalized by muscle signals. Regression analysis and Mann-Whitney U test were performed. Additionally, CEST imaging and pathological findings were compared.RESULTS & DISCUSSION
Figure 1 shows the scattered relationship between conventional MR signal and estimation parameter in the plaque regions. There were weak positive correlations between T1w-signal-ratio and estimation parameters; bulk water (R = 0.37), APT (R = 0.39), and NOE (R = 0.37). On the other hand, there was no correlation between T2w-signal-ratio and each estimation parameter. Figure 2 shows boxplot measured values of APT and NOE signals in the plaque regions. There was no significant difference between with and without fibrin findings. Figures 3 and 4 show obtained images and Z-spectrum / MT ratio asymmetry curves of patients having atherosclerotic plaques. Both APT and NOE signals were high, as seen in Fig. 3; the pathological findings were observed as calcification and hemorrhage in atherogenesis. On the other hand, APT signal was high, and NOE was low, as seen in Fig. 4; the pathological findings were observed as a red thrombus in the vessel lumen. For these pathological findings in our study, there were observed atherogenesis formations for all, in which there was almost observed hemorrhage and/or thrombus. The large variations in APT signal may indicate the stage of the activities of atherosclerotic plaque from hemorrhage to thrombus formation.CONCLUSION
Multi-parametric analysis of CEST imaging makes it possible to obtain detailed information concerning activities, such as the growth and enlargement of thrombus, in an atherosclerotic plaque.Acknowledgements
No acknowledgement found.References
- Zaman AG, Helft G, Worthley SG, et al. The role of plaque rupture and thrombosis in coronary artery disease. Atherosclerosis. 2000;149(2):251-66.
- Károlyi M, Seifarth H, Liew G, et al. Classification of coronary atherosclerotic plaques ex vivo with T1, T2, and ultrashort echo time CMR. JACC Cardiovasc Imaging. 2013 ;6(4):466-74.
- Kanazawa Y, Harada M, Miyati T, et al. Chemical Exchange Saturation Transfer Imaging for Atherosclerotic Plaques. Proceedings of ISMRM. 2020; 28:2128.
- Miyoshi M, Matsuda T, and Kabasawa H. CEST Peak Extraction method for multi peak fitting. Proceedings of ISMRM. 2015; 23:3346.
Figures
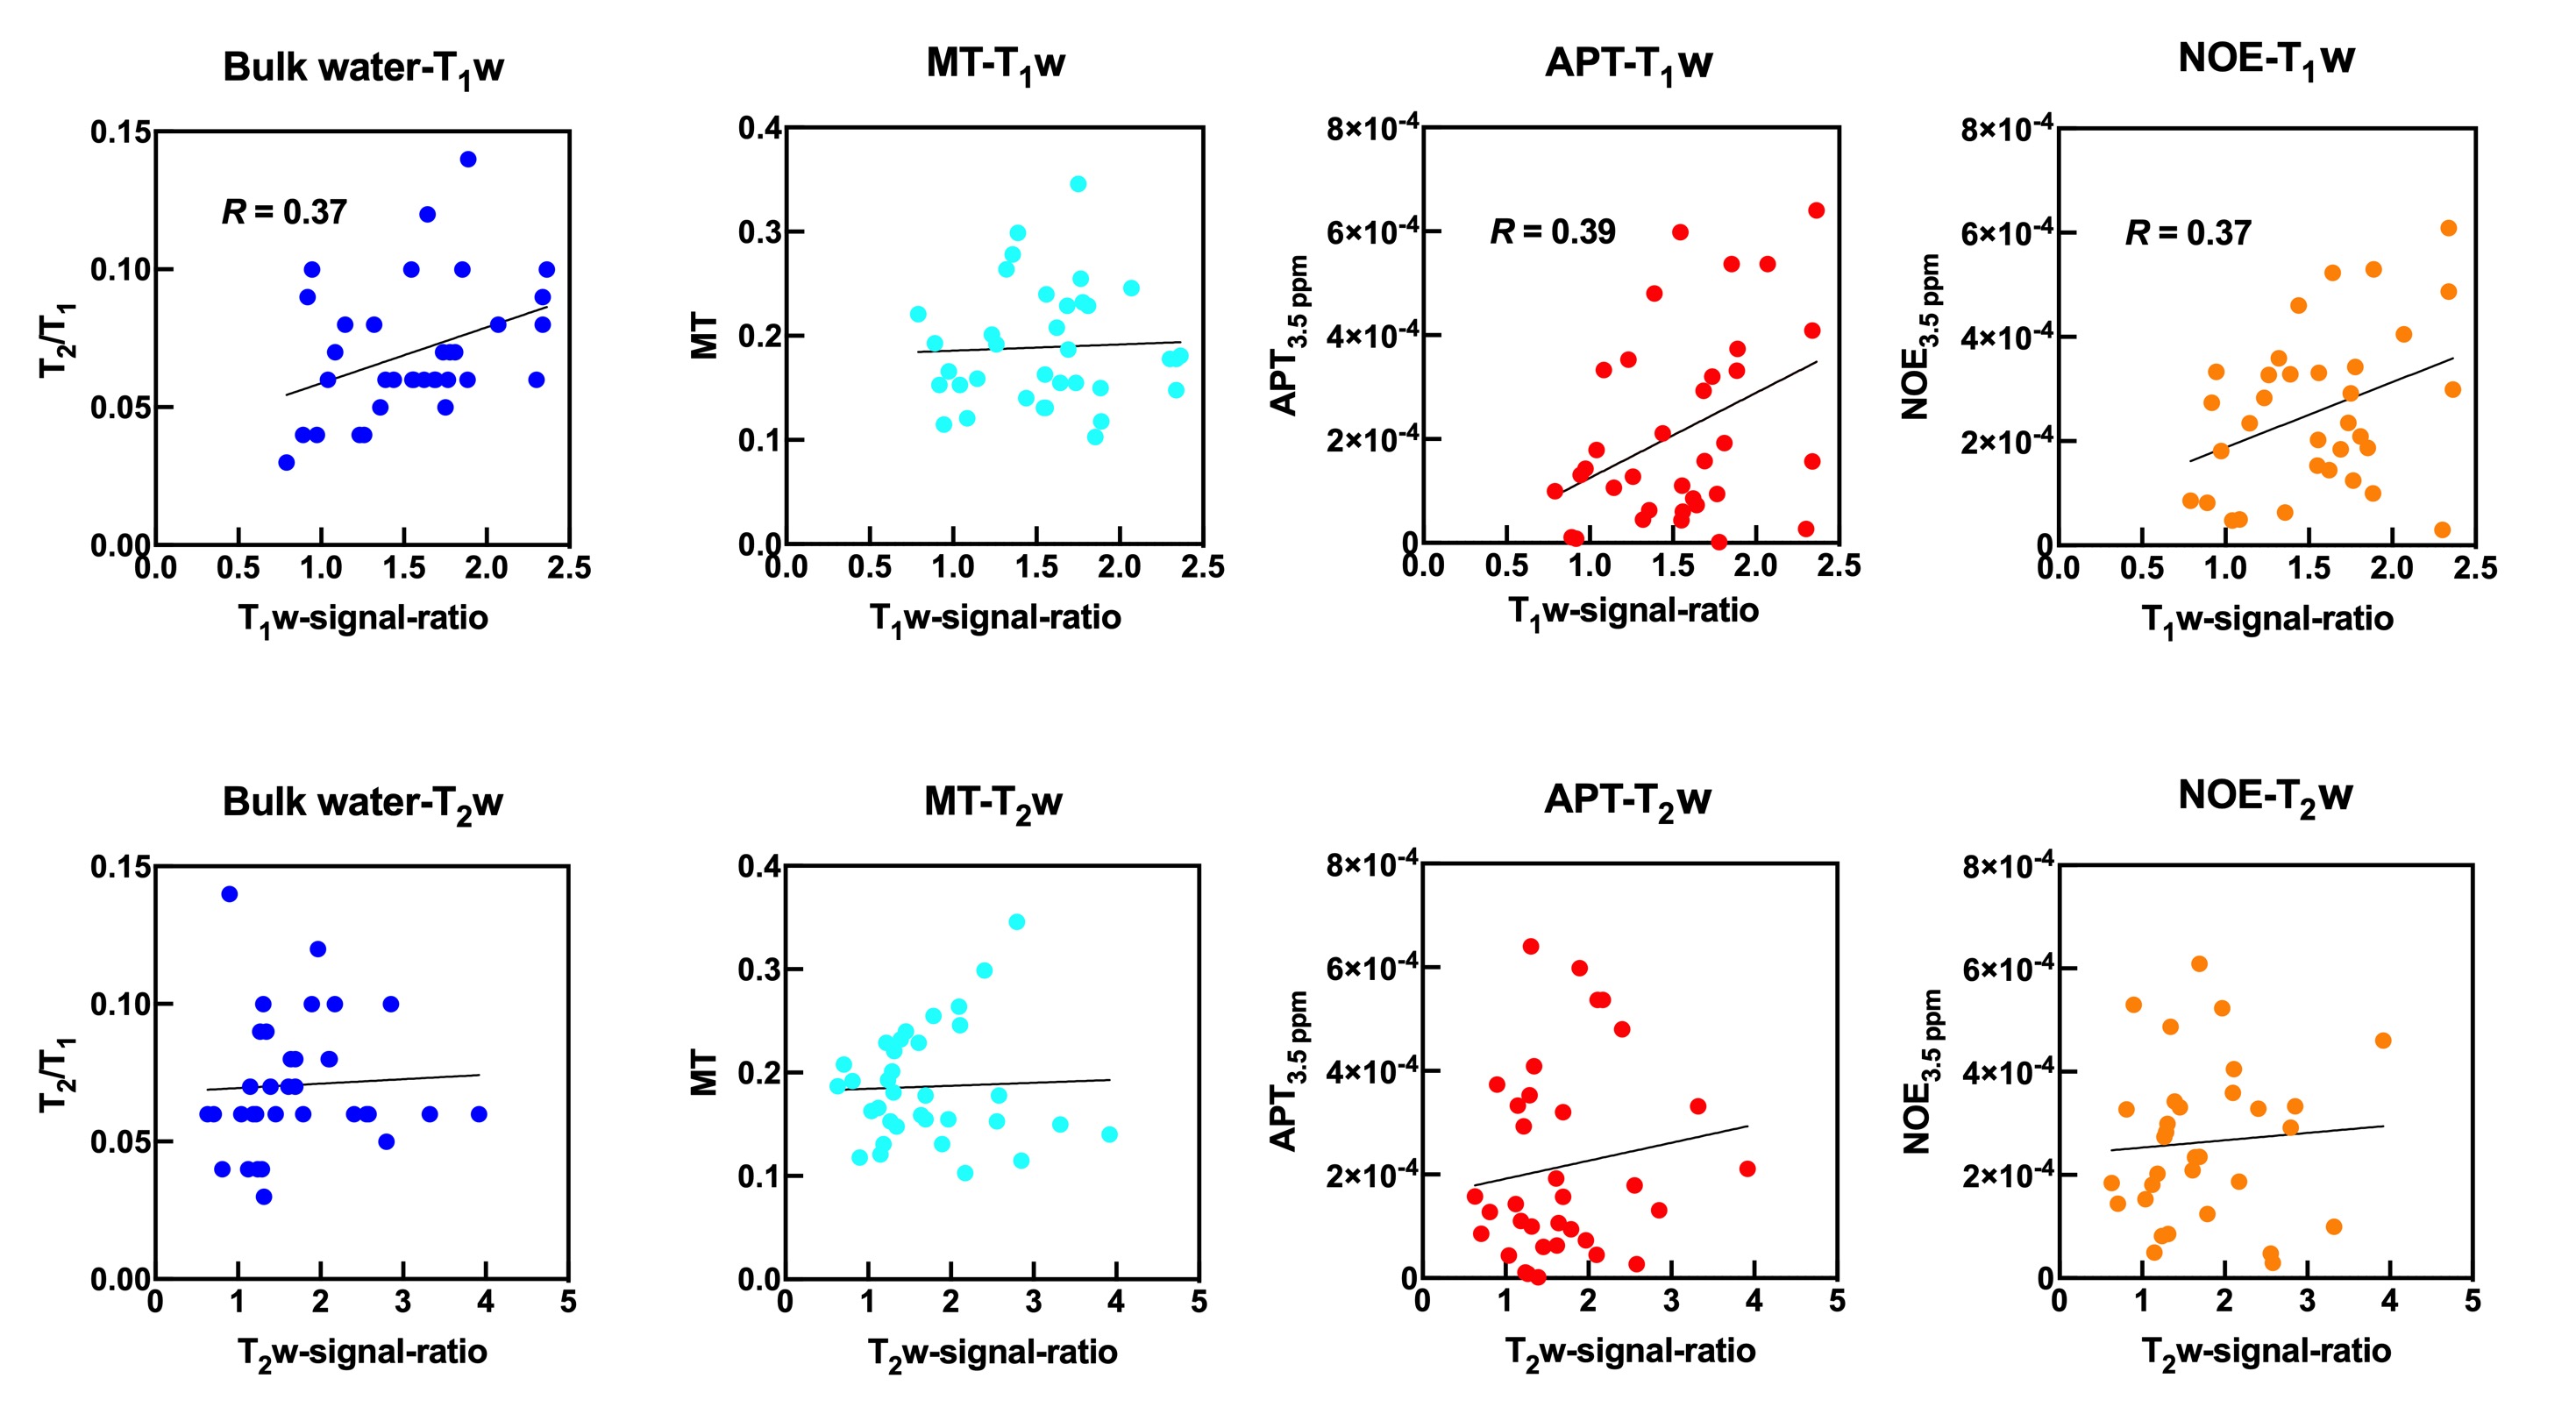
Figure 1 Scatter plots of each conventional MRI signal and each estimated parameter of CEST for 35 subjects.
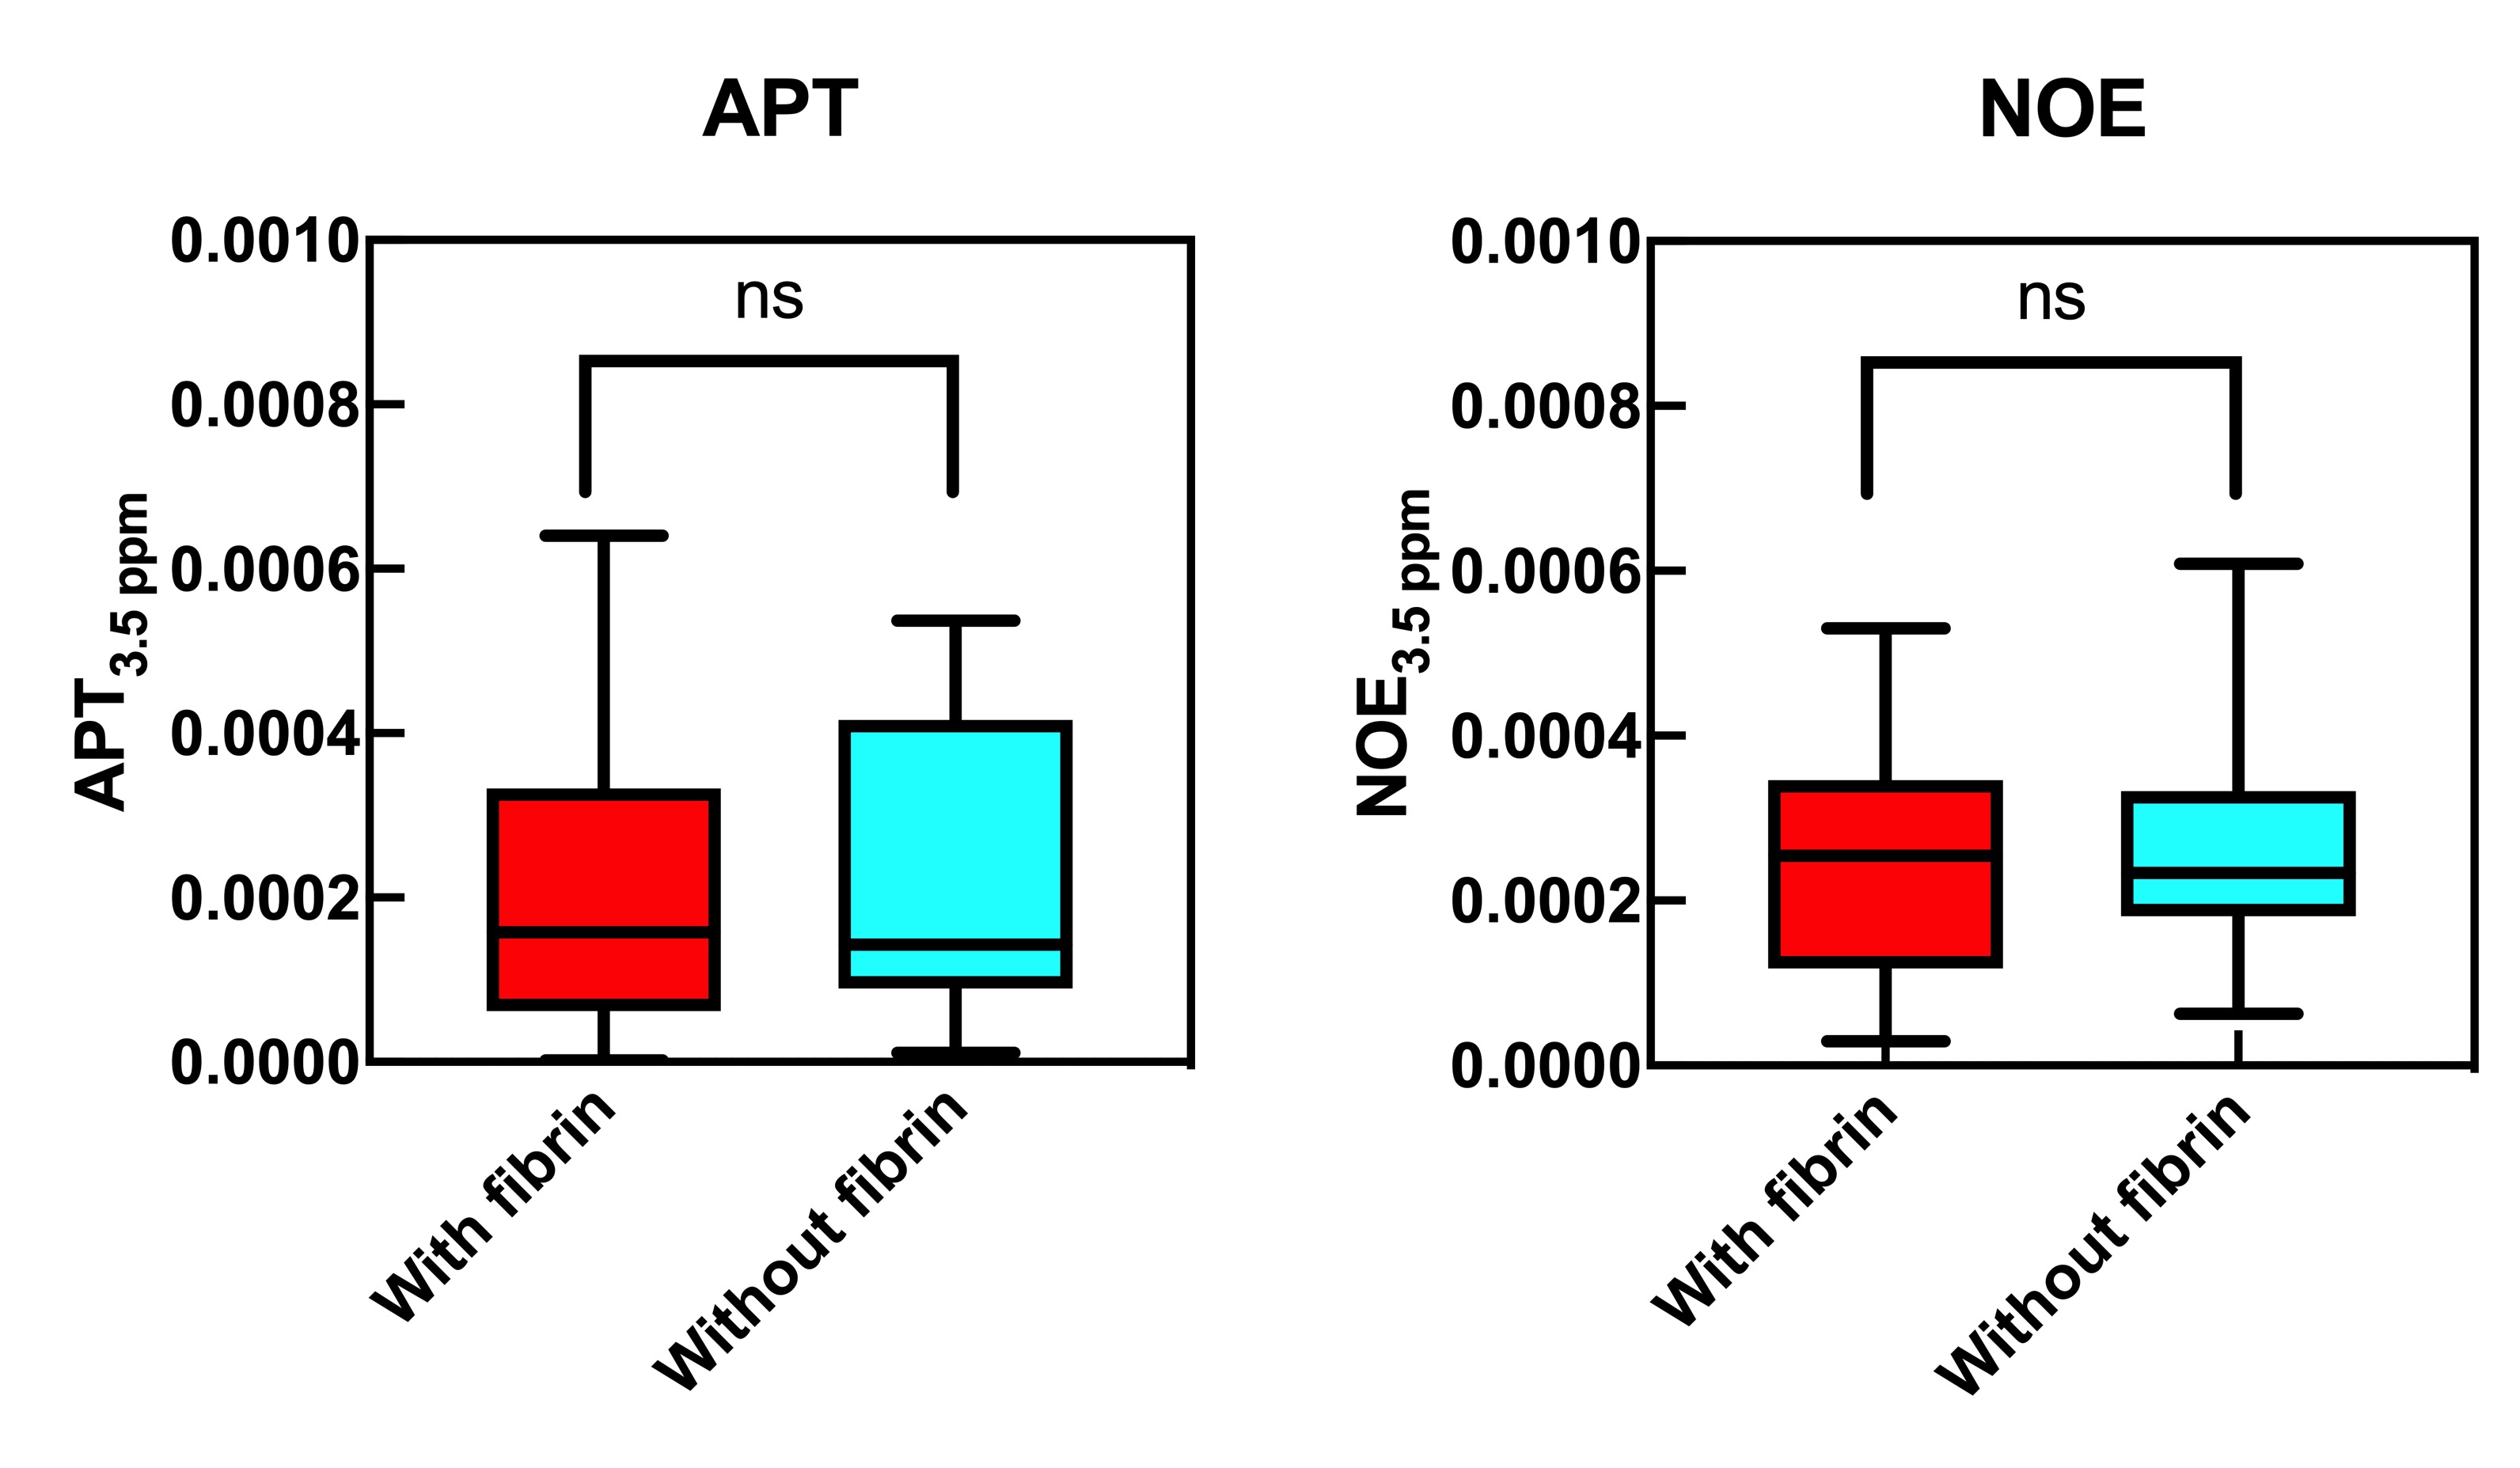
Figure 2 Boxplots of measured values of each APT and NOE signal in the plaque regions.
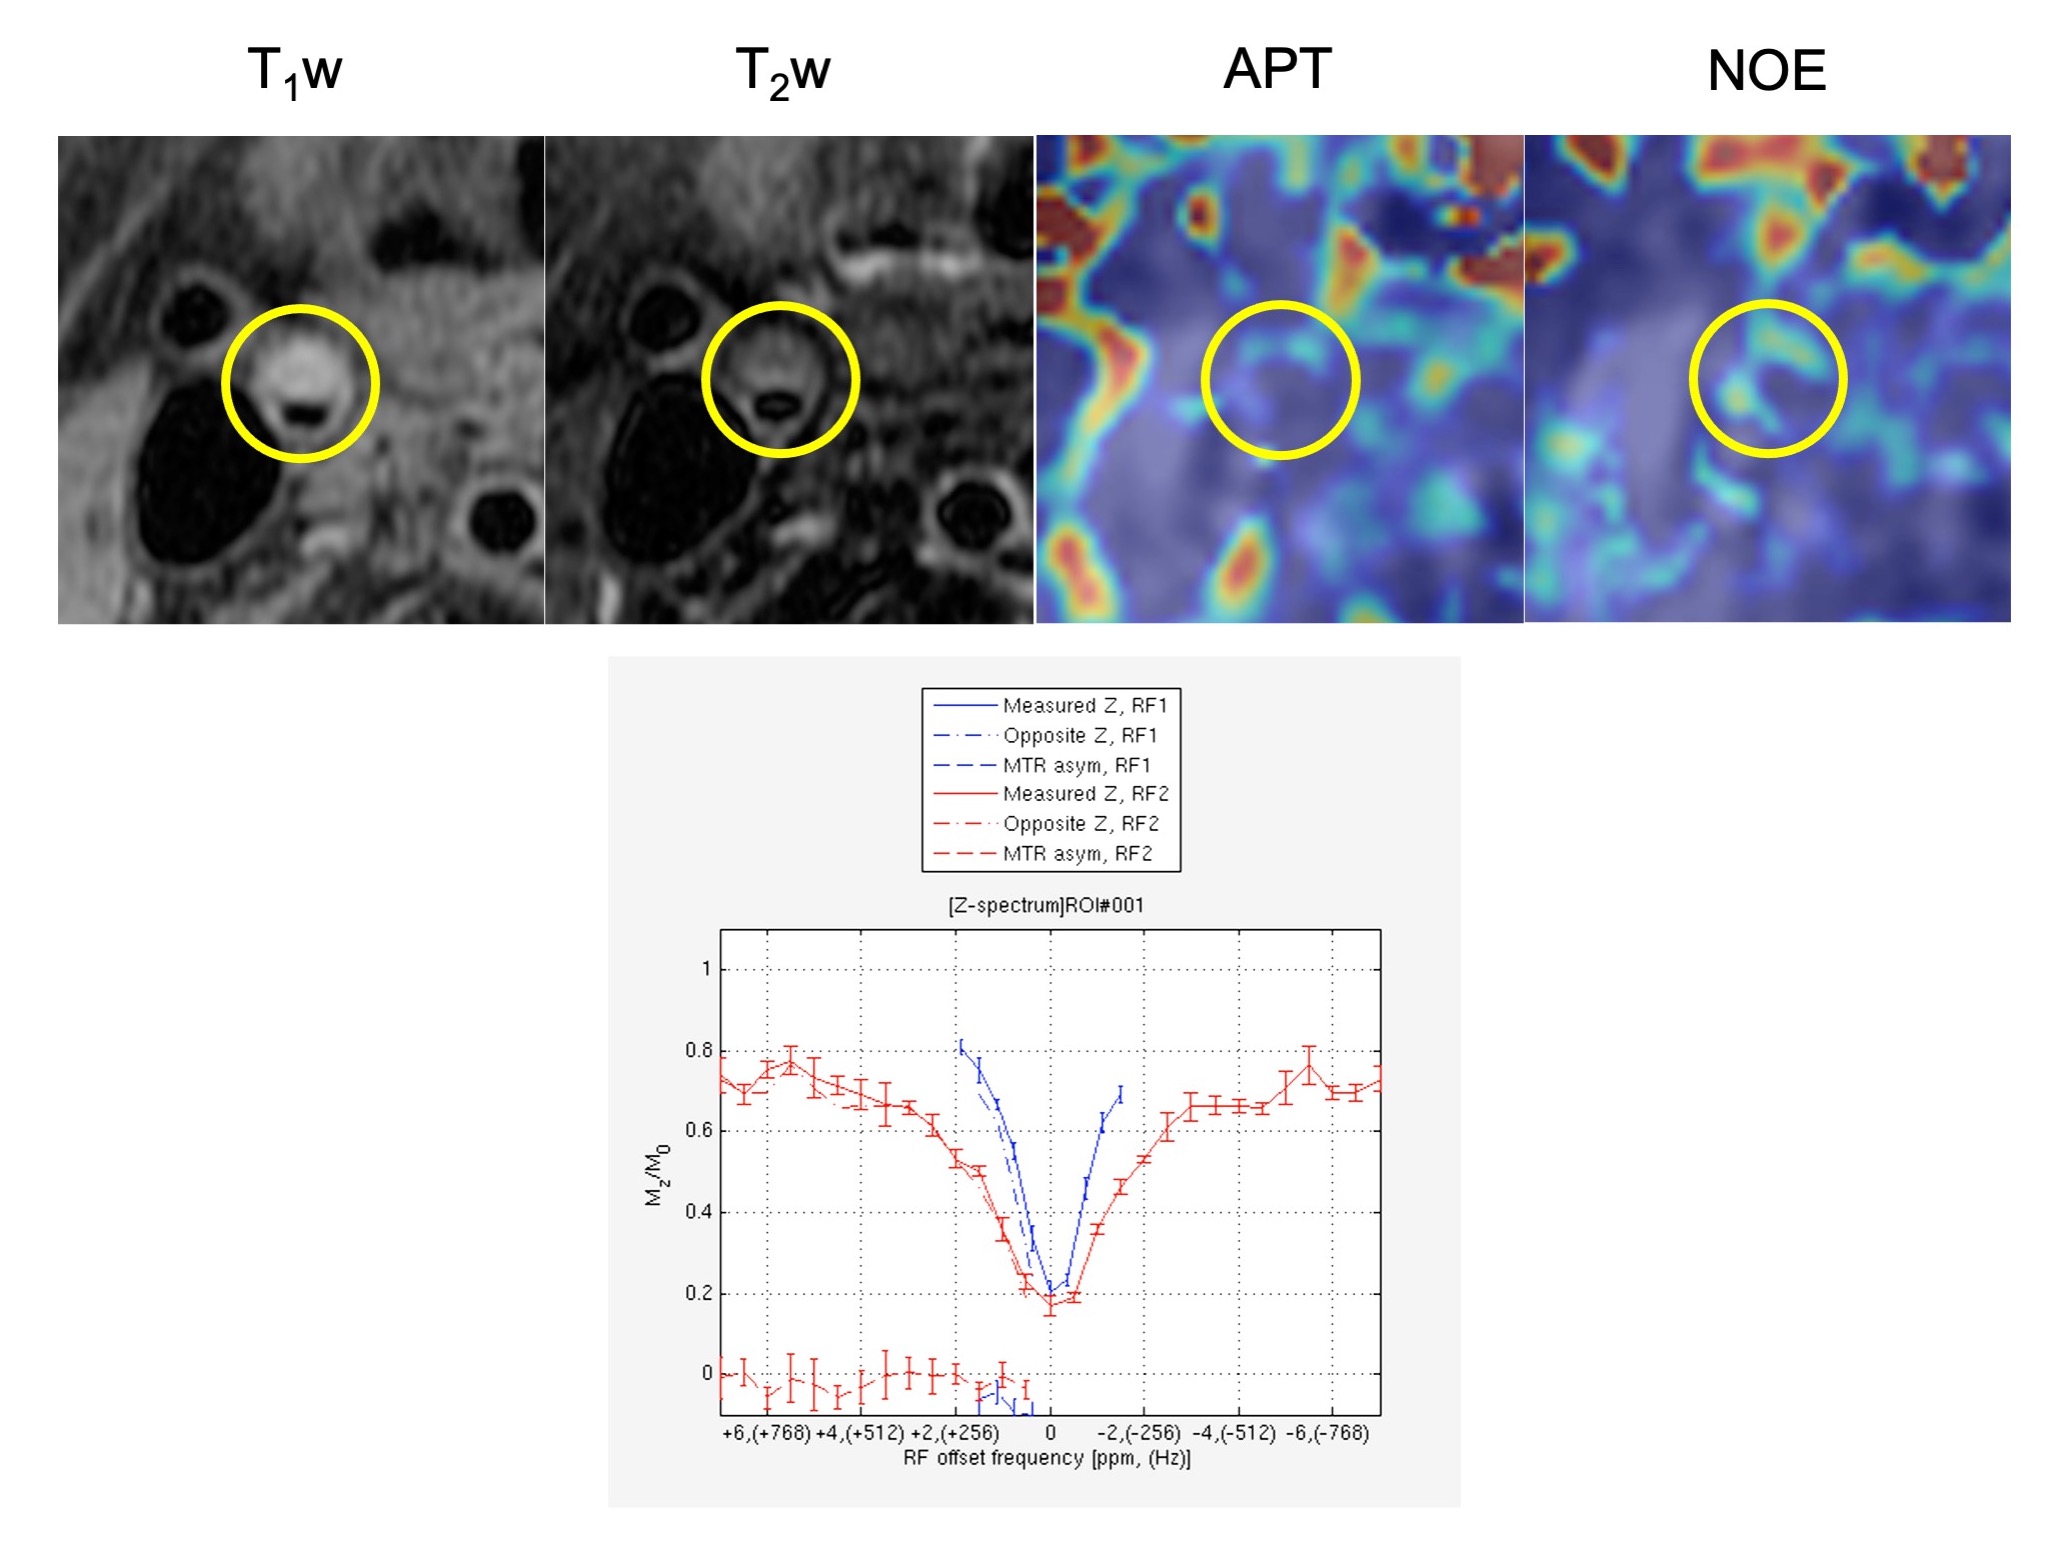
Figure 3 A 79-year-old male with atherosclerotic plaque. Within yellow circles, there indicate a plaque lesion.
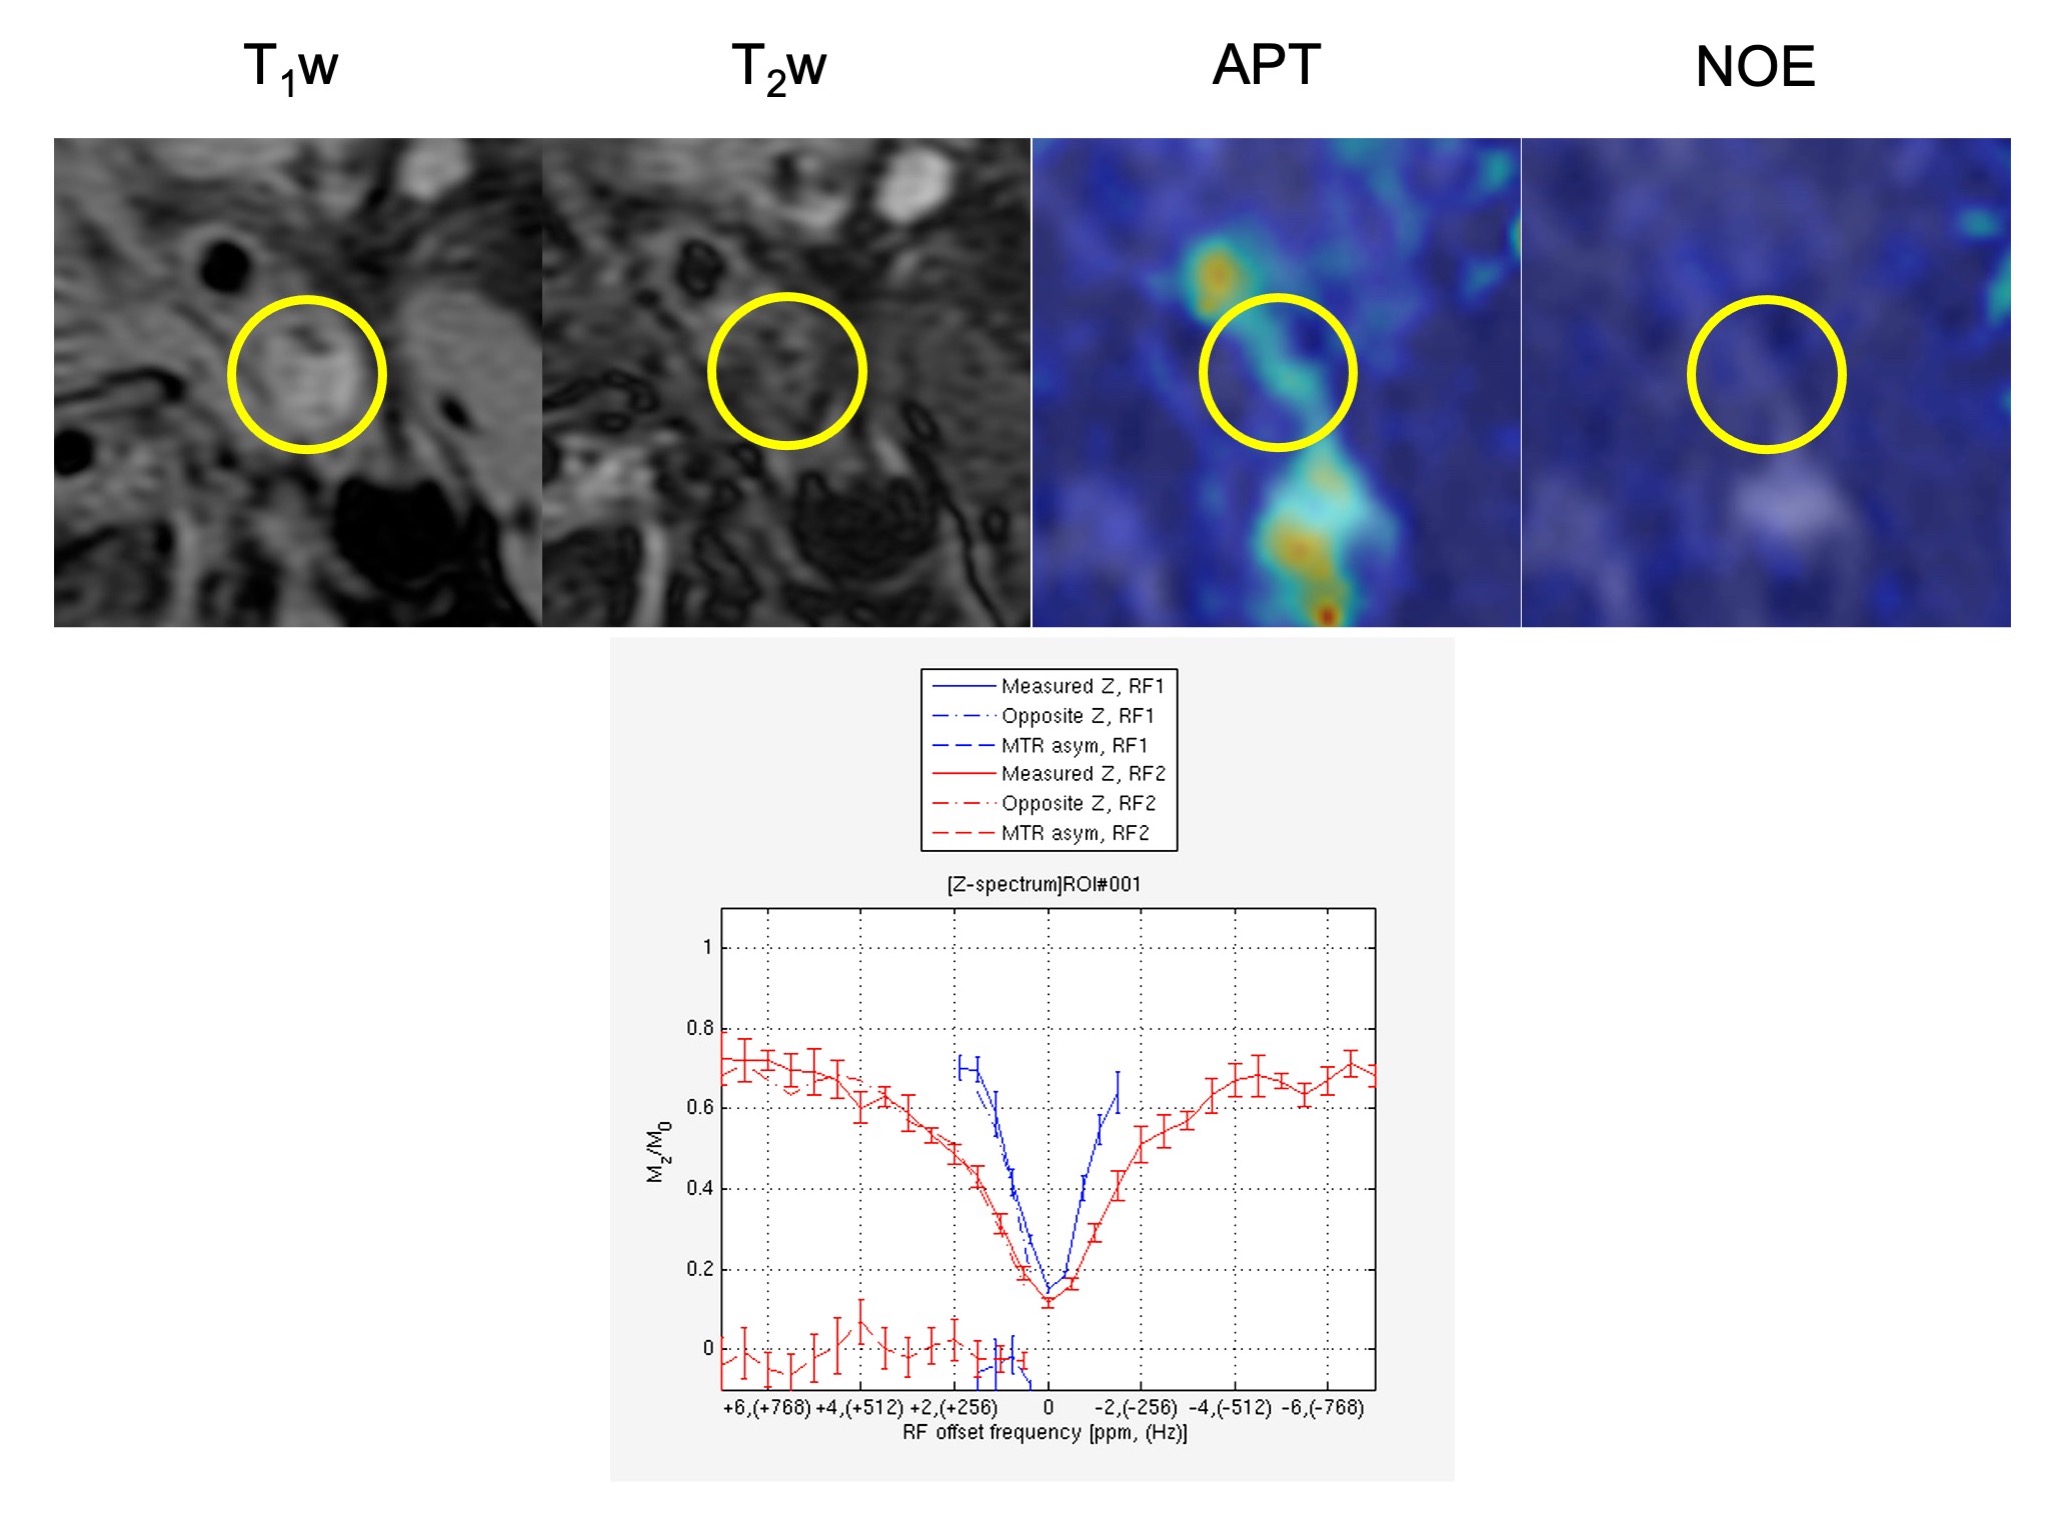
Figure 4 A 77-year-old female with atherosclerotic plaque. Within yellow circles, there indicate a plaque lesion.
DOI: https://doi.org/10.58530/2023/2982